Global prevalence and projections for DM indicates that it has attained epidemic proportion, and is rising at an alarming rate, with about half a billion (463 million people) living with the disease in 2019 [1]. Family History of Diabetes (FHD) is a recognised risk factor for DM, especially Type 2 DM (T2DM) with a two to five fold risk than people without FHD [2,3]. Development of DM in relatives of people with the disease, who carry susceptible genes, is dependent on interaction with other factors such as nutrition, physical activity, environment, culture and ethnicity [3,4].
Studies have shown convincingly that T2DM can be prevented or delayed by lifestyle changes. Two landmark studies (conducted in Finland and USA) found that T2DM, incidence was reduced by 58% in high risk individuals, through lifestyle measures [5,6]. In addition to elevated risk for DM, people with FHD are also at risk of developing CVD risk factors such as obesity, hypertension, and dyslipidaemia [7-9]. But in contrast to the above, a case-control study in Nigeria found no difference in the metabolic parameters between participants with or without FHD, who had metabolic syndrome [10].
The reason for this unusual and surprising observation is unknown. Why are there no differences in the CVD risk factors between people with and without FHD in the Nigerian study? We suspect that environmental factors may be responsible. For example, consumption of red meat and poultry has been associated with elevated and lower incidence of T2DM, respectively [3]. Consumption fruits/vegetables and increased physical activity are also associated with lower risk of T2DM [3]. This study aimed to determine the prevalence of metabolic syndrome and impact of lifestyle on the CVD risk factors among adult Nigerian with FHD. It was hypothesised that adoption of healthier lifestyle by people with FDH may ameliorate or modify (explain the lack of expected excess) CVD risk factors.
Materials and Methods
This was a cross-sectional study conducted during a health screening exercise involving staff and students of the Ekiti State University, and Ekiti State University Teaching Hospital (EKSU/EKSUTH) between August and December 2018. Five hundred and sixty-two participants which included students, academic and non-academic staff of EKSU/EKSUTH, Ado-Ekiti, Nigeria were recruited through convenient sampling.
Inclusion criteria for cases were: 1) Adults, 18 years and above; 2) Those who gave history of DM in at least one First Degree Relative (FHD). The controls included adults, 18 years and above, with no FHD. Thus, 86 participants with FHD were age- and sex-matched with 86 participants who had no FHD. Since environment can influence CVD risks, the study participants with similar workplace and study environment were considered. The exclusion criteria were those with a history of memory or neurological impairments, or both, that would limit reading, talking, or walking. Research and Ethics Committee of Ekiti State University Teaching Hospital, Ado-Ekiti approved the study protocol (EKSUTH/A67/2018/08/004). Participants gave written informed consent for the study. Metabolic syndrome was defined according to the IDF criteria [11].
Measurements: With the aid of a pre-tested structured interview questionnaire, demographic data such as age, gender, marital status, educational attainments and occupation were obtained from the participants. History of smoking, physical activity, consumption of fruits and vegetables as well as animal protein was documented. Physical activity was categorised as none, occasionally, <3-4 times/week and >3-4 times/week, while intake of fruits/vegetables was categorised as none, occasionally, <5 portions/day and >5 portions/day. Meat consumption was categorised as fish, poultry, beef/mutton/chevon, game and others.
Anthropometric and blood pressure measurements: Clinical measurements of weight, height, waist and hip circumferences and blood pressures were obtained by standard protocols. Weight to the nearest 0.1 kg while the participants were barefooted, and height to the nearest 0.1 m without head-gear, were determined with bathroom scales and stadiometer respectively. The BMI was taken as the ratio of weight to the square of the height, while the Waist-to-Hip Ratio (WHR) was calculated from the values of waist and hip circumferences. The blood pressure was determined with mercury sphygmomanometer. The first and fifth Korotkoff sounds were taken as the systolic and diastolic blood pressures respectively.
Blood sampling: Laboratory parameters of interest included fasting plasma glucose and lipid panel. After an overnight fast, venous sample were obtained through aseptic techniques. Plasma glucose was determined by glucose oxidase method. Glucose oxidase reacts with glucose to form gluconic acid and hydrogen peroxide. A colourless chromogen is oxidised to a coloured product whose concentration is proportional to the amount of glucose in the plasma. Total cholesterol and triglyceride were determined by enzymatic method. High Density Lipoprotein (HDL) cholesterol was estimated by oxidase/peroxidase method after precipitation of other cholesterol fractions. Low Density Lipoprotein (LDL) cholesterol was calculated by Friedewald equation expressed as: LDL cholesterol=Total cholesterol-HDL cholesterol-(triglyceride/5).
Statistical Analysis
Pearson’s Chi-square was used to test the differences in the frequency distribution of the categorical variables people with and without FHD. Continuous variables were expressed as means (SD) and compared with Students t-test. Binary logistic regression was used to generate odds ratio and level of significance was set at two-sided p-value <0.05. Data analysis was done with Statistical Package for Social Sciences (IBM SPSS) version 25 for Windows (IBM Corp., Armonk, N.Y., USA).
Results
The age, clinical, and anthropometric values were similar between the two groups. However, the fasting plasma glucose tended to be higher among people with FHD [Table/Fig-1]. Participants with FHD consume more poultry (17.6% vs 3.5%) and less red meat (27.1% vs 37.2%) than those without FHD (p=0.036). The level of physical activity and consumption of fruits/vegetables, and smoking did not differ between the two groups [Table/Fig-2].
Age and Cardiovascular (CVD) risk factors in participants with or without family history of DM.
| Variables | Family history (n=86) | No family history of DM (n=86) | p-value |
|---|
| Age (years) | 37.2 | 37.15 | 0.995 |
| BMI (kgm2) | 25.9 (5.2) | 26.18 (5.4) | 0.742 |
| WC (cm) | 85.4 (13.0) | 85.76 (11.6) | 0.831 |
| WHR | 0.88 (0.23) | 0.86 (0.08) | 0.461 |
| WHtR | 0.52 (0.08) | 0.52 (0.07) | 0.957 |
| SBP (mmHg) | 118.5 (17.3) | 117.5 (18.3) | 0.703 |
| DBP (mmHg) | 75.6 (12.7) | 76.5 (12.6) | 0.647 |
| FPG (mmol/L) | 5.0 (1.8) | 4.6 (1.3) | 0.080 |
| TC (mmol/L) | 5.2 (1.5) | 4.9 (1.3) | 0.183 |
| LDL (mmol/L) | 2.8 (1.5) | 2.68 (1.33) | 0.487 |
| TG (mmol/L) | 1.4 (0.8) | 1.3 (0.8) | 0.737 |
| HDL (mmol/L) | 1.9 (0.7) | 1.8 (0.9) | 0.500 |
The student’s t-test revealed no difference in the clinical and laboratory parameters between people with and without FHDs; BMI: Body mass index; WC: Waist circumference; WHR: Waist to hip ratio; WHtr: Waist to height ratio; SBP: Systolic blood pressure; DBP: Diastolic blood pressure; FPG: Fasting plasma glucose; TC: Total cholesterol; LDL: Low density cholesterol; HDL: High density cholesterol; TG: Triglyceride. Values are means (sd)
Lifestyle of participants with or without family history of DM.
| Variables | Family history of DM | No family history of DM | χ2 | p-value |
|---|
| Physical activity N (%) | 0.92 | 0.820 |
| None | 8 (9.3) | 6 (7.0) | | |
| Occasionally | 48 (55.8) | 53 (61.6) | | |
| <3-4 times/week | 13 (15.1) | 10 (11.6) | | |
| >3-4 times/week | 17 (19.8) | 17 (19.8) | | |
| *Meat type N (%) | 11.9 | 0.036 |
| Fish | 44 (51.8) | 50 (58.1) | | |
| Poultry | 15 (17.6) | 3 (3.5) | | |
| Beef/Muton (red meat) | 23 (27.1) | 32 (37.2) | | |
| Games | 1 (1.2) | 1 (1.2) | | |
| Others | 2 (2.4) | 0 (0) | | |
| Fruit/Vegetable intake N (%) | 0.537 | 0.911 |
| None | 2 (2.3) | 2 (2.3) | | |
| Occasionally | 62 (72.1) | 58 (67.4) | | |
| <5 portions/day | 16 (18.6) | 18 (20.9) | | |
| >5 portions/day | 6 (7.0) | 8 (9.3) | | |
| Smoking N (%) | | 1.00 |
| No | 85 (98.8) | 85 (98.8) | | |
| Yes | 1 (1.2) | 1 (1.2) | | |
*One participant among those with FHDs did not indicate the type of meat normally consumed, making the total to be 85 instead of 86; Pearson’s Chi-square
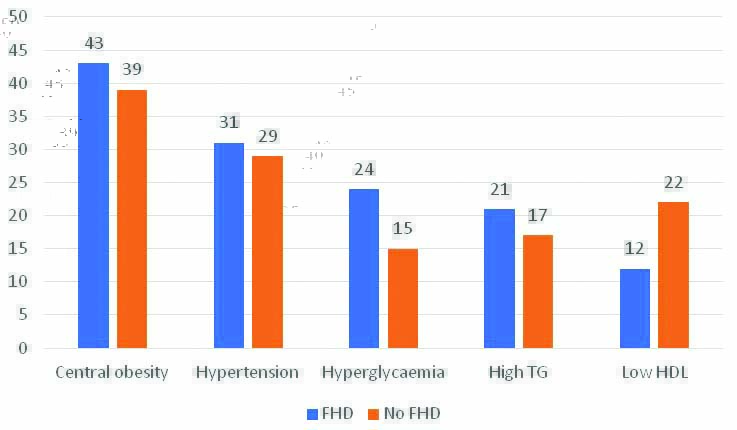
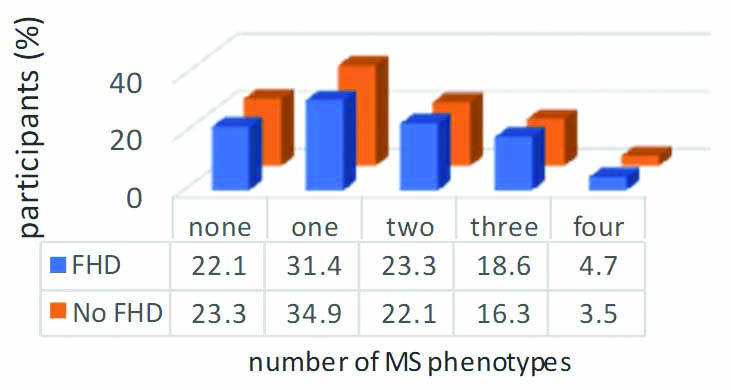
There was no significant difference in the prevalence of CVD risk factors, such as hypertension, hyperglycaemia, dyslipidaemia, and obesity between the two groups. Pearson’s Chi-square (χ2) ranged between 0.102-3.666, and probability (p) values >0.05 for all the CVD factors [Table/Fig-3]. Metabolic syndrome was equally prevalent between the people with or without FHD (p=0.846). The metabolic syndrome phenotypes were equally distributed in the two groups (χ2=0.485, p=0.975) [Table/Fig-4]. There was no statistical difference between the anthropometric, clinical and laboratory parameters of participants with or without FHD who had metabolic syndrome [Table/Fig-5].
Prevalence of cardio-metabolic risk factors among people with and without FHD.
Chart values represent number of participants out of a total of 86 in each group. FHD: FHDs; TG: Triglyceride; HDL: High density lipoprotein; Y axis: Number of patients
Family History of Diabetes (FHD) and metabolic syndrome phenotypes.
MS criteria: one-individuals satisfied only one of the five criteria. two-individuals satisfied only two of the five criteria. three- individuals satisfied three or more of the, four- individuals satisfied four of the five criteria; FHD: Family history of diabetes; MS: Metabolic syndrome; χ2=0.485; p=0.975
Characteristics of participants with metabolic syndrome.
| Variables | Family history (n=17) | No family history of DM (n=16) | t-test | p-value |
|---|
| Age (years) | 42.2 (9.8) | 40.9 (9.9) | 0.378 | 0.708 |
| BMI | 30.4 (4.2) | 30.9 (6.6) | 0.292 | 0.772 |
| WC | 99.5 (7.8) | 96.8 (8.8) | 0.920 | 0.367 |
| WHR | 0.9 (0.1) | 0.9 (0.1) | 1.719 | 0.096 |
| WHtR | 0.6 (0.1) | 0.6 (0.1) | 0.035 | 0.972 |
| SBP | 133.6 (18.1) | 132.38 (9.63) | 0.242 | 0.811 |
| DBP | 85.8 (12.8) | 89.4 (9.9) | 0.919 | 0.365 |
| FBS | 6.0 (2.2) | 5.3 (2.0) | 1.031 | 0.311 |
| TC | 5.4 (1.0) | 5.2 (0.7) | 0.735 | 0.468 |
| LDL | 3.0 (1.3) | 2.7 (1.5) | 0.659 | 0.515 |
| TG | 1.9 (1.2) | 1.7 (1.0) | 0.629 | 0.534 |
| HDL | 1.5 (0.7) | 2.0 (1.3) | -1.27 | 0.218 |
The students t-test revealed no difference in the means of clinical and laboratory parameters between the two groups.
BMI: Body mass index; WC: Waist circumference; WHR: Waist to hip ratio; WHtR: Waist to height ratio; SBP: Systolic blood pressure; DBP: Diastolic blood pressure; FPG: Fasting plasma glucose; TC: Total cholesterol; LDL: Low density cholesterol; HDL: High density cholesterol; TG: Triglyceride Values are means (sd)
Only BMI was significantly associated with metabolic syndrome (OR, 1.32, 95% CI, 1.115-1.361, p<0.001). FHDs and other variables did not predict metabolic syndrome [Table/Fig-6].
Odds ratio for associated factors for Metabolic syndrome.
| Variable | OR | 95% CI | p-value |
|---|
| Age | 1.005 | 0.960-1.051 | 0.839 |
| Sex |
| Male | 1 (reference) 0.651 | 0.235-1.804 | 0.409 |
| Female | | | |
| Family history of diabetes |
| Present | | | |
| Not present | 1 (reference) 1.261 | 0.519-3.059 | 0.609 |
| Physical exercise |
| >3-4/week | 1 (reference) 0.493 | 0.175-1.38 | 0.180 |
| <3-4/week | | | |
| Fruit/vegetable intake |
| >5 portions/day | 1 (reference) 2.561 | 0.642-10.220 | 0.183 |
| <5 portions/day | | | |
| Meat type |
| Fish/poultry | 1 (reference) 0.746 | 0.273-2.037 | 0.568 |
| Red meat | | | |
| Body mass index | 1.323 | 1.115-1.361 | 0.001 |
Discussion
DM is a heterogenous metabolic disorder arising from synergistic interaction among genes, environment, culture and ethnicity [3]. In this current study, we investigated the prevalence of metabolic syndrome and impact of lifestyle on the CVD risk factors among adult Nigerian with FHD. No difference was found between the mean of obesity, blood pressure, glucose and lipid parameters of those with or without FHD. Furthermore, rates of hyperglycaemia, hypertension, obesity, dyslipidaemia and metabolic syndrome did not differ between the two groups.
These finding is consistent with a Nigerian study which compared metabolic variables of people with and without FDH [10]. Specifically, the study revealed that apart from BMI, all the anthropometric, blood pressure and lipid parameters measured were similar between the two groups, and tends to be more favorable among the people with FHD [10]. In contrast to our findings, previous works among Caucasians, Asians and Arabians have established higher prevalence of hypertension, obesity, and dyslipidaemia among persons with FHD compared with those had no such history [8,9,12-14]. Comparative studies revealed adverse metabolic profile among people with FHD [3,8,15-17]. In the study by Moon JH et al., people with FHD had higher prevalence of impaired fasting glucose, T2DM and metabolic syndrome [8]. Additionally, the authors found higher rates of obesity among those with biparental history of diabetes. The report by Tan JT et al., was similar to the above, but also demonstrated increased insulin resistance and decreased B-cell function among people with FHD [17]. Zhao Y et al., and Du X et al., further demonstrated that the impact of FHD on T2DM risk was higher among those with higher risk (both parents or one parent and sibling) compared with those with low risk (uniparental) [3,15].
Genetic predisposition to DM is suggested by the presence of family history in FHDs. Some of the genes attributed to DM inheritance have also been implicated in the development of other CVD risk factors such as obesity, lipid disorders, and hypertension [18-20]. It is not surprising therefore, that apart from increased risk for DM, relatives of people with DM are also at risk of developing related diseases such as hypertension, dyslipidaemia and obesity [21]. Conversely, those who do not have positive FHDs (and presumably, do not carry the susceptible genes) may develop the disease, with the associated CVD derangements if they are sufficiently exposed to adverse metabolic environment [22].
The result from the current study may be due to healthy lifestyle imbibed by participants with FHD, or absence of it by those without FHD, thus cancelling or modifying the expected excess CVD risk normally observed among people with FHD. Indeed, it has been shown that people with FHD exercised and consumes healthy diet more than those without FHD [23]. Additionally, there may be some yet to be identified environmental factors that suppress the expression of inherited genes among patient with FHD. The lack of differences between the two groups may also be due to negative effect of work place environment. Workplace environment is obesogenic through promotion of unhealthy eating habits, stress and sedentary lifestyle [24,25]. Similarly, university environment encourages unhealthy behaviors among students [26]. By using cohorts who shared similar workplace and study environment, we were able to eliminate these potential confounders.
This study compared the lifestyle of the two groups, and no difference was observed in the physical activity level or intake of fruits and vegetables. However, while people with FHD consumed more poultry products, those without FHD consumed more red meat. It is possible that more red meat consumption by people in the latter group resulted in a more adverse metabolic profile. Red meat consumption has been linked to raised plasma gut-derived Trimethylamine-N-Oxide (TMAO) [27], which in turn has been found to be associated with CVD risk factors such as diabetes [28,29], obesity [30], and hypertension [31], and undesirable or unfavorable alteration in cholesterol metabolism [32]. It is also associated with other CVD disease such as stroke and mortality [33,34]. Furthermore, it predicts metabolic syndrome [30]. Additionally, altered gut microbe resulting from unhealthy diet changes has been associated with obesity [35].
Diet rich in vegetables and fruits, as seen in vegetarians, is associated with low TMAO level [32], as well its variability [36]. This type of diet is expected to reduce the risk of diabetes and other CVD risk factors, even in susceptible individuals and vice versa. In a study that examined the interaction between lifestyle and FHD on the incidence of T2DM among the Chinese, Zhao and colleagues [3], found that lower intake of fruits (<85 g/day), and lack of intake of freshly squeezed fruit juice were associated with higher incidence of diabetes. On the other hand, the authors [3] found that consumption of more than 4 grams of beef/mutton per day was associated with increased incidence of diabetes. The study further revealed that those who did not have diabetes were more physically active and consumed more poultry, potatoes and pork than participants with T2DM [3].
It has been demonstrated that lifestyle measures such as increased physical activity and fibre intake, coupled with reduction in fat intake resulted in 58% reduction in T2DM incidence in high risk individuals [5]. A similar study by Knowler WC et al., confirmed the above finding, but importantly also showed that lifestyle modification was superior to metformin for diabetes prevention [6]. And this benefit persists after many years of follow-up [37]. Recent reviews also confirmed the beneficial effects of lifestyle measures in delaying or preventing T2DM [38,39].
Through the process of epigenetics, diet, nutrition and lifestyle modify gene expression through methylation, acetylation of histones and microRNAs [40]. Thus, an individual who inherited genes associated with CVD risk factors such as diabetes, hypertension, and obesity may or may not have these phenotypes depending on dietary and lifestyle exposures. Chemicals present in meat, poultry, fruits and vegetables have the potential to induce epigenetic changes [40]. Additionally, both acute and long-term physical activity affects DNA methylation in adipose tissue, and skeletal muscle, resulting in beneficial glucose homeostasis [41-43].
This study demonstrated similar CVD risk profile among people with and without FHD. The role of workplace obesogenic environment in raising the CVD risk of people without FHD needs to be investigated.
Limitation(s)
Firstly, there may be errors in dietary recall by participants. Bias in reporting FHD may occur, especially in a culture where people tend to keep personal and family health conditions secret. Participants were not asked to specify whether only one, or more than one family members (e.g. one, both parents, or parents and siblings) had diabetes. The risk conferred is greater if more than one FHDs had diabetes, and this may have impact on our outcome measure.
Conclusion(s)
The prevalence of metabolic syndrome among people with FHD was 19.8%, similar to those without FHD. Participants with FHD consume more poultry and less red meat than those without FHD.
The student’s t-test revealed no difference in the clinical and laboratory parameters between people with and without FHDs; BMI: Body mass index; WC: Waist circumference; WHR: Waist to hip ratio; WHtr: Waist to height ratio; SBP: Systolic blood pressure; DBP: Diastolic blood pressure; FPG: Fasting plasma glucose; TC: Total cholesterol; LDL: Low density cholesterol; HDL: High density cholesterol; TG: Triglyceride. Values are means (sd)
*One participant among those with FHDs did not indicate the type of meat normally consumed, making the total to be 85 instead of 86; Pearson’s Chi-square
The students t-test revealed no difference in the means of clinical and laboratory parameters between the two groups.
BMI: Body mass index; WC: Waist circumference; WHR: Waist to hip ratio; WHtR: Waist to height ratio; SBP: Systolic blood pressure; DBP: Diastolic blood pressure; FPG: Fasting plasma glucose; TC: Total cholesterol; LDL: Low density cholesterol; HDL: High density cholesterol; TG: Triglyceride Values are means (sd)