Chronic Kidney Disease (CKD) escalates the chance of fatality, the occurrence of cardiovascular disease, and the progression of the disease to end-stage renal disease, notwithstanding traditional Cardiovascular Risk Factors (CVRFs) [1]. The high blood sugar levels in DM sufferers is among the major cause of CKD as it is responsible for 33% of the adult incidences of CKD [2]. As well, nearly 40% of DM patients are likely to develop end-stage DN [3]. DN significantly augments the health costs to treat this disease [4]. As well with more and more diabetic patients the incidence of CKD will likely increase. The pre-diabetes stage is the point at which CKD usually starts because of its occurrence with other CVRFs [5].
A moderate uptick in the level of urine albumin, or microalbuminuria, happens first for DN patients then an increased severity of proteinuria ensues due to the fact that the glomerular filtration membrane of the kidney is damaged. The recommended approach for CKD screening in patients with type 2 diabetes was to estimate both the Glomerular Filtration Rate (eGFR) and the Urinary Albumin/Creatinine Ratio (UACR) [5]. Normally, CKD comprises reduced eGFR and/or increased UACR; however, a significant number of type 2 DM patients in this study showed reduced eGFR and no increase of UACR [6]. The CKD diagnostic standards for evaluation, categorisation, and levelling of CKD in the Kidney Disease Outcomes Quality Initiative (KDOQI) prescribe an eGFR level of below 60 mL/min/1.73 m2 for three or more months or the occurrence of renal lesions with or without lessened eGFR for three or more months according to the National Kidney Foundation (NKF) guidelines [2].
Several previous studies have discovered that age, gender (female), Systolic Arterial Blood Pressure (SABP) of over 150 mmHg, and a previous occurrence of cardiovascular disease [1,6-8] as well as having had diabetes for more than 5 years were all significantly related to DN. On the other hand, statistics for survival time and factors related to DN development are needed for Thai clinicians to help them target high-risk cases, which require early identification in order to prevent DN development in Thai patients with type 2 DM. Most of the previous research did not study Thai patients for indications or identify factors associated with the temporal progression of Diabetic Nephropathy (DN) for DM patients in Thailand [6-11]. This study was conducted for that reason and included an assessment of survival time and multivariate analysis based on clinical parameters and laboratory results from medical records to determine the risk factors of DN development in Thai patients with type 2 DM.
Materials and Methods
A cross-sectional retrospective study was performed to explore the survival time of patients with DN and to determine the factors associated with the development of DN in patients with type 2 diabetes during treatment for DM at Mahachanachai Hospital, Yasothon Province, in the North-East region of Thailand between 1st January, 2002 to 3rd December, 2017. There were 1,540 patients with type 2 diabetes that were identified by a physician, and the diagnosis of DN in type 2 diabetes patients was based on the Thai NKF 2002 criteria for diagnosis, which used an eGFR of less than 60 mL/min/1.73 m2, a UACR of 30-300 mg/g, or positive Microalbuminuria Dipstick test ≥1+ [2]. Finally, there were 306 patients with type 2 DM who were newly registered for a glycaemic status examination and who were free from DN before the start of DM treatment selected for this study. All of them received routine follow-up for DN symptoms evaluation by the DM clinic team every month during on the course of DM treatment.
Definition of Stage of eGFR
DN stages by eGFR: The five stages of eGFR according to the level of eGFR [12-14]:
Stage 1 of eGFR (eGFR≥90 mL/min/1.73 m2): Normal kidney function but urine findings or structural abnormalities or genetic trait pointing to kidney disease
Stage 2 of eGFR (eGFR 60-89 mL/min/1.73 m2): Mildly reduced kidney function, and other findings (as for stage 1) pointing to kidney disease
Stage 3 of eGFR (eGFR 30-59 mL/min/1.73 m2): Moderately reduced kidney function
Stage 4 of eGFR (eGFR 15-29 mL/min/1.73 m2): Severely reduced kidney function
Stage 5 of eGFR (eGFR<15 mL/min/1.73 m2): Very severely reduced kidney function or end-stage kidney failure
eGFR calculation: The eGFR (mL/min/1.73 m2) value was calculated by a laboratory records of Mahachanachai Hospital, such as the creatinine measurements. The value of eGFR was calculated using the CKD-EPI creatinine equations as follows [13]:
The CKD-EPI creatinine equation: estimated GFR=141 x min (Serum creatinine (Scr)/k,1) α × max (Scr/k,1) -1.209 × 0.993 age × 1.081 (if female) × 1.159 (if black), where GFR is expressed as mL/min/1.73 m2 of body surface area and Scr is expressed in mg/dL: k is 0.9 for males and 0.7 for females, α is -0.411 for males and -0.329 for females, min is the minimum Scr/k or 1, and max is the maximum Scr/k or 1 [13].
Definitions: DN is when the patients with type 2 diabetes have an eGFR of less than 60 mL/min/1.73 m2, UACR of 30-300 mg/g, or positive Microalbuminuria Dipstick test ≥1+ [2,13].
Type 2 diabetes, a type of adult-onset diabetes is accompanied by high blood sugar, insulin resistance, and insufficient insulin levels. The symptoms that often occur comprise an increase of thirst, repeated urination, and weight loss that cannot be explained. Other symptoms sometimes include unexplained hunger, tiredness and unhealable sores.
Recruitment Procedures
This study included all patients with type 2 diabetes (aged ≥18 years) who attended the Diabetes Care Centre at Mahachanachai Hospital, Yasothon Province, Thailand from 2002-2017.
Inclusion criteria: Patients with type 2 diabetes who were free of DN and free from diabetic complications like retinopathy, neuropathy, peripheral vascular disease, or coronary artery disease at baseline.
Exclusion criteria: Patients who had other diabetic complications like retinopathy, neuropathy, peripheral vascular disease, or coronary artery disease during the follow up period and who did not have complete data for renal function assessment and patients who did not have complete data regarding the potential risk factors of DN.
Finally, 306 type 2 DM patients who were newly registered for a glycaemic status examination met the study criteria during 2002 to 2017 were included.
Data Collection
The demographic, anthropometric, and haemodynamic data were collected at baseline in 2002 and until 2017 using the HOSxP program and medical records. The eGFR was calculated using the Nephrology Society of Thailand guidelines [13]. Subsequent measurements spanning 15 years were recorded.
Study variables: The independent variables (n=12) were based on previous studies [2-5]. They were as follows:
- Age (year)
- Age group (<65 years, ≥65 years)
- Gender (male vs. female)
- BMI (kg/m2)
- Duration of DM (year)
- Duration of DM group (<10 years, ≥10 years)
- Blood pressure (mmHg)
- Systolic (mmHg)
- Diastolic (mmHg)
- Plasma glucose (mg/dL)
- Fasting blood sugar (mg/dL)
- HbA1c (%)
- Total Cholesterol (mg/dL)
- Triglycerides (mg/dL)
- Urea (mg/dL)
- Creatinine (mg/dL)
- Medicine (n,%)
- Glipizide (yes/no)
- Metformin (yes/no)
- Glipizide + Metformin (yes/no)
Outcome measures: The patients were divided into two groups using eGFR for classification. (NKF, 2002) [2,13].
Nonsurvivors or events of this study were patients who had DN, classified by using an eGFR of less than 60 mL/min/1.73 m2, a UACR of 30-300 mg/g, or positive Microalbuminuria Dipstick test ≥1+.
Survivors or censored cases of this study were patients who did not have DN or normal DN or an eGFR of more than 60 mL/min/1.73 m2 and patients who died from other causes who did not follow-up and/or developed other diabetic complications like retinopathy, neuropathy, peripheral vascular disease, or coronary artery disease.
Ethical statement: Approval from the Ethics Committee for Research Involving Human Subjects of Mahasarakham University, Thailand was obtained before the research was carried out (PH057/2561). The information of respondents that was obtained through medical records and medical electronic data were kept confidential and anonymous.
Statistical Analysis
Descriptive statistics were used to describe the characteristics of the subjects. Continuous data were presented as mean and ±SD. The independent sample t-test was used to examine the difference of means between the survivors group and nonsurvivors group. Categorical data were presented as proportions. Fisher’s-exact test was used to test the difference of the proportion between both independent groups.
Univariate analysis was performed considering risk factors as dependent variables such as age, gender, height, weight, systolic and diastolic blood pressure, family history of diabetes, duration of diabetes, BMI, baseline fasting plasma glucose, HbA1c, and total cholesterol and triglycerides. The averages for risk factors in a time period equal or superior to three months were explored by Univariate Cox regression analysis.
Multivariable Cox regression analysis was performed to determine the factors affecting the survival of the patient, taking into account the effects of several potential factors simultaneously. Potential variables for multiple variable analysis were selected from significant variables obtained from the univariate analysis. The linearity of continuous variables was explored and dichotomised, using mean or median for the cut-off point, before the model fitting. Medicine was the only variable categorised into three groups, and the U-shaped curve was used to determine the relationship between medicine and log hazard. The model was fitted using the backward elimination method. The significance of each variable in the model was determined using a partial likelihood ratio test. Model assumption and adequacy were assessed for the final model.
The median survival probability of DN separated by the medicine regimens was estimated by the Kaplan-Meier survival method. Onset was the date when the first symptom of DM presented, and the end of the study was the date when the patient got DN or had normal kidney function at the 15-year follow-up session.
Results
From a total of 1,540 patients with type 2 diabetes who were newly registered in 2002 and had subsequent follow-up visits until 2017, only 306 patients met the study criteria. There were 170 patients who had other diabetic complications, 220 patients had DN at baseline, and 465 patients with incomplete data were excluded [Table/Fig-1].
Flow chart showing recruitment of patients with type 2 diabetes.
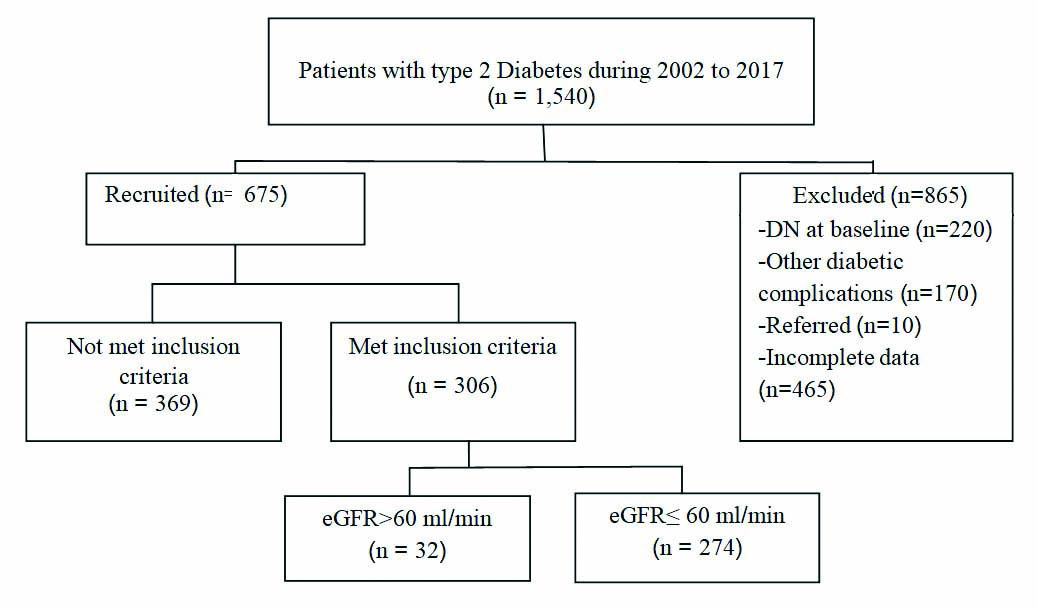
Baseline characteristics: The final analysis was done with the data of 306 (19.87%) type 2 diabetes patients having normal renal function, an absence of any diabetic complications at baseline, and who had complete data during the 15 years of the follow-up period. During the follow-up, of the 306 type 2 diabetes patients with complete data, 274 (89.54%) females and 32 (10.46%) males aged 70.64±9.45 years, 274 (89.54%) patients developed DN, and 32 (10.46%) patients were normal. The mean of BMI was 23.12±4.03 km/m2, and the mean of duration of DM was 11.46±2.34 years. The results of blood pressure assessment showed that the mean of systolic blood pressure was 131.46±11.62 mmHg, and the mean of diastolic blood pressure was 71.24±6.94 mmHg.
The plasma glucose data showed the mean of fasting blood sugar was 161.58±68.49 mg/dL, the mean of HbA1c was 8.32±2.28%, the mean of total cholesterol was 201.06±51.87 mg/dL, the mean of triglycerides was 199.17±127.04 mg/dL, the mean of urea was 25.45±8.73 mg/dL, and the mean of creatinine was 1.83±1.25 mg/dL.
The medical regimen records showed 145 patients (47.40%) received Glipizide, 100 patients (32.70%) received Metformin, and 61 patients (19.90%) received both Glipizide and Metformin [Table/Fig-2].
Demographic data and means of haemodynamic and biochemical details of DN and Non-DN.
| Variables | Total(n=306) | Non-DN(n=32) | DN(n=274) | p-value* |
|---|
| Mean | SD | mean | SD | mean | SD |
|---|
| Age(yr) | 70.64 | 9.45 | 69.59 | 9.54 | 70.76 | 9.45 | 0.051 |
| Gender | n | % | n | % | n | % | |
| Male | 32 | 10.46 | 8 | 25.00 | 24 | 75.00 | 0.022 |
| Female | 274 | 89.54 | 24 | 8.76 | 250 | 91.24 |
| BMI**(kg/m2) | 23.12 | 4.03 | 23.90 | 4.73 | 23.13 | 3.94 | 0.159 |
| Duration of DM(yr) | 11.46 | 2.34 | 8.50 | 2.84 | 11.81 | 2.01 | 0.034 |
| Blood pressure (mmHg) |
| Systolic | 131.46 | 11.62 | 124.06 | 9.26 | 138.87 | 11.87 | 0.041 |
| Diastolic | 71.24 | 6.94 | 71.00 | 6.82 | 71.26 | 6.27 | 0.582 |
| Plasma glucose (mg/dL) |
| Fasting blood sugar(mg/dL) | 161.58 | 68.49 | 164.31 | 58.73 | 161.26 | 69.63 | 0.027 |
| HbA1c (%) | 8.32 | 2.28 | 7.54 | 1.89 | 8.46 | 2.26 | 0.031 |
| Total Cholesterol (mg/dL) | 201.06 | 51.87 | 188.52 | 38.84 | 202.48 | 53.02 | 0.022 |
| Triglycerides (mg/dL) | 199.17 | 127.04 | 175.61 | 78.17 | 201.85 | 31.28 | 0.043 |
| Urea (mg/dL) | 25.45 | 8.73 | 23.30 | 4.10 | 28.32 | 9.18 | 0.036 |
| Creatinine (mg/dL) | 1.83 | 1.25 | 2.05 | 1.56 | 1.80 | 1.21 | 0.041 |
| eGFR(mL/min/1.73 m2) | 99.12 | 21.06 | 106.02 | 27.91 | 83.00 | 23.56 | 0.002 |
| Medicine (n, %) | n | % | n | % | n | % | |
| Glipizide | 145 | 47.40 | 14 | 43.80 | 131 | 47.80 | 0.014 |
| Metformin | 100 | 32.70 | 11 | 34.40 | 89 | 32.50 |
| Glipizide + Metformin | 61 | 19.90 | 7 | 21.90 | 54 | 19.70 |
*Independent t-test for continues variables, Chi-square test for categorical variables; **BMI: Body mass index (kg/m2); eGFR: Glomerular filtration rate (mL/min/1.73 m2)
[Table/Fig-2] shows the demographic comparison and biochemical and haemodynamic data between nonsurvivor and survivor groups. The mean age in the nonsurvivor group was 70.76±9.45 years and 69.59±9.54 years in the survivor group. There were 24 (75.00%) male patients in the nonsurvivor group and 8 (25.00%) male patients in the survivor group. There were 250 (91.24%) females in the nonsurvivor group and 24 (8.76%) females in the survivor group. The mean of BMI in the nonsurvivor group was 23.13±3.94 km/m2 and 23.90±4.73 km/m2 in the survivor group. The mean of duration of DM was 11.81±2.01 years in the nonsurvivor group and 8.50±2.84 years in the survivor group.
The results of blood pressure assessment showed that the mean of systolic blood pressure in the nonsurvivor group was 138.87±11.87 mmHg and 124.06±9.26 mmHg in the survivor group. The mean of diastolic blood pressure in the nonsurvivor group was 71.26±6.27 mmHg and 71.00±6.82 mmHg in the survivor group.
The plasma glucose examination reports, including the mean of fasting blood sugar was 161.26±69.63 mg/dL in the nonsurvivor group and 164.31±58.73 in the survivor group. The mean of HbA1c was 8.46±2.26% in the nonsurvivor group and 7.54±1.89 in the survivor group. The mean of total cholesterol was 202.48±53.02 mg/dL in the nonsurvivor group and 188.52±38.84 mg/dL in the survivor group. The mean of triglycerides was 201.85±131.28 mg/dL in the nonsurvivor group and 175.61±78.17 mg/dL in the survivor group. The mean of urea was 28.32±9.18 mg/dL in the nonsurvivor group and 23.30±4.10mg/dL in the survivor group. The mean of creatinine was 1.80±1.21 in the nonsurvivor group and 2.05±1.56mg/dL in the survivor group.
The medical information for GFR showed that the mean of eGFR in the nonsurvivor group was 83.00±23.56 mL/min and 106.02±27.91 mL/min in the survivor group.
The medical regimen records showed that 131 (47.80%) patients in the nonsurvivor group and 14 (43.80%) patients in the survivor group received Glipizide. There were 89 (32.50%) patients in the nonsurvivor group and 11 (34.40%) patients in the survivor group who received Metformin. In addition, there were 54 (19.70%) patients in the nonsurvivor group and 7 (21.90%) patients in the survivor group who received both Glipizide and Metformin.
These results showed that patients with DN had a longer duration of DM and higher age, systolic blood pressure, HbA1c, total cholesterol, triglycerides, and albuminuria as compared to those who did not develop DN. However, eGFR fasting blood sugar and creatinine levels in patients with DN were less than those who did not develop DN. The data showed similar results regarding BMI and diastolic blood pressure.
Factors associated with Diabetic Nephropathy (DN): The univariate analysis confirmed that BMI, diastolic BP, plasma glucose, total cholesterol, triglycerides, urea, creatinine, and medicine regimen for DM were not statistically significantly associated with the reduction of eGFR for DN development at a p-value of less than 0.05 [Table/Fig-3].
Univariate analysis of factors associated with the development of Diabetic Nephropathy (DN).
| Variables | B* | SE** | Wald | df | p- value | HR*** | 95 % CI for HR |
|---|
| Lower | Upper |
|---|
| Gender | -0.093 | 0.133 | 0.491 | 1 | 0.483 | 0.911 | 0.703 | 1.182 |
| Age (Year) | -0.261 | 0.145 | 2.856 | 1 | 0.090 | 0.789 | 0.595 | 1.041 |
| BMI | -0.123 | 0.132 | 3.877 | 2 | 0.382 | 0.541 | 0.387 | 1.679 |
| HbA1c | -0.032 | 0.132 | 0.059 | 1 | 0.808 | 0.968 | 0.748 | 1.254 |
| DM duration | 1.380 | 0.186 | 56.709 | 1 | 0.001 | 4.009 | 2.981 | 5.810 |
| Systolic BP | 0.023 | 0.015 | 6.266 | 1 | 0.0156 | 1.023 | 1.045 | 1.067 |
| Diastolic BP | -0.233 | 0.122 | 1.320 | 1 | 0.222 | 0.824 | 0.602 | 1.057 |
| Glycaemic | -0.171 | 0.181 | 2.001 | 1 | 0.147 | 0.870 | 0.611 | 1.094 |
| Cholesterol | 0.224 | 0.193 | 3.236 | 1 | 0.105 | 0.798 | 0.601 | 1.103 |
| Triglycerides | -0.256 | 0.154 | 2.777 | 1 | 0.121 | 0.823 | 0.702 | 1.301 |
| Urea | -0.196 | 0.189 | 2.112 | 1 | 0.345 | 0.566 | 0.403 | 1.741 |
| Regimen | 0.268 | 0.181 | 1.989 | 2 | 0.192 | 0.196 | 0.782 | 1.994 |
*Omnibus Tests of model coefficients: -2 Log likelihood=2894.540; Chi-square: 82.501 (p-value: 0.001); B*: Correla-tion coefficients; SE**: Standard errors; HR***: Hazard ratio
Multivariate analysis, gender, age group, HbA1c group, duration of DM, and systolic blood pressure were included in the multivariate Cox regression model. The results confirmed that the duration of DM with a Hazard Ratio (HR) of 3.856 (95% CI: 2.697-5.512; p=0.001) and the mean of systolic blood pressure with a HR of 1.013 (95% CI: 1.003-1.023; p=0.013) were statistically significantly associated with the reduction of eGFR for DN development. However, gender, age group, and HbA1c were not statistically significantly associated with the reduction of eGFR for DN development [Table/Fig-4].
Multivariate analysis of factors associated with the development of Diabetic Nephropathy (DN).
| B* | SE** | Wald | df | p-value | Adjusted HR*** | 95% CI for HR |
|---|
| Lower | Upper |
|---|
| Gender(Female) | -0.093 | 0.133 | 0.491 | 1 | 0.483 | 0.911 | 0.703 | 1.182 |
| Age group(>60 years) | -0.243 | 0.143 | 2.882 | 1 | 0.090 | 0.784 | 0.592 | 1.038 |
| HbA1c(=6%) | -0.032 | 0.132 | 0.059 | 1 | 0.808 | 0.968 | 0.748 | 1.254 |
| DM duration (=10 years) | 1.350 | 0.182 | 54.782 | 1 | 0.001 | 3.856 | 2.697 | 5.512 |
| Systolic(mmHg.) | 0.013 | 0.005 | 6.204 | 1 | 0.013 | 1.013 | 1.003 | 1.023 |
*Omnibus tests of model coefficients: -2 Log likelihood: 2647.620; Chi-square: 71.504 (p-value=0.000); B*: Correla-tion coefficients; SE**: Standard errors, HR***: Hazard ratio
Patients in the duration of illness with diabetes ≥10 years group at any time point during the study were more likely to develop DN than patients with a duration of illness with diabetes of ≤10 years by 3.86 times, with 95% confidence that the true value lies between 2.70 to 5.51 times. These results confirmed that patients with a duration of illness with diabetes of more than 10 years were between 2.70 times to 5.51 time more likely to develop DN than patients with a duration of illness with diabetes of ≤10 years.
In addition, the HR for the mean of systolic blood pressure was 1.013, with a 95% confidence interval: 1.003 to 1.023; p=0.013. Systolic blood pressure was more likely to increase the risk of DN development: 1% for each 1 mmHg increase of systolic blood pressure.
Survival Function and Hazard Function
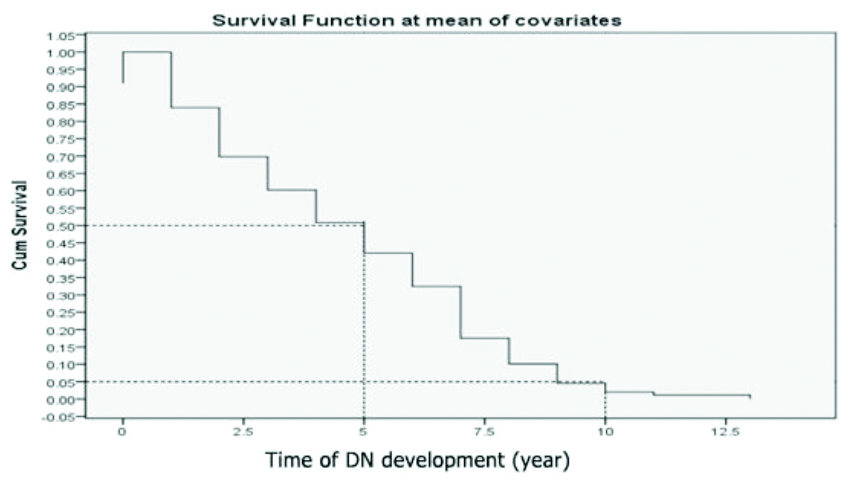
Survival time: These findings show that the median survival time of patients with DN among type 2 diabetic patients is 5 years, the minimum survival period is 1.5 years, ranging from 1.5-13.0 years, including a decline in renal function occurring after 1.5 years, and the majority of the subjects ended up with DN (eGFR <60 mL/min) by the end of two years.
Median survival: The median survival time was five years, which means half of the DM patients survived for 5 years.
Proportion surviving at a specific time point: About 5% of the DM patients survived for 10 years. Another way of interpreting this is that about 5% of the DM patients had not experienced DN development after 10 years of follow-up [Table/Fig-5].
Survival time of DN development at mean of covariates.
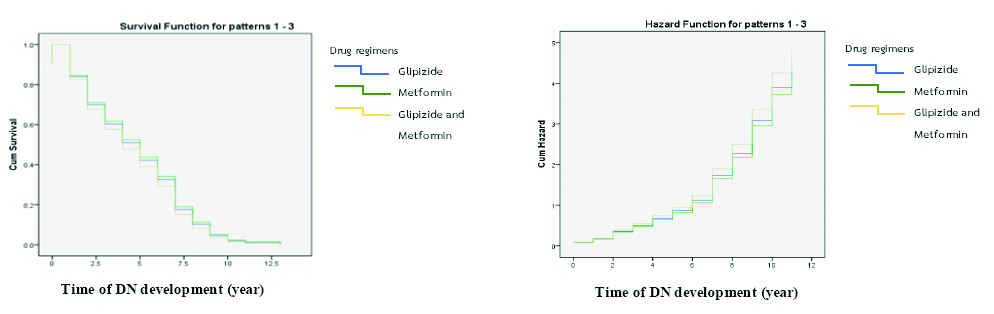
The median survival probability of DN patients separated by the three drug regimens not associated with DN development, at a p-value of <0.05, was estimated by the Kaplan-Meier survival method. The results from the Kaplan-Meier survival function at the mean of covariates showed a median survival time of five years. There was a minimum survival period of one year, with a range between 1-13 years and a decline in renal function occurring after one year in all drug regimen groups. The survival curve showed that drug regimen 2 (Metformin) was associated with more survival time for patients with DN than for those using other drug regimens.
In addition, the hazard function showed that, with Metformin, there was a lower survival time with DN than that for other drug regimens, and drug regimen with Glipizide and Metformin was more hazardous than other drug regimens but this was not statistically significant [Table/Fig-6].
Survival and hazard function analyses of DN at mean of covariates.
Discussion
Risk Factors
Duration of illness with diabetes: The results confirmed that the duration of DM with an HR of 3.856 (95% CI: 2.697-5.512; p<0.001) was statistically significantly associated with the reduction of eGFR for DN development. It can be inferred that patients with a duration of illness with diabetes of ≥10 years were more likely to develop DN than patients with a duration of illness with diabetes of <10 years by 3.86 times, or a true value between 2.70 to 5.51 times. It seems that the duration of illness with diabetes is an independent risk factor for DN, and this result is consistent with previous studies which reported that longer diabetes duration was independently associated with DN [9,15].
Systolic blood pressure: The results of multivariate by Cox regression confirmed that the mean of systolic blood pressure with a HR of 1.013 (95% CI: 1.003-1.023; p=0.013) was statistically significantly associated with the reduction of eGFR for DN development. It can be inferred that systolic blood pressure was more likely to increase the risk of DN development by 1% for each 1 mmHg increase of systolic blood pressure. In addition, the association between high blood pressure and DN has already been established by most of the related studies [8,9,16-18]. Therefore, systolic blood pressure is an important factor for the development of DN among type 2 diabetic patients, which was similar to the results of a previous study which found that SABP ≥150 mmHg was associated with higher CKD prevalence [8]. High blood glucose levels can damage the blood vessels in the kidneys. In addition, several patients with diabetes also have high blood pressure, which can cause damage to blood vessels in the kidneys [11]. Blood pressure is the force of blood pushing against blood vessels, including in the kidneys. When the blood pressure is high, blood vessels stretch, so blood flows more easily. Eventually, this stretching weakens blood vessels in the kidneys. When the blood vessels in the kidneys are damaged, they cannot remove wastes and extra fluid from the body. The National Institute of Diabetes and Digestive and Kidney Diseases confirmed that high blood pressure is the second leading cause of kidney failure after diabetes, and the rate of kidney failure due to high blood pressure was 26 percent in the United States [12].
The present study found that age, sex and BMI were not significantly associated with DN development. These results are unlike previous studies [8,15-18], which found that age, sex [15,16-18] and BMI [16] were significantly associated with DN but were not associated with the survival time of DN or DN development. It seems that age, sex, and BMI are not more important risk factors than the duration of illness with diabetes and systolic blood pressure for DN development considering the various results of previous studies. Regarding gender, one study reported that females had a higher risk of developing DN than males [8]. However, other studies reported that males were more likely to develop DN than females [15-17]. The present study confirmed that age, sex and BMI are not important risk factors among Thai patients with type 2 diabetes. However, most of the previous studies confirmed that HbA1c or high glycaemic levels were the leading cause of DN [6,15-18]; therefore, investigation into HbA1c or high glycaemic levels should be repeated in future studies. These dissimilar results could be due to disparities in several factors including study design, source of population, sample selection, health care systems, race/ethnicity, definition, proper information, and especially, the measurement approaches.
Survival function and hazard function
Survival time: The findings that form the Kaplan-Meier survival function at the mean of covariates showed that the median survival time of DN among type 2 diabetic patients is 5 years, the minimum survival period is 1.5 years, ranging from 1-13 years, including a decline in renal function occurring after 1.5 years, and the majority of the subjects ended up with DN (eGFR <60 mL/min) by the end of 2 years. This is different from a previous study [9], which found that patients with DN had a median survival time of 12 years, ranging from 11.6-12.4 years. There was a decline in renal function occurring after 4 years. These contrasting results could be due to dissimilar health care systems, race/ethnicity, and/or outcome measures [10].
The survival and hazard function were separated into three groups by medical regimen that were not associated with DN. However, the survival curve showed that patients using drug regimen 2 (Metformin) had a higher survival time with DN than those in other drug regimens. As well, the hazard function showed that drug regimen 2 resulted in lower survival time for patients than those in other drug regimens. Drug regimen 3 was more hazardous than other drug regimens. These results could be due to the fact that a combination of drugs might affect kidney function and survival time of patients with DN more than a single drug. Accordingly, further study can be done to examine the effects of drugs used for DM treatment to DN development with a proper sample in each drug regimen. In addition, further study should examine the effect of drugs used for DM treatment with regard to DN development, with an appropriate sample size for each drug regimen.
Limitation(s)
This study used secondary data of 1,540 type 2 diabetes patients who were newly registered for glycaemic status examination in 2002 at Mahachanachai Hospital and who had follow-up data for 15 years (2002-2017). Most of them had not supplied complete or important data. Only 306 patients had complete data for the final analysis. Moreover, this study could not use albuminuria data, such as macro and micro albuminuria, to classify DN stage due to the fact that Mahachanachai Hospital used an albuminuria stick test for albuminuria examination, which makes it difficult to accurately identify and classify DN stage.
Conclusion(s)
The median survival time of DN patients at a mean of covariates among type 2 diabetic patients is five years. The duration illness with diabetes and systolic blood pressure were associated with the development of DN. Awareness programs should be implemented to control systolic blood pressure before five years after registration to receive treatment and a proper surveillance approach for DN patients who have had duration of illness with diabetes for more than 10 years.
*Independent t-test for continues variables, Chi-square test for categorical variables; **BMI: Body mass index (kg/m2); eGFR: Glomerular filtration rate (mL/min/1.73 m2)
*Omnibus Tests of model coefficients: -2 Log likelihood=2894.540; Chi-square: 82.501 (p-value: 0.001); B*: Correla-tion coefficients; SE**: Standard errors; HR***: Hazard ratio
*Omnibus tests of model coefficients: -2 Log likelihood: 2647.620; Chi-square: 71.504 (p-value=0.000); B*: Correla-tion coefficients; SE**: Standard errors, HR***: Hazard ratio