Adverse Drug Reactions (ADRs) are undesired drug effects that have substantial clinical and economic burden in terms of hospital visits, admission, prolongation of hospital stay and health expenditure [1]. Current drug development modules and post marketing surveillance aim to establish most efficient and safe drugs in the market. But it seems to have an utmost need to add up ADR profile studies and proper causality assessment to combat growing complexity of medical management therapies and to strengthen drug safety global efforts. Annual ADR related deaths rates (ADRs reported per million population) has been proposed with 0.08- 0.12 per 100,000 population which has significantly increasing trend over time at a rate of 0.0058 per year [2]. Fatal ADR rate as high as of 6.4% and less severe ADR rate as 1.66% has been notified by other studies [3,4]. In year 2013, India’s contribution to World Health Organisation-Uppsala Monitoring Cente (WHO-UMC) global drug safety database (Vigibase) was 2% [5]. Several studies have suggested that CADRs are major contributory reactions among all observed ADRs pertaining to extra burden on healthcare ecosystem. Incidence of CADRs was estimated to be 1-3% among indoor patients in developed countries which was almost double ~2-5% in developing countries such as India with 2.6% incidences among outdoor patients [6,7].
Despite WHO declaring India free of Leprosy in 2005, India contributes ~60% of global leprosy burden [9]. In 2015, a total of 1,27,326 new cases were detected compared with 1,25,785 new cases in 2014 [9]. Bihar went up top in India with increasing trends of leprosy cases with highest numbers of 4400 cases detected during a campaign conducted in 2016 covering 149 districts in 19 states [9]. In this context, special leprosy clinics established at tertiary centre in Bihar (like that in AIIMS) are serving to curb the morbidity and mortality due to leprosy. Antimicrobials, multidrug therapy for leprosy, anticancer regimen, Non-Steroidal Anti-Inflammatory Drugs (NSAIDs), steroids etc., play crucial role in prevention and cure of wide range of diseases but their accountability of causing more CADRs cases is still a matter of concern to the physicians. The present study was planned to analyse the profile of CADRs in the hospital during the study period and to compare the inter-rater agreement of assessment scales for severity, causality and preventability of CADRs done by both manual and Pharmvigill ADR mobile app analyser. Additionally, this study aimed to show the impact on CADRs profile due to multidrug therapy for leprosy.
Materials and Methods
This study was done on a total of 245 CADRs collected in ADR Monitoring Centre (AMC), AIIMS, Patna, Bihar from March 2018 to March 2020. Ethical approval (Vide IEC No. AIIMS/Pat/IEC/2020/486) was obtained from Institute Ethics Committee (IEC) to conduct a retrospective analysis of the collected CADRs. The data processing and analysis were done over a period of one month in April 2020.
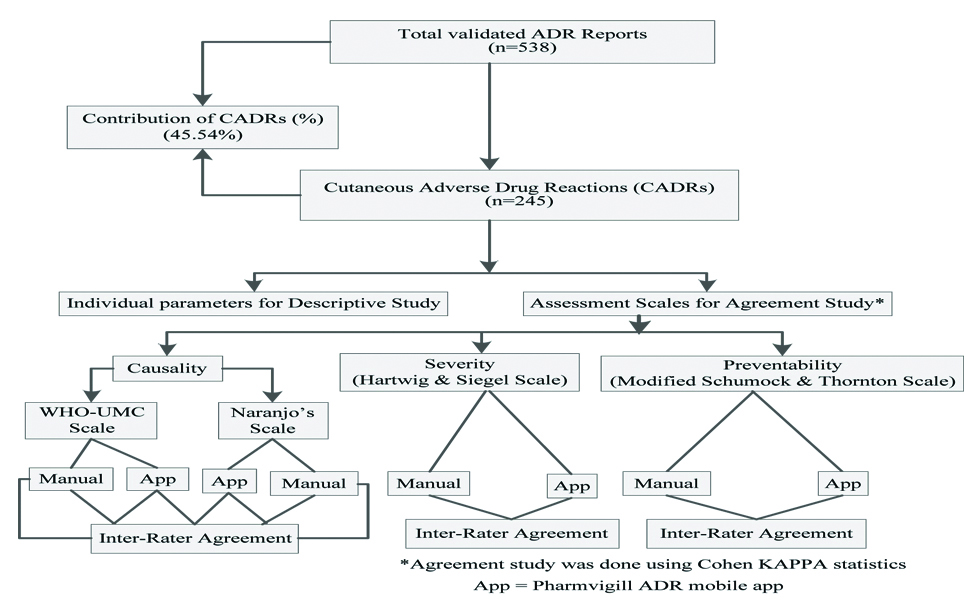
Information regarding causality, severity and preventability assessment were utilised from reported forms, which were done by manually at the time of reporting. Causality of CADRs was assessed by the World Health Organisation-Uppsala Monitoring Centre (WHO-UMC) scale [10] and Naranjo’s algorithm [11]. Preventability and degree of severity CADRs were determined using Hartwig and Siegel scale [12] and Modified Schumock and Thorton scale [13]. Later on, assessments were re-performed using Pharmvigill ADR mobile app before data interpretation. Assessment done by both raters was compared for various scales used in the study. Inter-rater agreement studies for assessment scales were evaluated by Cohen Kappa statistics [14-18]. The whole study plan was depicted through a flow chart [Table/Fig-1].
Validation of ADRs was achieved by sending suspected ADRs with AMC number through a software generated form designed as Vigiflow (adr.who-umc.org/login.asp) by Uppsala Monitoring Centre for central assessment (Indian Pharmacopoeia Commission, IPC, Ghaziabad) after allotting worldwide unique number to each and every report. Unaccepted or returned ADRs were corrected and sent for central reassessment. Final accepted reports were considered ‘validated’ which were stored in the form of hard and soft copy in the data record section of the AMC.
Inclusion criteria: Only validated CADR reports with AMC report number and unique worldwide identification number that were approved after central assessment were included in the study.
Exclusion criteria: Though validated, but those ADR reporting forms which lacked essential data and failed to provide necessary parameters were excluded from study.
Statistical Analysis
Descriptive analysis and agreement study were done using Microsoft office Excel 2007 and Graphpad quickcalcs software based programmes, respectively [17].
Results
A total of 538, ADRs were reported to the AMC centre during the study period and 245 reports were found as cases of CADRs. Here, the contribution of CADRs was 45.54% of total ADRs reported. Demographic profile of the study population is presented in the [Table/Fig-2].
Demographic distribution of CADRs (n=245).
| Demographic data | Male n (%) | Female n (%) |
|---|
| Sex distribution among total CADRs (n=245) | 148 (60.41) | 97 (38.59) |
| Sex distribution among CADRs due to MDT-LΨ (n=127) | 90 (36.73) | 37 (15.1) |
| Age (Year) distribution among total CADRs (n=245) |
| 0-10 | 14 (5.71) | 3 (1.22) |
| 11-20 | 18 (7.35) | 19 (7.76) |
| 21-40 | 63 (25.72) | 55 (22.45) |
| 40-60 | 39 (15.92) | 17 (6.94) |
| >60 | 14 (5.71) | 3 (1.22) |
| Age (Year) distribution among CADRs due to MDT-L (n=127, 51.83%) |
| 0-10 | 4 (1.63) | 0 (0) |
| 11-20 | 16 (6.53) | 3 (1.22) |
| 21-40 | 43 (17.55) | 21 (8.57) |
| 40-60 | 23 (9.39) | 11 (4.49) |
| >60 | 4 (1.63) | 2 (0.82) |
| Ψ: Multidrug therapy for Leprosy |
CADRs: Cutaneous adverse drug reactions
Discussion
In the present study, CADRs contribution was highest (45.54%) among total ADR reported. Significantly, high values were also shown by other studies [8,19,20]. This might be due to high frequency of visible reactions including those due to MDT for leprosy, which were though noticed by the patients but diagnosed as CADRs by clinicians during their hospital visits in due course of treatment. Demographic data showed higher male preponderance which was supported by many studies [21-24]. Moreover, many studies showed female preponderance. According to them, risk factors are more attributed to cause CADRs in females clinically [25-28]. This study had the majority of CADRs due to MDT prescribed for leprosy, which affected male (n=90, 36.73%) more than females (n=37, 15.1%) at a ratio 2.43:1 [Table/Fig-2]. Literature also support that males are two times more affected than female from leprosy [29]. This contributed leading edge to the male preponderance in this study. It was also seen that the patients belonging to age group of 21-40 were more likely to suffer from CADRs [Table/Fig-2], which was similar to the study conducted by Lihite RJ and Lakhar M, Dhanani JG and Sukhlecha A, and Gupta R et al., [30-32].
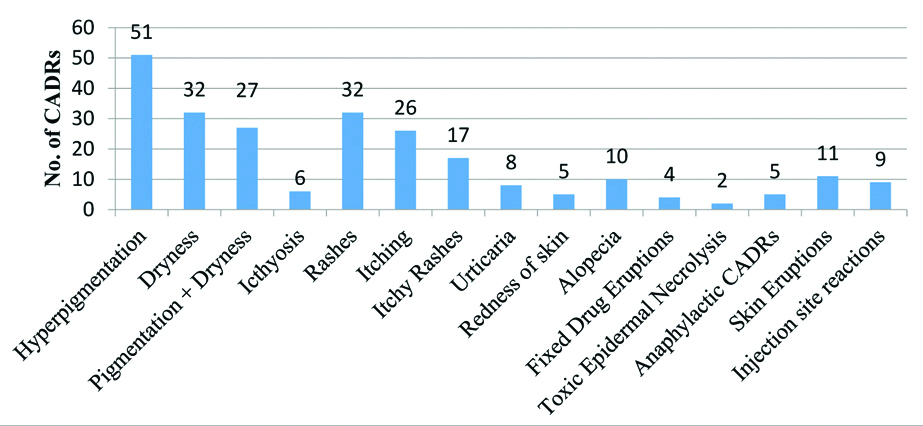
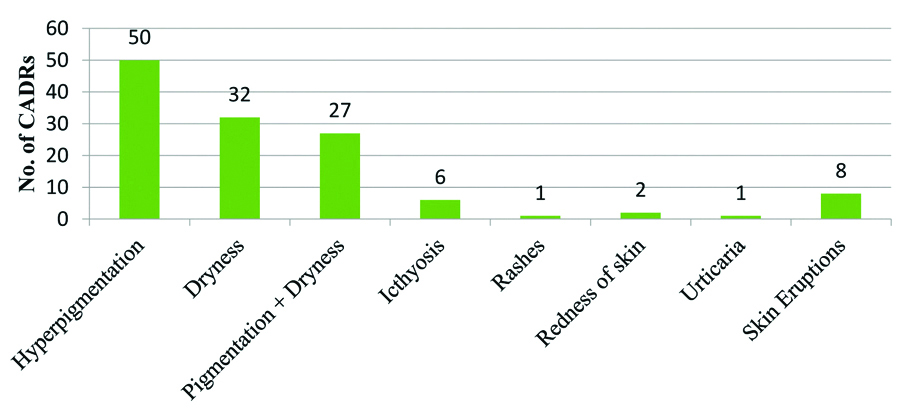
Most common offending drugs were MDT-L followed by other antimicrobials (n=60, 24.49%), Non-Steroidal Anti-Inflammatory Drugs (NSAIDS), anticancer drugs and steroids [Table/Fig-3]. This was in concordance with Nandha R et al., and Gohel D et al., except the finding that CADRs due to MDT-L were exclusively higher (n=127, 51.83%) in the present study [33,23]. Since, abundant leprosy cases clustered in and around Bihar often visit leprosy clinics running in the hospital. So, there were greater numbers of CADRs due to prescribed MDT for leprosy. Hyperpigmentation (n=51, 20.82%), dryness (n=32, 13.1%) or both (n=27, 11%), ichthyosis (n=6, 2.45%) and skin eruptions (n=11, 4.49%) were predominant symptoms in this study which were mostly caused by MDT-L [Table/Fig-4,5]. Another cluster of abundant symptoms, commonly involved rashes (n=32, 13.1%), itching (n=26, 10.61%) or both (n=17, 6.94%) and urticarial (n=8, 3.27%) [Table/Fig-4] in many patients which were shown by Gohel D et al., and many others as most prevailing symptoms in their studies [23]. Acute CADRs like FDE, TEN, skin eruptions, anaphylactic skin manifestations were few, but reflecting possibly idiosyncrasy of CADRs, its severity and poor outcome. Also, the treatment including >1 drugs (62%) [Table/Fig-6] (Point A) and ‘dose not changed’ (n=154, 62.86%) [Table/Fig-6] (Point B) were common specific findings that all related to multidrug therapy, prerequisite in the treatment of leprosy. Lag period data of <1 day commonly indicated to extremely acute cases of CADRs and another peak of Lag period of 1-3 months (n=86, 35.1%) better correlated with CADRs due to MDT-L [Table/Fig-6] (Point C). CADRs with orally administered drugs were most common followed by intravenous route drugs [Table/Fig-6] (Point D). Various possible reasons for this were a higher number of OPD visits and oral prescriptions of antibiotics, MDT-L, NSAIDs and steroids etc.
Drugs causing Cutaneous Adverse Drug Reactions (CADRs).
| S. No. | Offending drugs | No. of CADRs (%) | S. No. | Offending drugs | No. of CADRs (%) |
|---|
| 1. | Multi Drug Therapy for Leprosy (MDT-L) | 127 (51.83) | 6. | NSAIDsAceclofenacAspirinDiclofenacEtoricoxibIbuprofenNaproxenNepafenacParacetamol | 18 (7.35)12811113 |
| 2. | Antimicrobials (Excluding MDT-L)AntibioticsAmikacinAmoxicillinAmoxicillin+ClavulanateAmpicillinAzithromycinCefiximeCefotaxime+SulbactamCeftriaxoneChloramphenicolCiprofloxacinClindamycinLevofloxacinMeropenemMetronidazoleMoxifloxacinOfloxacinOfloxacin+OrnidazolePiperacillin+TazobactamPenicillinRifampicinTicarcillinVancomycin | 60 (24.49)56 (22.86)12232111413141112252115 | 7. | SteroidsBetamethasoneClobetasolDeflazacortDexamethasoneHydrocortisonePrednisolone | 7 (2.86)111112 |
| 8. | Drugs acting on Central nervous systemLevetiracetamLithiumPhenytoinVenlafaxineTramadol | 5 (2)11111 |
| 9. | Drugs acting on Cardiovascular systemAtenololMetoprololTorsemide | 3 (1.22)111 |
| Antifungal agentsMeconazoleLuliconazole | 4 (1.63)22 | 10. | AntihistaminesCetrizineFexofenadineLevocetrizine | 4 (1.63)112 |
| 3. | Anthelmintic drugAlbendazole | 1 (0.41)1 | 11. | Contrast agentsContrapaqueOmnipaque | 4 (1.63)31 |
| 4. | Antiviral agentsAcyclovirValacyclovir | 2 (0.82)11 | 12. | VitaminsMecobalaminVitamin D | 2 (0.82)11 |
| 5. | Anticancer agentsFlurouracilCisplatinCyclophosfamideDaunorubicinOxaliplatin+CarboplatinOxaliplatinPaclitaxelVincristine | 11 (4.49)12111122 | 13. | Miscellaneous drugSunscreen lotion | 1 (0.41)1 |
NSAIDs: Non-steroidal anti-inflammatory drugs
Types of reported Cutaneous Adverse Drug Reactions (CADRs) (n=245).
Types of reported Cutaneous Adverse Drug Reactions (CADRs) due to MDT-L (n=127).
Different parameters of Cutaneous Adverse Drug Reactions (CADRs) reporting.
| Parmeters | No. (%) |
|---|
| A. Number of offending drugs involved per CADRs |
| Single drug | 93 (38) |
| Two drugs | 17 (7) |
| Three drugs | 131 (53) |
| >3 drugs | 4 (2) |
| B. Action taken after CADRs |
| Dose not changed | 154 (62.86) |
| Dose reduced | 1 (0.41) |
| Drug withdrawn | 74 (30.2) |
| Not known | 16 (6.53) |
| C. Distribution of CADRs on Lag period |
| <1 day (Within 24 hours) | 70 (28.57) |
| 1-7 days | 35 (14.26) |
| 7 days-1 month | 37 (15.12) |
| 1-3 month | 86 (35.12) |
| 3-6 month | 12 (4.89) |
| >6 month | 5 (2.04) |
| D. Routes of offending drugs administered |
| Intradermal | 8 (3.27) |
| Intramuscular | 3 (1.22) |
| Intravenous | 54 (22.04) |
| Oral | 172 (70.20) |
| Subcutaneous | 1 (0.41) |
| Topical | 7 (2.86) |
| E. Types of Treatment used for CADRs |
| Medical | 169 (68.98) |
| Nonmedical (Coconut oil/Turmeric paste application) | 18 (7.35) |
| No Treatment | 58 (23.67) |
| F. Time onset of Intervention applied to treat CADRs |
| Active (Immediate treatment given within 30 min) | 84 (34.26) |
| Nonactive (Treatment provided but not immediately) | 103 (42.04) |
| Without active or nonactive intervention | 58 (23.67) |
| G. CADRs outcome |
| Not recovered | 74 (30.2) |
| Recovering | 108 (44.1) |
| Recovered | 51 (20.81) |
| Unknown | 12 (4.89) |
| H. Distribution of CADRs reporters |
| Senior residents | 13 (5.30) |
| Junior residents | 153 (62.45) |
| Interns | 19 (7.76) |
| Other health care staff | 7 (2.86) |
| Patient Safety Pharmacovigilance Associate (PSPA) | 48 (19.59) |
| Consumer | 5 (2.04) |
| I. Types of reactionΨ |
| Type A | 178 (72.65) |
| Type B | 62 (25.31) |
| Type H | 5 (2.04) |
| Ψ: Types of reactions include; Type A (Augmented), B (Bizarre), C (Chemical), D (Delayed), E (Exit), F (Familial), G (Genotoxicity), H (Hypersensitivity), U (Unclassified) |
Types of treatment given (medical and nonmedical), better correlated with interventions used (active and nonactive) corresponding to a total of n=187 (76.35%) CADRs. Whereas, neither treated nor intervened CADRs cases were in equal proportion [Table/Fig-6] (Point E,F). Combined recovering and recovered cases as noted at the time of reporting were ~2/3rd (n=159, 64.9%) of total CADRs outcome [Table/Fig-6] (Point G). This is possibly explained by availability of good health facilities in the hospital and high prevalence of mild CADRs, which resulted in desired outcome. Higher proportion of junior residents followed by pharmacovigilance associate were involved and worked together in collaboration to ensure maximum possible reporting at this AMC centre [Table/Fig-6] (Point H). CADRs type A/B ratio was found 2.87:1 [Table/Fig-6] (Point I). It suggested that most of reactions were augmented, dose dependent and predictable.
The study was further concretised with agreement study applied to causality, severity and preventability scales of CADRs. Ratings were manually done at the AMC by PSPA at the time of ADR submission through Vigiflow for central assessment and further it was re-evaluated by Pharmvigill ADR mobile app analyser to check reliability of rating. Pharmvigill mobile application (app) is a software based ADR analyser compiled up 56 various questionnaires of assessment scales to just 16, thereby it shortened evaluation time and enabled us doing multiple ratings in a single setting for any ADR [34].
Chawla S et al., found this app as accurate and suitable as a manual analysis tool for assessing ADRs [35]. Manual and Pharmvigill app results were compared according to flow chart for different assessment scales using Cohen kappa statistics in differential grade of strength. For Cohen Kappa Value ≤0 (No Agreement), 0.01-0.20 (Slight), 0.21-0.40 (Fair), 0.41-0.60 (Moderate), 0.61-0.80 (Substantial) and 0.81-1.00 (Almost Perfect) were considered as grading of Cohen kappa agreement (McHugh, 2012) [18].
Causality was revealed majorly as ‘possible’ followed by ‘probable in both scales when rated by both manual and app for each scale. In this context, causality assessment by WHO-UMC scale (manual vs app, K=0.678) and by Naranjo’s Algorithm (manual vs app, K=0.820) were considered adequate with less disputes as Weighted Kappa value (K>0.6) [Table/Fig-7]. Since, WHO-UMC scale is currently preferred scale for causality assessment by PvPi whereas Naranjo’s scale is used often because of its time saving value and ease of algorithmic interpretation. But, only ‘fair’ agreement was observed between WHO-UMC scale and Naranjo’s algorithm when manual vs manual (K=0.290) and app vs app (K=0.319) were compared [Table/Fig-7]. Lower value of Kappa (if K<0.6) was due to the differences in rating pattern and definition of causality criteria in both scales. Belhekar MN et al., (Kappa=0.145) and Rehan HS et al., (Kappa=0.214) also found “poor” agreement between the above two scales in their study [36,37]. Whereas, Acharya TA et al., concluded “Moderate” agreement with (Kappa=0.60) and recommended both scales for better assessment, which was due to smaller sample size as already explained by them [38]. Sharma S et al., concluded that both WHO-UMC scale and Naranjo’s scale were reliable and valid tools for causality assessment but the inter-rater agreement was slightly better with Naranjo’s scale than WHO-UMC scale, which was also reflected through this study [39].
Inter-rater agreement between manual and pharmvigill app for different assessment scales [18].
| Assessment scales (Manual vs App) | Number of observed agreement (%) | Number of agreement expected by chance (%) | SE of Kappa | 95% CI | Kappa (k) | Weighted Kappa (K) | Kappa interpretation |
|---|
| WHO-UMC scale | 207 (84.49%) | 127.0 (51.83%) | 0.048 | 0.584-0.772 | 0.678 | 0.678 | Substantial |
| Naranjo’s algorithm | 208 (90.43%) | 118.4 (51.48%) | 0.040 | 0.725-0.880 | 0.803 | 0.820 | Substantial |
| Hartwig and Siegel severity scale | 233 (95.10%) | 136.7 (55.81%) | 0.031 | 0.829-0.950 | 0.889 | 0.893 | Almost perfect |
| Modified Schumock and Thornton scale | 191 (77.96%) | 150.1 (61.28%) | 0.055 | 0.323-0.538 | 0.431 | 0.434 | Moderate |
| Inter-rater agreement (manual vs manual) and (app vs app) between WHO-UMC scale and Naranjo’s algorithm [18]. |
| WHO-UMC scale (Manual) vs Naranjo’s algorithm (Manual) | 149 (60.82%) | 111.1 (45.36%) | 0.046 | 0.192-0.373 | 0.283 | 0.290 | Fair |
| WHO-UMC scale (App) vs Naranjo’s algorithm (App) | 145 (59.18%) | 106.1 (43.31%) | 0.047 | 0.189-0.371 | 0.280 | 0.319 | Fair |
SE: Standard error; CI: Confidence interval; WHO-UMC: World health organisation-Uppsala monitoring cent
Modified Schumock and Thornton scale assessed ~2/3rd of CADRs as ‘definitely preventable’ [Table/Fig-8] which better correlated with 72.65% of predictable CADRs (type ‘A’ reactions). Most preventable CADRs were also predictable and favoured definite diagnosis and treatment. Agreement study by manual vs app showed ‘Moderate’ strength with K=0.434 [Table/Fig-7]. Discrepancies were because of mixed questionnaires pattern and concise design of pharmvigill app. Both manual and pharmvigill app found most of the CADRs as ‘mild’ followed by ‘moderate’ in severity by using Hartwig and Siegel scale [Table/Fig-8]. Similar findings were suggested by Talib NH et al., study conducted in Malaysia [40]. CADRs like dryness, hyperpigmentation, rashes, itching were more prevalent reactions of mild to moderate in nature and very few cases were severe reactions like anaphylactic reactions and TEN. Single case of mortality was seen due to valacyclovir induced TEN. Since, questionnaires of app for severity assessment were pooled in accordance to manually performed rating, it yielded ‘Almost perfect’ (K=0.893) agreement [Table/Fig-7].
Comparison of manual vs pharmvigill app rating for various assessment scales of Cutaneous Adverse Drug Reactions (CADRs).
| Various assessment scales | Manual rater n (%) | Pharmvigill app n (%) |
|---|
| A. WHO-UMC causality scale |
| Certain | 0 (0) | 0 (0) |
| Probable | 97 (39.59) | 101 (41.22) |
| Possible | 148 (60.41) | 144 (58.78) |
| Unlikely | 0 (0) | 0 (0) |
| B. Naranjo’s algorithm |
| Definite | 18 (7.35) | 33 (13.47) |
| Probable | 178 (72.65) | 164 (66.94) |
| Possible | 49 (20) | 48 (19.59) |
| Doubtful | 0 (0) | 0 (0) |
| C. Preventability (Modified Schumock and Thornton) scale |
| Not preventable | 9 (3.67) | 0 (0) |
| Probable preventable | 73 (29.8) | 35 (14.29) |
| Definitely preventable | 163 (66.53%) | 210 (85.71) |
| D. Severity (Hartwig and Siegel) scale |
| Mild | 163 (66.53) | 171 (69.8) |
| Moderate | 78 (31.84) | 72 (29.39) |
| Severe | 4 (1.63) | 2 (0.81) |
WHO-UMC: World health organisation-Uppsala monitoring center
Limitation(s)
Though this study was based on reporting of ADRs in regional AMC centre at AIIMS, Patna, Bihar, reflecting mostly regional population, many of ADRs reporting may be missed due to under reporting, poor active reporting at the consumer level, irrelevant or incomplete case scenario or records etc. which would contribute to assess profile more precisely if any.
Conclusion(s)
Cutaneous Adverse Drug Reactions (CADRs) were most prevalent and early recognisable ADRs which enabled prompt medical care to prevent a serious outcome. MDT for leprosy is often presented with CADRs with high frequency and may have distinctive impact on CADRs profile of Bihar. Inter-rater agreement study is established as a precise tool to check reliability of causality, severity and preventability assessment of ADRs. Manual assessment varies in their results with the pharmvigill app and is still more reliable and popular. Results of this study also emphasised the need of ADR reporting in tertiary care hospitals to generate safety alarm to the offending government supply drugs and assessing its benefit- risk ratio. Finally, CADRs concluded as a common occurrence, and awareness about them was essentially needed for its early detection, diagnosis and prevention and exploration of associated risk factors as well.
CADRs: Cutaneous adverse drug reactions
NSAIDs: Non-steroidal anti-inflammatory drugs
SE: Standard error; CI: Confidence interval; WHO-UMC: World health organisation-Uppsala monitoring cent
WHO-UMC: World health organisation-Uppsala monitoring center