Oral Submucous Fibrosis (OSMF) is a slowly progressive chronic fibrotic disease of the oral cavity and oropharanyx. OSMF results in trismus, burning sensation after ingestion of spicy food, blanched mucosa, restricted tongue mobility in advanced stages. Pindborg and Sirsat in 1966 defined OSMF as “an insidious chronic disease affecting any part of the oral cavity and sometimes the pharynx, although occasionally preceded by and/or associated with vesicle formation, it is always associated with juxta-epithelial inflammatory reaction followed by a fibroelastic change of the lamina propria with epithelial atrophy leading to stiffness of the oral mucosa and causing trismus and inability to eat” [1,2]. Many studies have shown degeneration changes of underlying musculature in OSMF which has caused the impairment in their function [3,4]. When palatal and paratubal muscles such as levator veli palatine, tensor veli palatine, tensor tympani and salphinogopharyngeous gets affected, it leads to impairment of patency and function of eustachian tube. This leads to pain in ear along with mild to moderate conductive loss of hearing [5-7]. The aim of this study was to evaluate the hearing deficit in OSMF patients.
Materials and Methods
The present study was carried out at the Department of Oral Medicine and Radiology of M.A. Rangoonwala Dental College and Research Centre, Pune, Maharashtra, India. It was a cross sectional study. Duration of study was 1 year 2 months, started from 1st January 2016 and completed on February 2017. The study protocol was approved by the Institutional Ethics Committee.(MARDC/7182/2015) written consent was taken from patients; the clinical profiles of the patients were taken from a thorough case history and clinical examination. The patients had been referred to an otolarynogologist for clinical examination of the ear and to exclude ear infections or any other abnormalities. As per the criteria given by Bailoor and Nagesh: presence of burning sensation, blanching of oral mucosa, restricted tongue protrusion, restricted mouth opening, palpable fibrous bands patients were diagnosed as OSMF and a detailed case history proforma was filled [8].
Inclusion criteria: The study included 50 subjects (100 ears, irrespective of the gender) with 40 disease group and 10 control group within age limit of 18-40 years. Inter incisal opening was noted for all the patients using Vernier caliper. The study group was divided into four subgroups of 10 patients each: group A-(inter incisal distance >35 mm), group B-(30-35 mm), group C- (20-30) and group D- (<20 mm) using Clinical Classification of Lai [2,7]. The control group comprised of 10 healthy subjects. In this study inclusion criteria consisted of subjects having no pathology of middle ear e.g., tympanic membrane perforation, cholesteatoma, ear wax and 10 healthy individuals with healthy mucosa.
Exclusion criteria: Age-related hear loss above 50 years, subjects with previous history of middle ear infections/otitis media and any other abnormalities and subjects with any previous ear surgeries.
All the subjects were evaluated for air conduction hearing loss and bone conduction hearing loss using PROTON DX-5 (Arphi) audiometer which make with frequency range of 250 Hz to 8000 Hz (i.e., 125, 250, 500, 1000, 2000, 3000, 4000 and 8000 Hz) and with intensity range of -10 to +120 dB was used for PTA.
Audiometry analysis: PTA is the technique used for checking hear-loss. Pure tone was delivered to the ear through headphone for air conduction and by bone vibrator for bone conduction. Hearing level was measured in decibel. The frequency tested usually ranged from 250 to 8000 Hz. The pure tone average is the average of the hearing threshold levels at 500, 1000, 2000 Hz only [2].
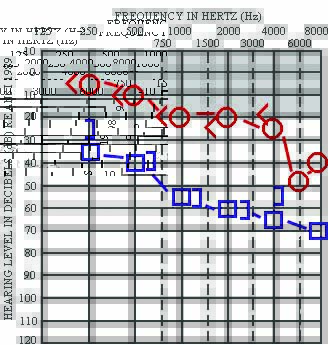
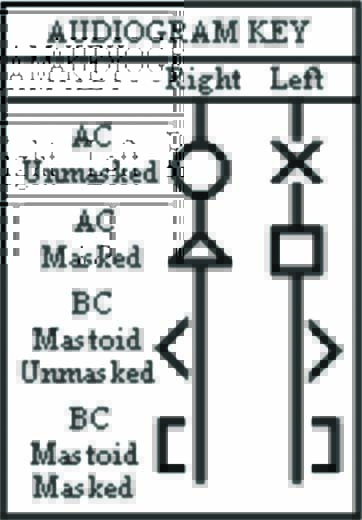
For air conduction: After explaining the patient about the procedure, patient was seated in a close field chamber with audio cups (ear phones) on ears. The right ear was tested first. The lowest intensity after which patient stops hearing in descending order, was recorded in each frequency ranging from 250 Hz to 8000 Hz. This lowest intensity at which patient can hear is the hearing threshold of air conduction at a given frequency. A graph was obtained using these threshold values [Table/Fig-1] using appropriate signs [Table/Fig-2]. This graph is known as pure tone audiogram. Same procedure was repeated for the left ear. Using air conduction threshold, the deafness can be graded into several categories which gave the quantitative data [Table/Fig-3] [2]. The same procedure was repeated on left side.
Quantitative grading of hearing impairment [2].
| Grading (dB) | Hearing impairment |
|---|
| 10-15 | Normal hearing |
| 16-25 | Minimum hearing loss |
| 26-40 | Mild |
| 41-55 | Moderate |
| 56-70 | Moderate to severe |
| 71-90 | Severe |
| >90 | Profound deafness |
For bone conduction: After explaining the patient about the procedure, bone conduction vibrators were kept on mastoid process on right side and lowest intensity after which patient stops hearing was recorded as bone conduction threshold at a particular frequency. Bone conduction threshold was measured in frequency range of 250 Hz to 4000 Hz.
Hearing impairment or the deafness was further classified qualitatively into normal, conductive, mixed or sensorineural, depending upon the following criterias [Table/Fig-4] [2]. Qualitative hearing loss is always the type of hearing loss which will tell that what exactly the type and area of disorder like sensorineural hearing loss. In quantitative hearing loss, this study check the severity of hearing loss and its written in decibels. By using the quantitative grade and qualitative type of hearing impairment together, the type of hearing impairment can be described.
Qualitative types of hearing impairment [2].
| Type of hearing impairment | Air conduction | Bone conduction | AC-BC gap |
|---|
| Normal | Normal | Normal | Minimal |
| Conductive | Abnormal | Normal | More than 20 |
| Sensorineural | Abnormal | Abnormal | Less than 15 |
| Mixed | Abnormal | Abnormal | More than 20 |
When hearing loss was observed, the next step was to try and determine whether the loss was caused by a sensory problem (sensorineural hearing loss) or a mechanical problem {Conductive Hearing Loss (CHL)}. This distinction was made by using a bone vibrator which bypassed the mechanical parts of the middle ear. If hearing was better using bone than air, this suggested a CHL [2]. In the present study, all the patients were evaluated using both air conductive and bone conductive audiometry, and their mean was recorded as values for that particular case.
Statistical Analysis
The entire data was statistically analysed using Statistical Package for Social Sciences (SPSS, Ver 11.5) for MS Windows. The statistical significance of inter-group difference in the distribution of categorical variables was tested using Chi-Square test with Post Hoc Bonferroni’s correction for multiple group comparisons. The inter-group statistical comparison of quantitative hearing loss in decibels (dB) in both the ears was performed. The p-value <0.05 was considered to be statistically significant.
Results
This study comprised of 30 males and 10 females in the study group and control of 4 males and 6 females in the control group. In group A & B there were 70% of males and 30% of females. In group C and D there were 80% of males and 20% of females. In control group there were 40% of males and 60% of females.
Using Chi-Square test, the value was 4.963 and p-value=0.291 which was statistically non significant. The sex distribution of cases did not differ significantly across five study groups (p-value >0.05) [Table/Fig-5].
The sex distribution of cases studied across five study groups.
| Sex | Group A | Group B | Group C | Group D | Controls |
|---|
| n | % | n | % | n | % | n | % | n | % |
|---|
| Male | 7 | 70 | 7 | 70 | 8 | 80 | 8 | 80 | 4 | 40 |
| Female | 3 | 30 | 3 | 30 | 2 | 20 | 2 | 20 | 6 | 60 |
| Total | 10 | 100 | 10 | 100 | 10 | 110 | 10 | 100 | 10 | 100 |
Values are n (% of cases).
Chi-Square value=4.963; p-value=0.291; NS: Non-Significant).
Study group showed a significant degree of hearing loss compared to the control group. Among the study group, the higher degree of hearing loss was seen in group C and group D compared to group A and group B (p<0.01).
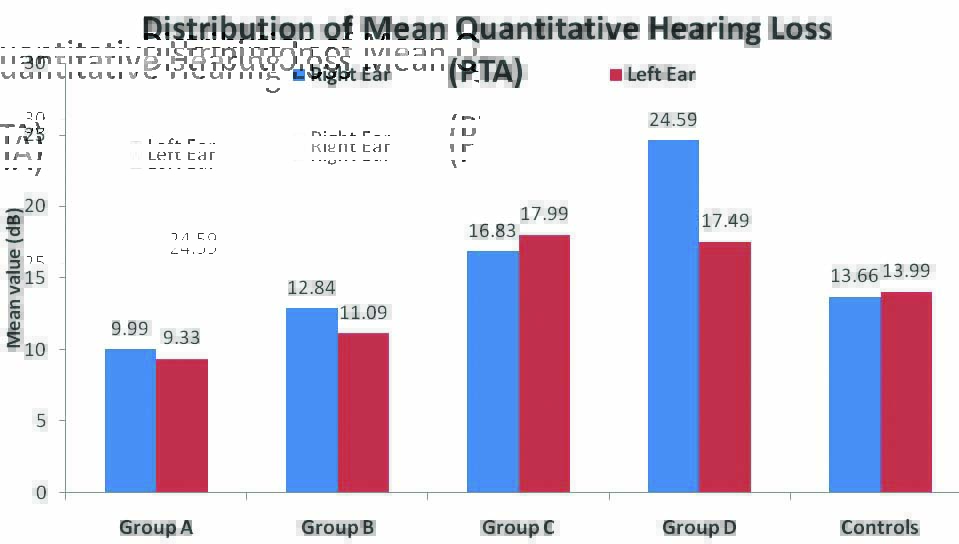
The Mean±SD of quantitative hearing loss in right ear in terms of PTA in decibels (dB) across was: group A was 9.99±4.90, group B was 12.84±6.63, group C was 16.83±5.69, group D was 24.59±10.87 and control group was 13.66±5.92. The Mean±SD of hearing loss in left ear in terms of PTA in decibels (dB) across was: group A was 9.33±4.39, group B was 11.09±4.07, group C was 17.99±6.23, group D was 17.49±7.90 and control group was 13.99±6.25. The distribution of mean PTA (quantitative hearing loss in dB) was significantly higher in groups C and D compared to group A and group B (p-value <0.05 for both) [Table/Fig-6].
The distribution of mean PTA (quantitative hearing loss in decibels (dB)) in both the ears among the cases studied across five OSMF study groups. The distribution of mean PTA (quantitative hearing loss in dB) was significantly higher in group C and D compared to group A and group B (p-value <0.05 for both).
Among multi-group comparison, difference between group A vs group C for left ear, group A vs group D for both ears, group B vs group D (right ear), group D vs control (right ear) were significant.(p<0.05) [Table/Fig-7].
The multiple group comparisons of mean PTA (quantitative hearing loss in decibels (dB) in both the ears.
| Comparison | Multiple group comparisons (p-value) |
|---|
| Group A vs Group B | Group A vs Group C | Group A vs Group D | Group A vs controls |
|---|
| Right ear | 0.999NS | 0.373NS | 0.001*** | 0.999NS |
| Left ear | 0.999NS | 0.021* | 0.036* | 0.856NS |
| Comparison | Group B vs Group C | Group B vs Group D | Group B vs controls | Group C vs Group D |
| Right ear | 0.999NS | 0.006** | 0.999NS | 0.188NS |
| Left ear | 0.126NS | 0.201NS | 0.999NS | 0.999NS |
| Comparison | Group C vs controls | Group D vs controls | | |
| Right ear | 0.999NS | 0.013* | | |
| Left ear | 0.999NS | 0.999NS | | |
Values are p-values by one-way analysis of variance (ANOVA) with Post-Hoc Bonferroni’s test for multiple group comparisons. p-value <0.05 is considered to be statistically significant, *p-value <0.05, **p-value <0.01, ***p-value <0.001, NS-Statistically nonsignificant.
Qualitative hearing loss: In 40 OSMF patient’s revealed, right ear: Hearing was normal in 100% of group A cases, 90% of group B cases, 70% of group C cases and 30% of cases of group D. Mild CHL was seen in 10% of group B cases, 20% in group C and 40% in group D cases. Moderate conductive loss was seen in 10% in group C and 20% in group D. Mild sensorineural loss was seen in 10% of group D cases (seen only in one ear).
In left ear hearing was normal in 100% of group A cases, 100% of group B cases 60% of group C cases and 50% of cases of group D. Mild CHL was seen in 30% of group C and 40% in group D cases. Moderate conductive loss was seen in 10% in group C and 10% in group D. In both the ears among control group, 80% of cases were with normal hearing and 20% was seen with mild CHL. The distribution of qualitative hearing loss was significantly higher in group C and group D (p-value <0.05) [Table/Fig-8].
The distribution of qualitative assessment of hearing loss among the cases studied across five OSMF study groups.
| Hearing loss | Group A (n=10) | Group B (n=10) | Group C (n=10) | Group D (n=10) | Controls (n=10) |
|---|
| n | % | n | % | n | % | n | % | n | % |
|---|
| Right ear |
| Normal | 10 | 100 | 9 | 90 | 7 | 70 | 3 | 30 | 8 | 80 |
| Mild conductive | 0 | 0 | 1 | 10 | 2 | 20 | 4 | 40 | 2 | 20 |
| Moderate conductive | 0 | 0 | 0 | 0 | 1 | 10 | 2 | 20 | 0 | 0 |
| Mild sensorineural | 0 | 0 | 0 | 0 | 0 | 0 | 1 | 10 | 0 | 0 |
| Left ear |
| Normal | 10 | 100 | 10 | 100 | 6 | 60 | 5 | 50 | 8 | 80 |
| Mild conductive | 0 | 0 | 0 | 0 | 3 | 30 | 4 | 40 | 2 | 20 |
| Moderate conductive | 0 | 0 | 0 | 0 | 1 | 10 | 1 | 10 | 0 | 0 |
| Mild sensorineural | 0 | 0 | 0 | 0 | 0 | 0 | 0 | 0 | 0 | 0 |
The distribution of qualitative hearing significantly higher in Group C and Group D (p-value <0.05). The statistical inter group comparison of continuous variables is performed using Chi-Square test.
The multi group comparisons of qualitative hearing loss were also done. The distribution of qualitative hearing was significantly higher in group D compared to group A (p-value<0.05) [Table/Fig-9].
The multiple group comparisons of mean PTA (qualitative hearing loss in both the ears).
| Comparison | Multiple group Comparisons (p-value) |
|---|
| Group A vs Group B | Group A vs Group C | Group A vs Group D | Group A vs Controls |
|---|
| p-values | 0.999NS | 0.099NS | 0.009** | 0.999NS |
| Comparison | Group B vs Group C | Group B vs Group D | Group B vs Controls | Group C vs Group D |
| p-values | 0.423NS | 0.060NS | 0.999NS | 0.999NS |
| Comparison | Group C vs Controls | Group D vs Controls | | |
| p-values | 0.999NS | 0.210NS | | |
Values are p-values by Chi-Square test with Post-Hoc Bonferroni’s test for multiple group –comparisons. p-value <0.05 is considered to be statistically significant; *p-value <0.05; **p-value <0.01; NS-Statistically non-significant.
Discussion
OSMF is a chronic insidious disease sometimes preceded by vesicle formation or stomatitis, but always associated with juxta-epithelial inflammatory reaction and fibroelastic changes of lamina propria with epithelial atrophy. It causes stiffening of the oral mucosa which becomes dry, blanched and leathery in consistency and results in trismus [1]. In 600 BC, Sushruta described a condition resembling OSMF and named it ‘Vidari’ [3]. Schwartz J in 1952 noticed a fibrosing condition and named it as “Atrophica idiopathica mucosae oris" [5]. Joshi SH in 1953 named it as “Oral submucous fibrosis”, which is a widely accepted terminology [3,6]. OSMF is predominantly seen in India (prevalence rate 0.2% to 0.5%), and an estimated 2.5 million people suffer from the disease [9]. There are many irritants such as capsaicin, tobacco and tannins in betel nuts, misi, clay, alcohol, eugenol, areca nuts which causes irritation of oral mucosa. There are also some other factors which could be the aetiological factors for this condition like nutritional deficiencies, autoimmunity, immunological factors, salivary coagulopathic factors, genetic susceptibility, increased lysyl oxidase levels [9]. The alkaloid which is present in arecanut extract stimulates collagen. Tannins present in arecanut have been shown to reduce the collagenase activated collagen degradation products. OSMF as a collagen disorder was first suggested by Su I [10].
Many studies have shown the involvement of underlying musculature in OSMF [4]. Histologically, the characteristic features of OSMF are homogenous, collagenous subepithelial zone in which there are oedematous, degenerating, atrophic and necrotised muscle fibres present [11]. With incisional biopsies Gupta SC et al., reported histopathological changes in palatal muscles in OSMF patients. They have described degenerative changes in palatal/paratubal muscles in the form of loss of cross striations in 13.2%, oedematous muscle fibres in 9.4% and atrophy in 9.4% cases. The study concluded that there was a definite involvement of palatal and paratubal muscles in OSMF which further resulted in eustachian tube dysfunction causing hearing impairment in patients [4]. The function of eustachian tube gets affected when the fibrosis gets extended into nasopharynx and pharyngeal orifice of eustachian tube and the muscles. The eustachian tube connects the anterior wall of the middle ear to the lateral wall of the nasopharynx (at the level of the inferior nasal conch) [12]. The primary role of the eustachian tube is to maintain the quality of air pressure across the tympanic membrane, which is necessitated by the absorption of gases through the mucous membrane in the middle ear and by the variation in ambient atmospheric pressure [13]. Abnormal or impaired eustachian tube functions may cause pathological changes.
The main muscles attached to the eustachian tube and the soft palate is the tensor veli palatine and levator veli palatine. These two muscles and the other accessory muscles are referred to as palatal/paratubal muscles of the eustachian tube are physiologically and pathologically important. Palatal and paratubal muscles which regulate the patency and function of pharyngeal orifice may get affected in the advanced stages of OSMF, resulting in impairment of function and patency of eustachian tube. This leads to pain in the ear along with mild to moderate conductive loss of hearing [14].
In the present study, pure tone audiometry of 80 ears in 40 OSMF patients revealed that hearing was normal in 100% in group A, 95% in group B, 65% in group C and 40% in group D. Mild CHL was not seen in group A, 10% seen in group B, 30% in group C and 40% in group D. Moderate conductive loss was not seen in group A and B, 10% was seen in group C and 15% in group D considering both the ears. Mild sensorineural hearing loss was 10% and seen only in group D seen only in one ear. Among control group, 80% of cases were with normal hearing and 20% were with mild CHL. With these observations, there was no significant difference in mean hearing loss between OSMF groups A and B. group C and group D were significantly associated with mild and moderate CHL (p<0.05) [Table/Fig-8]. The reasons for these results might be in the advanced stages of OSMF, mainly C and D, there is fibrosis of palatal muscles as found by Gupta SC et al., in their studies [4]. Extension of fibrosis into oropharanyx involving the pharyngeal orifice of eustachian tube due to up regulation of cystic C can affect the functions of eustachian tube as given by Arnold M et al., Abnormal or impaired eustachian tube functions cause pathological changes in the middle ear which can in turn lead to hearing impairment [15].
The results obtained in this study was similar with the study done by Gupta SC et al., (2004) using PTA, where hearing was found to be normal in 79.2%, mild to moderate CHL was evident was evident in 18% and sensorineural hearing loss was found in 2.8%. The author had also used tympanometry and ETF test to evaluate hearing loss. The results concluded that the eustachian tube functions may be affected in OSMF patients [4]. Similar results were obtained like present study in the study done by Devi P et al., they had grouped OSMF patients under four groups depending upon interincisal distance classified by Lai, they had done PTA of 80 ears in 40 OSMF subjects and revealed that hearing was normal in 56%, mild CHL was present in 39%, mild sensorineural hearing loss was present in 4% and moderate sensorineural hearing loss was present in 3%. Out of 20 ears in the control group, hearing was found to be normal in 19 ears (95%), and mild CHL was found in 1 ear (5%). The conclusion was, OSMF in advanced stages was significantly associated with mild CHL (p<0.01) [2]. But in the comparison with present study, some studies showed different results like in the study done by Siddiqui SN et al., only the results obtained by using ETF test were statistically significant but the PTA and tympanometry results were statistically insignificant [11,12].
Limitation(s)
As all studies have some limitations, limitations of this study was the audiometry results sometimes showed false negative results in some cases and many a times patients were not willing to get their audiometry test done.
Conclusion(s)
OSMF is considered as a potentially malignant condition which affects structures adjacent to oral cavity. With this study, it was concluded that there is a significant correlation between OSMF and the degree of hearing deficit, especially in the advanced stages mainly in group C and D which correlate with the degree of fibrosis of eustachian tube. As fibrosis of the oropharanyx leads to altered perception of sound, all patients with OSMF should be evaluated for hearing deficit. Also, as the test is non-invasive, painless and less time consuming, it may be helpful in assessing the morbidity. Therefore, the protocol for managing OSMF patients should include ENT consultation and treatment for hearing deficit in order to increase the success rate of treatment.
In OSMF patients who have been tested for hearing loss, when OSMF condition start treating, at the same time hearing loss should also be start treating. On their visit along with the improvement in interincisal distance and their signs and symptoms of OSMF, a record of their qualitative and quantitative hearing loss should also be kept by taking audiometry scans regularly.
Values are n (% of cases).
Chi-Square value=4.963; p-value=0.291; NS: Non-Significant).
Values are p-values by one-way analysis of variance (ANOVA) with Post-Hoc Bonferroni’s test for multiple group comparisons. p-value <0.05 is considered to be statistically significant, *p-value <0.05, **p-value <0.01, ***p-value <0.001, NS-Statistically nonsignificant.
The distribution of qualitative hearing significantly higher in Group C and Group D (p-value <0.05). The statistical inter group comparison of continuous variables is performed using Chi-Square test.
Values are p-values by Chi-Square test with Post-Hoc Bonferroni’s test for multiple group –comparisons. p-value <0.05 is considered to be statistically significant; *p-value <0.05; **p-value <0.01; NS-Statistically non-significant.