The foundation of any clinical laboratory for efficient services is based on its validity, reliability, authenticity and its timeliness of reports generated. Clinical biochemists sometimes ignore timeliness as an important attribute and instead focus on improving the analytical details of the processing of samples. However, clinicians often use the timeliness expressed as the TAT as the laboratory performance standard. Clinicians count on rapid TAT for early diagnosis and treatment of their patient and early discharge from hospital services. The evaluation and improvement of TAT is crucial for the management of laboratory quality and the satisfaction of patients. There are many factors beyond the laboratory’s jurisdiction that influence such as non-analytical delays which may be responsible for up to 96% of total TAT [1,2].
TAT is calculated as time taken from the collection of samples to the reporting results. Patient’s diagnosis and treatment is depended on the accurate laboratory reports. Delays in reporting laboratory results can lead to a simultaneous delay in patient diagnosis and management. Direct evaluation of TAT helps lab personnel to understand whether local performance is improving and how it is compared to published standards. The TAT for laboratory tests includes the time taken from the order of the test till the clinicians receive the report. It includes placement of orders, collection of specimens, transportation to the laboratory, reception in the pneumatic, centrifugation, transportation time from pneumatic to biochemistry laboratory, analysis time, the time after completion of analysis until result release and availability of the reports to the clinicians and patients. For routine tests versus urgent tests, the TAT would not be similar. For ICU/emergency service, TAT would be different [3-5].
Repetitively, patients and physicians complaint about the time taken by the laboratory for the investigation. Hospital computerisation and receipt of the report on computer by clinician would help in improving TAT. The present study was aimed to observe the TAT of routine biochemical investigations, to categorise reasons for increased TAT and to formulate a plan to rectify increased TAT.
Materials and Methods
It was hospital based cross-sectional study which was conducted at Clinical Biochemistry Section of the Central Diagnostic Laboratory which is National Accreditation Board for Testing and Calibration Laboratories (NABL) accredited. TAT data from April 2014 to September 2015 from system (IT) Department of the hospital was collected. Ethical approval was taken with Institutional Ethics Committee with approval letter no. IEC/HMPCMCE/77/faculty/1/59/17.
Instruments: The laboratory is equipped with the latest instrument like Siemens Advia Centaur Immunoassay System for hormone assays, Siemens Dimension Xpand, Siemens Dimension Rxl for routine chemistry, AVL electrolyte analyser and Arterial Blood Gas analyser (ABG).
Sample collection and processing: The samples from outdoor patients were collected at a centralised collection centre by trained phlebotomists whereas the respective nursing staff and resident doctors drew indoor patients’ samples. The laboratory support staff made entry in the Laboratory Information System (LIS) regarding the time of sample reception by the laboratory. The samples were processed in the order in which they were received in the laboratory. After the validation was complete, the biochemistry consultant dispatched the report and time was noted on LIS. Quality control samples were run daily according to NABL requirements in the laboratory for all the analytes to identify any intra-assay variation. The samples including ABG analysis received from Emergency and Trauma Department were processed immediately on priority basis.
Data collection: Hospital and Laboratory use Hospital Information System (HIS) and Laboratory Information System (LIS) with availability of barcode reader at every station from blood collection centre till report get released. At each station when blood sample comes, time of sample receiving at that station with name of the person who received the sample gets updated in LIS. Authors requested data for specific period from IT Department of hospital and we exported that data into excel sheet and then analysed it. In our NABL accredited laboratory, all files are available in LIS which includes list of rejected samples with time.
Definition of TAT: The laboratory TAT can be defined in different ways based on the test type, the type of analyte and the type of institution. In present study, TAT was defined as the time of sample collection till the report is dispatched to the patient. Total TAT was divided into three phases: pre-analytical, analytical and post-analytical phases. The pre-analytical phase is from the receipt generation to sample accepted in laboratory by staff. The analytical phase includes time from the samples loaded into instruments till results come. The post-analytical phase includes both the technical validation by the laboratory consultant and report dispatch. The ward reports were dispatched to the respective wards after validation of report by laboratory consultant. The steps have been represented [Table/Fig-1].
Phases of sample processing.
| Pre-analytical phase | Registration and sample collection by staff in OPD. |
| Sending the samples from collection centre to pneumatic centre. |
| Distribution from pneumatic centres to Biochemistry laboratory. |
| Analytical phase | Receiving of samples, processing, testing and test result validation by biochemistry consultant. |
| Post-analytical phase | Dispatching of report from biochemistry laboratory to pneumatic centre. |
| Sending off the report from pneumatic centres to the patient or concerned department. |
OPD: Out patient department
Minimum possible time was used from clinicians’ requisition of a test to availability of report as TAT for that specific test. Our laboratory is NABL accredited since a decade. Gradually, over the time we have improved our TAT for all the tests which also depends on instrument processing time, updates in LIS system, changes in manpower. The laboratory follows TAT (for OPD and ICU) as per [Table/Fig-2].
Turn Around Time (TAT) of various tests in clinical biochemistry laboratory.
| Turn around time | Name of tests |
|---|
| 40 minutes | Blood gas analysis |
| 60 minutes | Serum Electrolytes (Sodium, Chloride, Ionized Calcium, Potassium) |
| 90 minutes | Body fluid chloride/protein/Glucose/LDH, Serum Creatinine, Serum Amylase, Serum Creatinine Kinase (MB), Serum Creatinine Kinase Total, Serum Electrolytes, Serum Glucose, Glycosylated Hb, Serum Bilirubin, Serum Glutamate Oxaloacetate Transaminase, Serum Glutamate Pyruvate Transaminase, Serum Total Protein and Albumin, Serum Phosphorus, Serum Total Calcium, Serum Urea, Serum Uric Acid, Serum Magnesium, Serum Lipase, Serum Digoxin, Serum Troponin-I, Serum/ Body fluid CEA, Serum HCG, Serum Prolactin, Serum PSA, Serum Magnesium, Serum Cholinesterase, C-reactive protein |
| 3 Hours | Serum TSH, Serum Free T3, Serum Free T4, Urine micro albumin, Serum Vitamin B12, Serum Iron, Serum TIBC, Serum/Body fluid ADA, Serum Vitamin D3, Serum Procalcitonin |
LDH: Lactate dehydrogenase; Hb: Haemoglobin; CEA: Carcinoembryonic antigen; HCG: Human chorionic gonadotro-pin; PSA: Prostate-specific antigen; TSH: Thyroid stimulating hormone; T3: Triiodothyronine; T4: Tetraiodothyronine; TIBC: Total iron-binding capacity; ADA: Adenosine deaminase
The laboratory technicians and the resident doctors of biochemistry recorded the reasons for the delay of specimens which exceeded the TAT. The collected data were presented and discussed in the monthly laboratory services meeting.
Statistical Analysis
Collected data were entered and analysed with Microsoft Excel. Continues variables were presented as mean while categorical variables were described as percentages.
Results
The total number of samples received in Biochemistry laboratory from April 2014 to September 2015 were 1,85,658. Out of this, OPD samples were 1,35,022 and ICU samples were 50,636. [Table/Fig-3] shows TAT for ICU and OPD samples.
Turn around time (TAT) for ICU samples (N1=50,636) and OPD samples (N2=135022) (N*=1,85,658).
| TAT | ICU (n**=1231) | OPD (n=976) |
|---|
| N1*** (%) | Average number of samples outside TAT (per month) | N2**** (%) | Average number of samples outside TAT (per month) |
|---|
| 30 min-1 hr | 586 (1.16) | 32.56 | 593 (0.44) | 32.94 |
| 1 hr-2 hr | 376 (0.74) | 20.89 | 243 (0.18) | 13.5 |
| 2 hr-5 hr | 153 (0.30) | 8.5 | 95 (0.070) | 5.28 |
| >5 hr | 116 (0.22) | 6.4 | 45 (0.033) | 2.5 |
*N: Total number of samples received in the Biochemistry laboratory (From OPD and ICU);
**n: Samples which were exceeding TAT; ***N1: Total number of ICU samples; ****N2: Total number of OPD samples
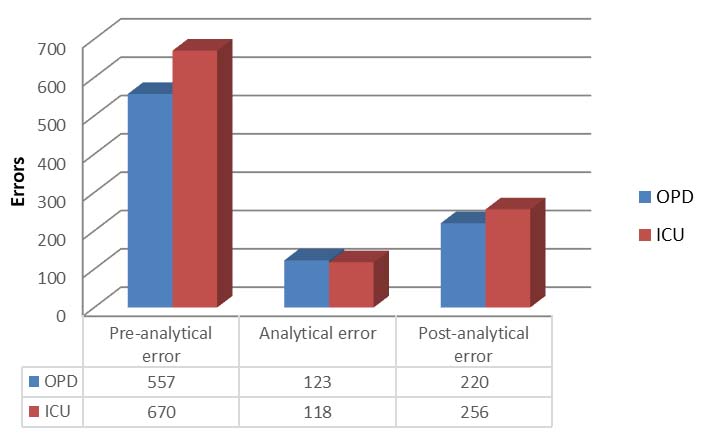
As per [Table/Fig-4], pre-analytical error was observed in 670 ICU samples (1.32%) and it was high percentage value than the post-analytical error. In 557 OPD samples pre-analytical error was observed. In the pre-analytical phase, the most common faults depended on inaccurate procedures for sample collection. In post-analytical phase, 256 errors (0.50%) were observed in ICU.
Errors in different phases which leads to increase TAT.
[Table/Fig-5,6] shows which area/cause contributed to delayed TAT. Haemolysed samples, repeat sample, improper entry and barcode error were some of the causes which cannot be included in any specific area so their percentages have been shown separately. Authors have used same causes for delayed TAT for OPD and ICU patients.
Area/cause which contributed to delayed TAT in ICU.
| Area/Cause | Percentage (n*) |
|---|
| Ward to pneumatic centre | 0.62 (314) |
| Pneumatic centre to laboratory | 0.3 (152) |
| Ward to pneumatic centre to laboratory | 0.16 (81) |
| Late report release | 0.42 (213) |
| Haemolysed | 0.66 (334) |
| Improper entry | 0.005 (02) |
| Repeat sample | 0.25 (127) |
| Over all late (at each stage) | 0.016 (08) |
*n: Number of samples
Area/cause which contributed to delayed TAT in OPD.
| Area/Cause | Percentage (n*) |
|---|
| OPD to pneumatic centre | 0.088 (119) |
| Pneumatic centre to laboratory | 0.16 (216) |
| OPD to pneumatic centre to laboratory | 0.092 (124) |
| Late report release | 0.04 (54) |
| Over all late (at each stage) | 0.17 (230) |
| Pneumatic centre to OPD | 0.07 (95) |
| Laboratory to pneumatic centre | 0.015 (20) |
| Barcode error | 0.011 (16) |
| Late in processing | 0.025 (34) |
| Instrument breakdown | 0.05 (68) |
*n: Number of samples
These results indicate that if time consumed for pre-analytical phase and post-analytical phase is reduced, then the total TAT can be reduced. Time taken in transportation, centrifugation, better sample collection techniques, less haemolysis, faster releasing/dispatching of reports will help in reducing TAT which is clear from above data.
Discussion
The present study is an attempt to find out the frequency of various sample related errors in the clinical biochemistry laboratory. The various factors contributing to the TAT were divided into three phases: pre-analytical, analytical and post-analytical as shown in [Table/Fig-1]. Bhatia P et al., study showed that the major contributor to the error in the result is the pre-analytical phase and post-analytical phase and to reduce the number of errors in both phases, particular attention must be provided to these phases [6].
In present study, TAT is defined as the period between the times of specimen collection to the time of dispatch of report to the patient. In a College of American Pathology (CAP) Q-probe study, 41.1% of laboratories defined emergency TAT as the time taken from receipt of a specimen in the laboratory to reporting of the test results, 27.0% defined it as the time taken from the test order to reporting of the result, and 18.2% defined it as the time taken from collecting a specimen to reporting result [7]. In present study, average of errors in all phases was higher in ICU samples as compare to OPD samples which is evident through [Table/Fig-3,4].
Haemolysed sample: In present study, haemolysis frequency among sample was 0.009% for ICU admitted patients. Lippi G et al., had reported haemolysis frequency of 0.77% and 0.381% for outpatient and inpatient respectively [8]. They report that use of inappropriate container for 0.04% and 0.03% of outpatient and inpatient respectively. Bhuyar BK reported haemolysis was the most common error detected both in OPD and Indoor samples [9]. In a study by Jay DW and Provasek D, the majority of haemolysed samples (>95%) could be attributed to in-vitro processes resulting from incorrect sampling procedure or transport [10]. Most pre-analytical errors occur during the sampling process: up to 60% of these errors are attributable to the sample (Lippi G et al., 2006) [8]. Results obtained through the Spanish Society of Clinical Chemistry (SECQ) Quality Assessment Program for the pre-analytical phase found that the most common pre-analytical errors were samples not received in the laboratory and haemolysed samples [11].
In Begum F study, 3.91% of the samples were detected to be haemolysed and were rejected. Haemolysis was slightly higher in Indoor samples (4.25%) as compared to OPD samples (3.55%) [12].
Pre-analytic errors: The maximum percentage of error in present study was due to late receiving of samples at pneumatic centre from wards which accounted to 0.62% of total pre-analytical delays which was followed by late report release from laboratory. In case of pre-analytical phase, adoption of ideal phlebotomy practices, bar-coding of samples, use of computer-generated requisition slips, and use of plasma and serum separator tubes would reduce the delays occurring as a result of illegible slips and wrong samples collection techniques [4].
As shown in [Table/Fig-5,6], various errors affected TAT of inpatient and outpatients’ samples. In inpatient error are due to haemolysis, these errors occurs when transferring blood through the needle in a syringe with force into tubes, mixing tube too vigorously after collecting the sample. Makubi AN et al., which showed improperly labelled samples to be as high as 82.2% [13]. Noor Haslina MN et al., showed inappropriately labelled specimen in 66.3% and study done by Raji MA et al., showed 31.5% cases to be improperly labelled [14,15]. In our hospital, OPD sample collection centre staff is highly trained to reduce the errors related to sampling. In ICU wards correct procedure is not always followed in collection of sample and transportation, thereby raising the percentage of pre-analytical error in ICU samples [9].
Analytical phase: In OPD samples, only 0.02% errors were due to late processing of samples and 0.05% errors were due to instrument breakdown. These analytical errors were due to late samples received in the laboratory and instrument breakdown. The analytical phase can be reduced by using fully automated machines with higher throughput, adoption of efficient quality control procedures, training of technical staff to handle urgent samples with priority, use of plasma or whole blood samples, automatic dilution when results are above linearity and prompt validation of reports once tests are completed [4].
Post-analytic errors: For outpatient samples, error rate for late release was 0.04% only while it was 0.42% for in patient which is significantly higher than outpatients. Late report releasing is directly affected to treatment of patient. The post-analytical phase can be reduced by adoption of LIS which we are already using. So, errors in this phase were lower compared to other.
Suggestions to improve TAT is shown in [Table/Fig-7] [16].
Corrective and preventive actions (CAPA) for delayed TAT [16].
| Causes for delay | Corrective Actions and Preventive Actions (CAPA) |
|---|
| Pre-analytical errors | Pneumatic system breakdown | Regular maintenance and backup human resources |
| Haemolysed sample | Training of nursing staff and phlebotomist |
| Micro clots (repeat run in cup) | Sensitisation for proper timely entry |
| Wrong time entry (Entry in computer before collecting sample) from nursing staff | Collection and centrifugation training |
| Late from pneumatic centre in busy hours, delay in centrifugation | More manpower and more centrifuge machines |
| Sample late received in laboratory | Increase efficient technicians and number of staff |
| Analytical errors | Machine maintenance | Backup machines for all the tests should be there |
| Calibration requirement | Calibrate new kit even before tests in the previous kit gets over |
| Testing delayed | Assure timely sample receiving in the laboratory and increase in manpower |
| Sample dilution | In suspected cases where higher result above linearity is expected, dilution prior to processing is recommended. |
| Post-analytical errors | Delay in result validation | Proper delta check facility can be added in laboratory information system. |
| Not able to trace the consultant for clinical history | Test requisition should be made with required history related to that test. |
| Manual entry for instruments which are not interfaced | All remaining instrument can be interfaced so data gets automatically transferred |
| Delay in releasing the report | Increase manpower |
Limitation(s)
Study was limited to clinical biochemistry section of the laboratory. In future, multiple departments/ sections could be included in the study.
Conclusion(s)
The vast majority of the mistakes happen in the pre-analytic stage and post-analytic stage. With the help of fully automatic machines, diagnostic blunders have diminished. In spite of automation and other advances in the laboratory, TAT is still the point of discussion between clinicians and laboratory consultants. Clinical consultant should also understand the underlying complexity in sample testing. In this study, pre-analytic errors and post-analytic errors of ICU tests were marginally higher than OPD tests. This study demonstrates that delay in the pre-analytic stage is mainly due to delay in sample transportation. Avoidance of the mistakes identified in pre-analytical stage diminish the general level of blunder, which positively affects the wellbeing result of the patients. TAT minimisation is a constant procedure for any facility. Every laboratory needs to develop wholesome approach for reducing the optimum TAT. Further study can be conducted in the future to see the effect of preventive and corrective actions on the improvement of TAT.
OPD: Out patient department
LDH: Lactate dehydrogenase; Hb: Haemoglobin; CEA: Carcinoembryonic antigen; HCG: Human chorionic gonadotro-pin; PSA: Prostate-specific antigen; TSH: Thyroid stimulating hormone; T3: Triiodothyronine; T4: Tetraiodothyronine; TIBC: Total iron-binding capacity; ADA: Adenosine deaminase
*N: Total number of samples received in the Biochemistry laboratory (From OPD and ICU);
**n: Samples which were exceeding TAT; ***N1: Total number of ICU samples; ****N2: Total number of OPD samples
*n: Number of samples
*n: Number of samples