Since December 2019, reports of an outbreak of “unknown viral pneumonia” have been reported from Wuhan, China. On January 6, 2020 it was confirmed formally that this outbreak is caused by 2019-nCoV which is capable of human-to-human transmission [1]. COVID-19 can lead to acute respiratory distress syndrome similar to MERS coronavirus [2]. Transmission of this virus is mostly via droplets but the other concern is that asymptomatic individuals could also shed the virus and thus contribute to its rapid spread in communities [3].
From the recently published data and radiologic HRCT thorax images of COVID-19 infected cases, it is clearly demonstrated that, this novel-coronavirus causes lung parenchyma destruction, including Ground Glass Opacities (GGOs), interstitial inflammation and extensive consolidation, similar to previously reported coronavirus infected patients [4]. However, some patients with COVID-19 consistently demonstrated no hypoxaemia or respiratory distress during the course of hospitalisation. However, some patients develop sense of difficulty in breathing due to increased airway resistance. The purpose of this study was to establish HRCT thorax as an early predictor of Hypoxaemia in RT-PCR confirmed COVID-19 patients and correlating the HRCT thorax findings (CTSI) with SpO2 levels.
Materials and Methods
This was a prospective longitudinal cohort study of 1000 RT-PCR COVID-19 confirmed patients with COVID-19 pneumonic features on HRCT Chest and had undergone SpO2 monitoring and it was conducted at Odisha COVID hospital, KIMS, Bhubaneswar from 25th August 2020 to 5th October 2020, after getting approval from Institutional Ethics Committee. (KIIT/KIMS/IEC/379/2020). Verbal informed consent was taken from patients as there is chance of disease transmission by taking written consent.
Inclusion criteria: All the RT-PCR confirmed COVID-19 positive patients with features of COVID-19 pneumonia on HRCT thorax and had undergone simultaneous SpO2 monitoring were included in the study.
Exclusion criteria: Patients who have not undergone HRCT thorax and SpO2 monitoring, patients with normal HRCT thorax findings were excluded. Patients younger than six years and pregnant patients were not included in the study.
Protocol of HRCT Thorax imaging and SpO2 measurement
All the HRCT thorax was done by a newly installed dedicated 64 slices Siemen’s ‘Somatom go-UP’ CT scanner with safire technology. Scanning parameters were 1 mm slice thickness, 5 mm gap, 120 kV and 150 mA. All scans were obtained without intravenous contrast material with the patient in the supine position during end-inspiration. HRCT thorax was done within 24 hours of admission. SpO2 was measured by pulse oximeter (Choicemmed MD300C2) at the time of HRCT thorax. Follow-up SpO2 was monitored for five days after scan. HRCT Chest scans were analysed for various findings of COVID-19 pneumonia by skilled radiologists who were blind-folded to SpO2 monitoring results. Based on the findings on HRCT, chest CTSI was assigned. Finally, the data was analysed to assess the potential of HRCT thorax as a possible predictor of Hypoxaemia in COVID-19 patients and to demonstrate the correlation between CTSI and SpO2 levels.
Clinical Data Collection
All relevant epidemiological and clinical data from the hospital records were collected. The patients were divided into asymptomatic and symptomatic patients, based on the clinical data. The symptomatic patients were then categorised into three groups according to the Ministry of Health and Family Welfare, Government of India (MOHFW, GOI) Clinical Management Protocol [5] for COVID-19: Mild, Moderate and Severe, based on the clinical severity. For each clinical category the criteria were as follows: 1) Mild-Presence of constitutional symptoms (fever/cough/sore throat/nasal congestion/headache) with no breathlessness or hypoxia (normal O2 saturation) evidence; 2) Moderate- Presence of features of dyspnoea and/or hypoxia including SpO2 <94% (range 90-94%) in the room air, Respiratory rate more than 24 per minute; 3) Severe- Presence of clinical signs of severe pneumonia plus respiratory rates >30 breaths per minute, SpO2 <90% in room air.
Analysis of HRCT Thorax findings
The CT scans were evaluated for the presence and distribution of lesions such as ground glass opacity, consolidation, sub pleural bands, nodules and any distinct patterns such as septal thickening (reticular pattern/crazy-paving pattern), reverse halo, halo sign, etc. Based on Radiological Society of North America (RSNA) classification, CT results were categorised as Typical (commonly reported unique characteristics of COVID-19), Indeterminate (Non-specific characteristics that can be associated with a number of infections), Atypical (uncommonly reported characteristics) and Negative (No parenchymal opacity) [6].
The CTSI was then determined on the basis of the percentage of the region involved in lobes of both lungs and graded as: Score 1 (<5%), Score 2 (5-25%), Score 3 (26-50%), Score 4 (51-75%) and Score 5 (76-100%). The total CT score is the sum of the individual lobar scores and can range from 0 (No involvement) to 25 (maximum involvement), when all the five lobes show more than 75% involvement [7].
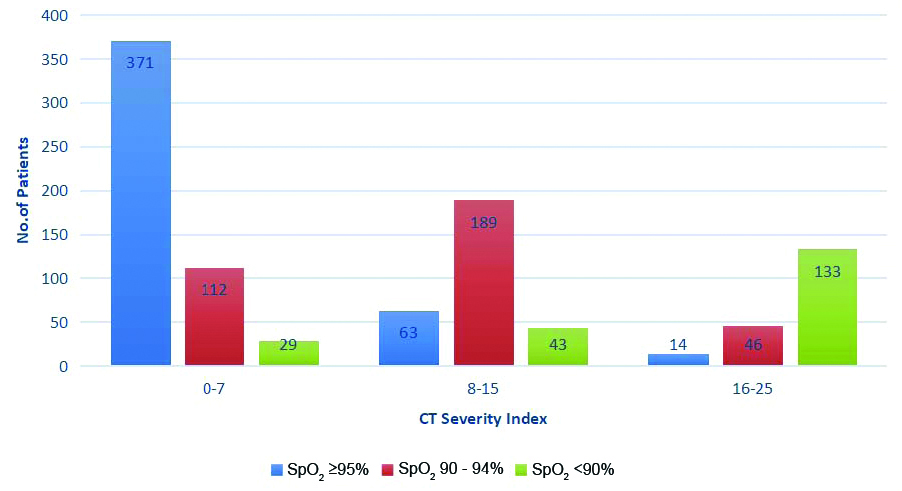
A total of 371 (82.8%) patients with SpO2 >95% were having CTSI between 0-7, similarly 189 (54.4%) patients with SpO2 90-94% were having CTSI between 8-15 and 133 (64.8%) patients with SpO2 <90% were having CTSI between 16-25 So, the patients were categorised into three groups: Category 1 (CTSI 0-7), Category 2 (CTSI 8-15) and Category 3 (CTSI 16-25) for better and prompt identification of clinical severity and their management.
Analysis of SpO2 levels
Hypoxaemia is usually defined in terms of reduced percentage saturation of haemoglobin with oxygen [8]. There is no set oxygen saturation standard, where hypoxaemia occurs. The generally accepted standard is that a normal saturation of less than 95% in resting oxygen is considered abnormal [9]. “Choicemmed MD300C2 Pulse Oximeter” is used to measure patients SpO2 levels at the time of HRCT thorax and for follow-up SpO2 levels, five days after scan. Based on the obtained SpO2 values, the patients were categorised into clinical categories suggested by MOHFW (GOI) in Clinical Management Protocol for COVID-19: 1) Asymptomatic/Mild: Patients having SpO2 levels ≥95%; 2) Moderate: Patients having SpO2 levels in Range of 90- 94%; 3) Severe: Patients having SpO2 levels<90%. Patients were sub-categorised further based on this criterion [Table/Fig-1,2,3,4,5 and 6].
Comparison of CTSI with Clinical severity and SpO2 levels at the time of scan and on follow-up.
| CTSI categories | No. of patients (Out of 1000) | Clinical grade | SpO2 grading | No. of patients | % | Patients who developed hypoxaemia on follow-up | Percentage of patients who developed hypoxaemia on follow-up |
|---|
| 0-7 | 512 | Asym and mild | >95 | 371 | 72.46 | 42 | 11.32 |
| | Moderate | 90-94 | 112 | 21.87 | -* | - |
| | Severe | <90 | 29 | 5.66 | -* | - |
| 8-15 | 295 | Asym and mild | >95 | 63 | 21.35 | 10 | 15.87 |
| | Moderate | 90-94 | 189 | 64.06 | -* | - |
| | Severe | <90 | 43 | 14.57 | -* | - |
| 16-25 | 193 | Asym and mild | >95 | 14 | 7.21 | 2 | 14.28 |
| | Moderate | 90-94 | 46 | 23.71 | -* | - |
| | Severe | <90 | 133 | 69 | -* | - |
*- Not included in follow-up study as these patients were already hypoxemic at the time of admission.
CTSI: Computed tomography severity index; Ts: Time of scan; Asym: Asymptomatic
Comparison of Computed Tomography (CT) pattern with CTSI.
| CT Severity Index (CTSI) |
|---|
| CT pattern | 0-7 | 8-15 | 16-25 | Total patients |
|---|
| Typical | 312 | 268 | 189 | 769 |
| Atypical | 55 | - | - | 55 |
| Indeterminate | 145 | 27 | 4 | 176 |
| Total | 512 | 295 | 193 | 1000 |
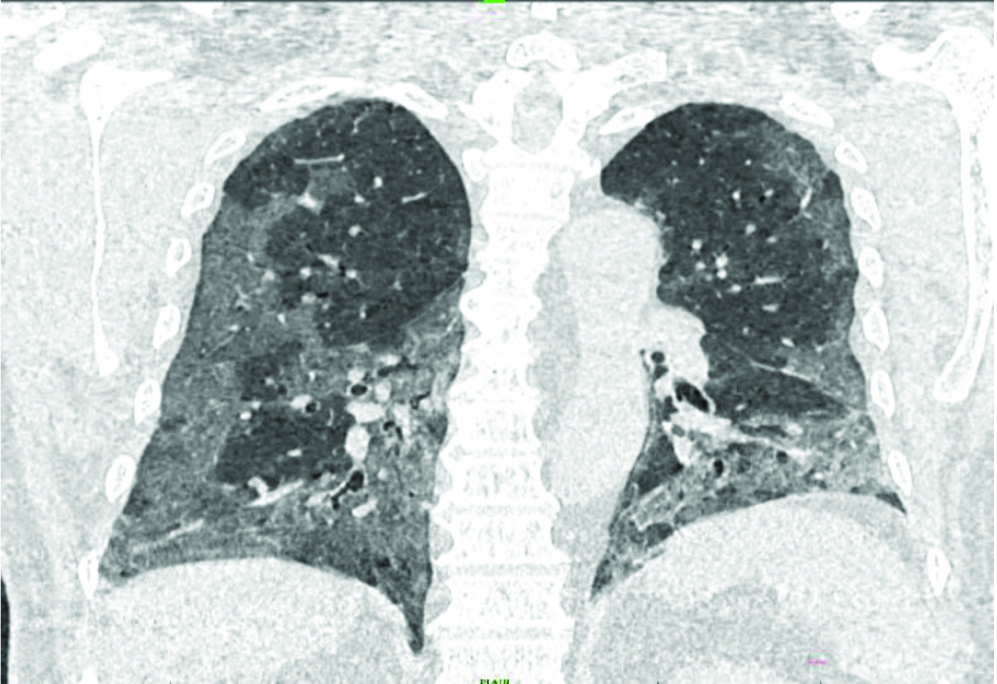
Coronal section of HRCT chest showing diffuse, peripheral, sub-pleural Ground Glass Opacities (GGO) in bilateral lung fields predominantly in lower zones.
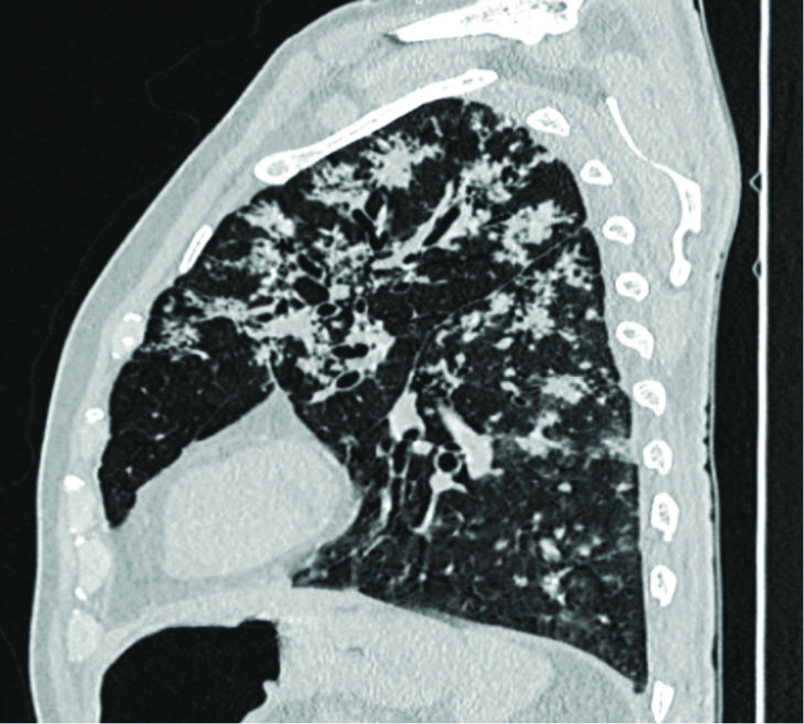
Sagittal section of HRCT chest showing multiple tree in bud nodules scattered in lung parenchyma predominantly in bilateral upper zones.
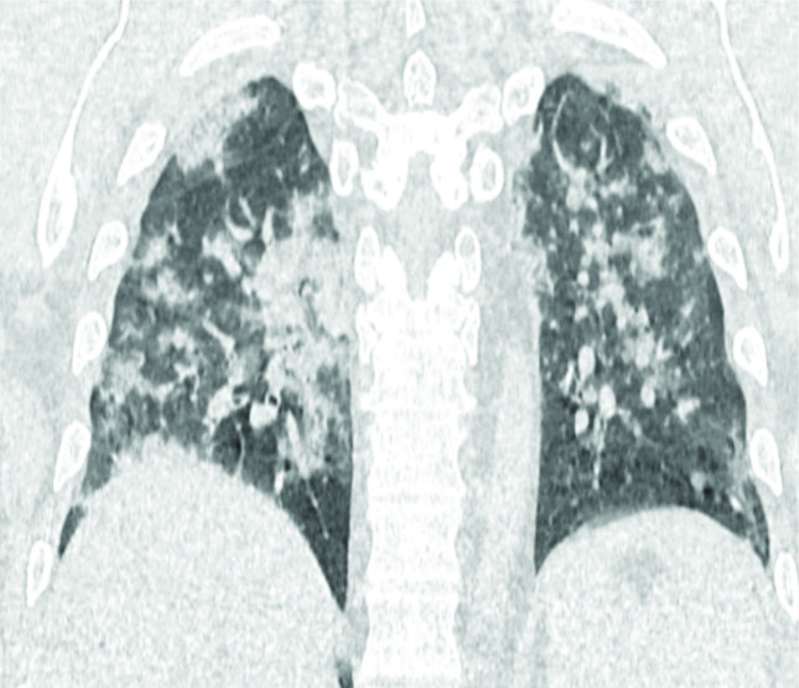
Coronal section of HRCT chest showing diffuse consolidation in bilateral lung fields.
Comparison of CTSI with SpO2 levels.
Statistical Analysis
The statistical analysis was done using Statistical Package For The Social Sciences (SPSS) (version 21). Categorical variables were represented as percentage while the mean±standard deviation was used to represent continuous numerical variables. Chi-square test was used for categorical variables; Pearson’s correlation test was used for continuous variables and a two-tailed p-value was calculated. The p-value less than 0.05 was considered to be statistically significant.
Results
Serial data were collected, evaluated, and interpreted from 1000 COVID-19 positive patients who qualified the inclusion criteria.
Demographics
The age of patients ranged from 8 to 97 years and mean age was 42.64±14.93 years. Most of the patients i.e., 512 (51.2%) were in the 40-60 years age group. Majority of patients 817 (81.7%) admitted were males.
Clinical Presentation and Severity
Among total symptomatic patients (771), majority were presented with fever 546 (70.81%), cough 392 (50.84%), sore throat 349 (45.39%), dyspnoea 149 (19.45%). Less commonly, presentations were diarrhoea, vomiting and headache, myalgia. One-third patients were having moderate clinical severity (347/1000; 34.7%) and approximately one-fourth were having ‘severe’ grade clinical severity (205/1000; 20.5%).
CT Pattern, CTSI and SpO2 Analysis
Most of the patients (512/1000; 51.2%) were in CTSI Category 1 (score 0-7). CTSI Category 2 (score 8-15) includes 295 patients (29.5%) and Category 3 (score 16-25) includes 193 patients (19.4%) [Table/Fig-1]. Out of the total 1000 patients, 769 patients (76.9%) had Typical CT pattern of COVID-19 and while 55 (5.5%) and 176 (17.6%) patients had Atypical and Indeterminate CT patterns, respectively [Table/Fig-2,3,4 and 5]. The presence of pleural effusion, pleural thickening and mediastinal lymphadenopathy were noted.
Major bulk of patients in CTSI Category 1 was made by asymptomatic and mildly symptomatic patients having SpO2 values ≥ 95% (371/512; 72.46%). A 21.87% patients (112/512) in this category were with moderate clinical severity and 5.66% patients (29/512) had ‘severe’ clinical severity. In CTSI Category 2, 189 (64.06%) patients were with moderate clinical severity and SpO2 value range between 90-94%. In CTSI Category 3, majority of 133 patients (69%) were with ‘severe’ clinical severity and SpO2 levels <90%. Mean CTSI in this study population was 8.58±6.5. Mean SpO2 values in CTSI Category 1, 2 and 3 were 95.62±3.56; 92.01±4.62; and 87.83±4.92, respectively. In this study, authors tried to statistically correlate the CTSI of patients with their SpO2 levels at the time of initial scan. Statistical correlation between CTSI and SpO2 levels at the time of initial scan was significant (Pearson’s correlation coefficient (r)=-0.261 and p-value <0.01). Negative Pearson’s correlation coefficient suggest the fall in patients SpO2 levels with increase in CTSI.
Total 448 (44.8%) out of 1000 patients included in this study were having normal SpO2 values at the time of HRCT thorax and rest patients were already hypoxemic (i.e., SpO2 level<95%). Out of these 448 patients, 371 (82.81%) patients were in CTSI Category 1 and about 63 (14.06%), 14 (3.21%) patients were in CTSI Category 2 and 3 respectively. Number of patients who developed hypoxaemia (SpO2<95%) on follow-up SpO2 measurements in CTSI Category 1, 2 and 3 were 42 (11.32%), 10 (15.87%) and 2 (14.28%), respectively i.e., only 54 patients out of 448 patients with normal SpO2 levels developed hypoxaemia on follow-up. The association between CTSI and development of hypoxaemia based on follow-up SpO2 levels was statistically found to be insignificant (chi-square value=1.21, degree of freedom (d.f.) 2 and p-value=0.570).
Discussion
In the present study, an attempt was made to correlate the CTSI with SpO2 values and to establish the HRCT thorax as early predictor for hypoxaemia. A total of RT-PCR confirmed 1000 patients were studied in the study. More than three-fourth (81.7%) of patients were males which was similar to previous studies [10,11]. The present study postulate this preponderance owing to the admission of large proportion of male migrant workers who either had a travel history or incidental exposure. Women’s reduced susceptibility to viral infections could be attributed to the protection with X chromosomes and sex hormones, which play a crucial role in innate and adaptive immunity [12]. Most of the patients were asymptomatic or had milder symptoms. This study has shown that the most common symptoms include fever (70.81%), cough (50.84%) and sore throat (45.39%) which was similar to previous studies [13,14]. All these symptoms are similar to those of other respiratory viral diseases. However, in relatively fewer symptomatic patients the presentation of dyspnoea, nausea, vomiting, diarrhoea and myalgia were also seen.
Nearly three-quarters (769/1000; 76.9%) of radiologically positive patients in the present study had typical CT chest image pattern which included GGO in bilateral, peripheral and lower lobe predominance opacity distribution. Rest one-fourth patients shows Indeterminate (176/1000; 17.6%) and atypical (55/1000; 5.5%) CT pattern. This result in this study was in concordance with previous studies conducted by Simpson S et al., and de Jaegere TM et al., [6,15]. Clinical severity of COVID-19 patients was correlated with CTSI. Mean CTSI in this study population was 8.58±6.5. Among all asymptomatic and mildly symptomatic patients (512/1000), about 72.46% (371/512) patients exhibited CTSI Category 1 (0-7). Among patients with moderate clinical severity (347/1000), more than half patients (189/347; 54.46%) exhibited CTSI Category 2 (8-15) and out of patients with ‘severe’ clinical severity (205/1000), about two-third patients (133/205; 64.87%) had CTSI Category 3 (16-25). These findings were in concordance with research findings of Francone M et al., [16]. They clearly stated that CT score was significantly higher in the severe CT category (17.4±3.1) than the mild CT category (8.7±4) [16].
Majority of patients in CTSI category 1, 2 and 3 were having SpO2 levels ≥95%, 90-94% and <90%, respectively. Statistical correlation between CTSI and SpO2 levels at the time of initial scan was significant (Pearson’s correlation coefficient (r)=-0.261 and p-value <0.01). Negative Pearson’s correlation coefficient suggest the fall in patients SpO2 levels with increase in CTSI. Similar negative correlation coefficient between CT stage and SpO2 levels was found by Wang K et al., [17].
Limitation(s)
This study was conducted at a single centre among limited number of patients. Confounding factors like co-morbidities and immune status of the patients were not taken into consideration in this study.
Conclusion(s)
In present study a negative correlation was established between CTSI and initial SpO2 levels. However, the association between CTSI and development of hypoxaemia on follow-up SpO2 monitoring in patients having normal oxygen saturation initially was found to be not significant. So, HRCT thorax cannot be relied upon as an early predictor of hypoxaemia.
*- Not included in follow-up study as these patients were already hypoxemic at the time of admission.
CTSI: Computed tomography severity index; Ts: Time of scan; Asym: Asymptomatic