Inborn Errors of Metabolism (IEMs) encompass large class of genetic disorders arising as a result of gene irregularities, Most of them are monogenic disorders, i.e., defect in a single gene encoding for the enzymes, structural protein or transporter molecules, which in-turn leads to the accumulation of toxic intermediate metabolites [1,2]. While Individually scarce, there cumulative incidence is significant and hence requires a considerable critical and immediate attention [3].
NBS is one of such preventive healthcare approach in which the neonates are screened for evidence of diseases for which the pre-eminent symptoms may not yet be apparent and a timely intervention can prevent irreversible damages and even death [4]. Being a significant contributor in neonatal morbidity and mortality on delayed diagnosis, further add for a prompt recognition and management [5].
Methylmalonic Aciduria (MMA) including deficiency of key enzymes like methylmalonyl-CoA mutase, methylmalonyl-CoA epimerase and deficiency of cobalamine(Cbl) A,B,C,D,E and J are rare but potentially severe autosomal recessive disorder of propionate catabolism [6]. The worldwide incidence of MMA ranges between 1:50,000 and 1:100,000 [7-11]. Clinical spectrum of the disease is diverse, varying from mild to life threatening and is usually characterised by symptoms like vomiting, hypotonic, developmental delay, lethargy, hepatomegaly, feeing difficulty, intellectual disability, chronic kidney disease, pancreatitis etc., [12-15].
Abnormal levels of propionylcarnitine (C3) in Dried Blood Spot (DBS) of newborns is often suggestive of Propionic Academia (PA) or MMA or cobalamin deficiency [16,17]. However, the C3 being a non-pathognomonic marker for the disorder, further limit its applicability in the conclusive diagnosis of MMA. Moreover, the concentration of propionylcarnitine is affected and unaffected neonates often overlap, especially in premature infants giving rise to a high false positive rate [18]. Introduction of Analyte ratio such as Propionylcarnitine/Acetylcarnitine (C3/C2) and Propionylcarnitine/Free carnitine (C3/C0) increased specificity but fail to differentiate between PA, methylmalonic aciduria and B12 deficiency. Hence, the aim of this study is to find a new method for the second tier estimation of MMA in DBS of neonates.
Materials and Methods
The retrospective study included data collected over a period of two years (November 2015 to November 2017) at Pediatrics Research and Genetic Lab, Department of Pediatrics, Maulana Azad Medical College and associated Lok Nayak Hospital, New Delhi. As per protocol, the sample analysis was performed within two months of collection. The stability study took two month. However, the final result analysis including statistical analysis was performed by Jan 2020. The study institute approved the research vide letter number F.No./11/IEC/MAMC/2011/317.
Inclusion and Exclusion criteria: Non-premature neonates with no history of blood transfusion or parenteral nutrition were included. All the previously diagnosed neonates, on antibiotics and premature neonates with history of blood transfusion were excluded from the study. The heel prick sample of all neonates was collected within 24-48 hours of birth after the first feed. Two thousand DBS yielding normal C3(<9 μmol/L),C3/C2 (<0.77 μmol/L) and C3/C0 (< 0.35 μmol/L) were used to determine the normative range for MMA.
Reagents and consumables- Methylmalonic acid and d3-Methylmalonic acid (d3- MMA) was Methylmalonic acid purchased from Sigma Aldrich (St. Louis, MO, USA) and Cambridge Isotope Laboratories (USA), respectively. HPLC grade acetonitrile, methanol and water were obtained from JT Baker (Avanator Performance materials, PA, USA). Formic acid was purchased from Thermo Fischer Scientific (PA, USA). The Low and High-level blood controls were prepared in-house taken into account the haematocrit adjustment to 50±1%.
Equipment
MMA analysis and quantification was performed using AbSciex 3200 MD QTRAP® LC/MS/MS System (USA) with Turbo V™Ion Source and triple quadrupole mass spectrometer connected to a HPLC system FLEXER™ LC System (PerkinElmer). Other equipment’s used in the sample preparation included, Tarson 3020 Spinix vortex shaker, TriNest™ Incubator shaker instrument and Panthera-Puncher™ 9 Instrument (PerkinElmer, Finland).
Chromatographic Conditions
Chromatographic and mass detection system was performed using AbSciex 3200 MD QTRAP® LC/MS/MS system. The system was controlled using Analyst® MD (1.6.1) software that runs under Windows 10 Operating system. Analyte separation was based on the FIA under the mobile phase (methanol: water: formic acid, 80/20/0.5%, v/v). The ion spray voltage of 5500V and desolvation line temperature of 400°C was used during the analysis. The de-clustering potential (DP= -10eV); the entrance potential (EP-4 eV); collision energy (CE= -12.11eV); cell entrance potential (CEP= -16.0eV) and cell exit potential (CXP= -3eV) were optimised using manual infusion of a pure standard and isotopically labeled standard [Table/Fig-1].
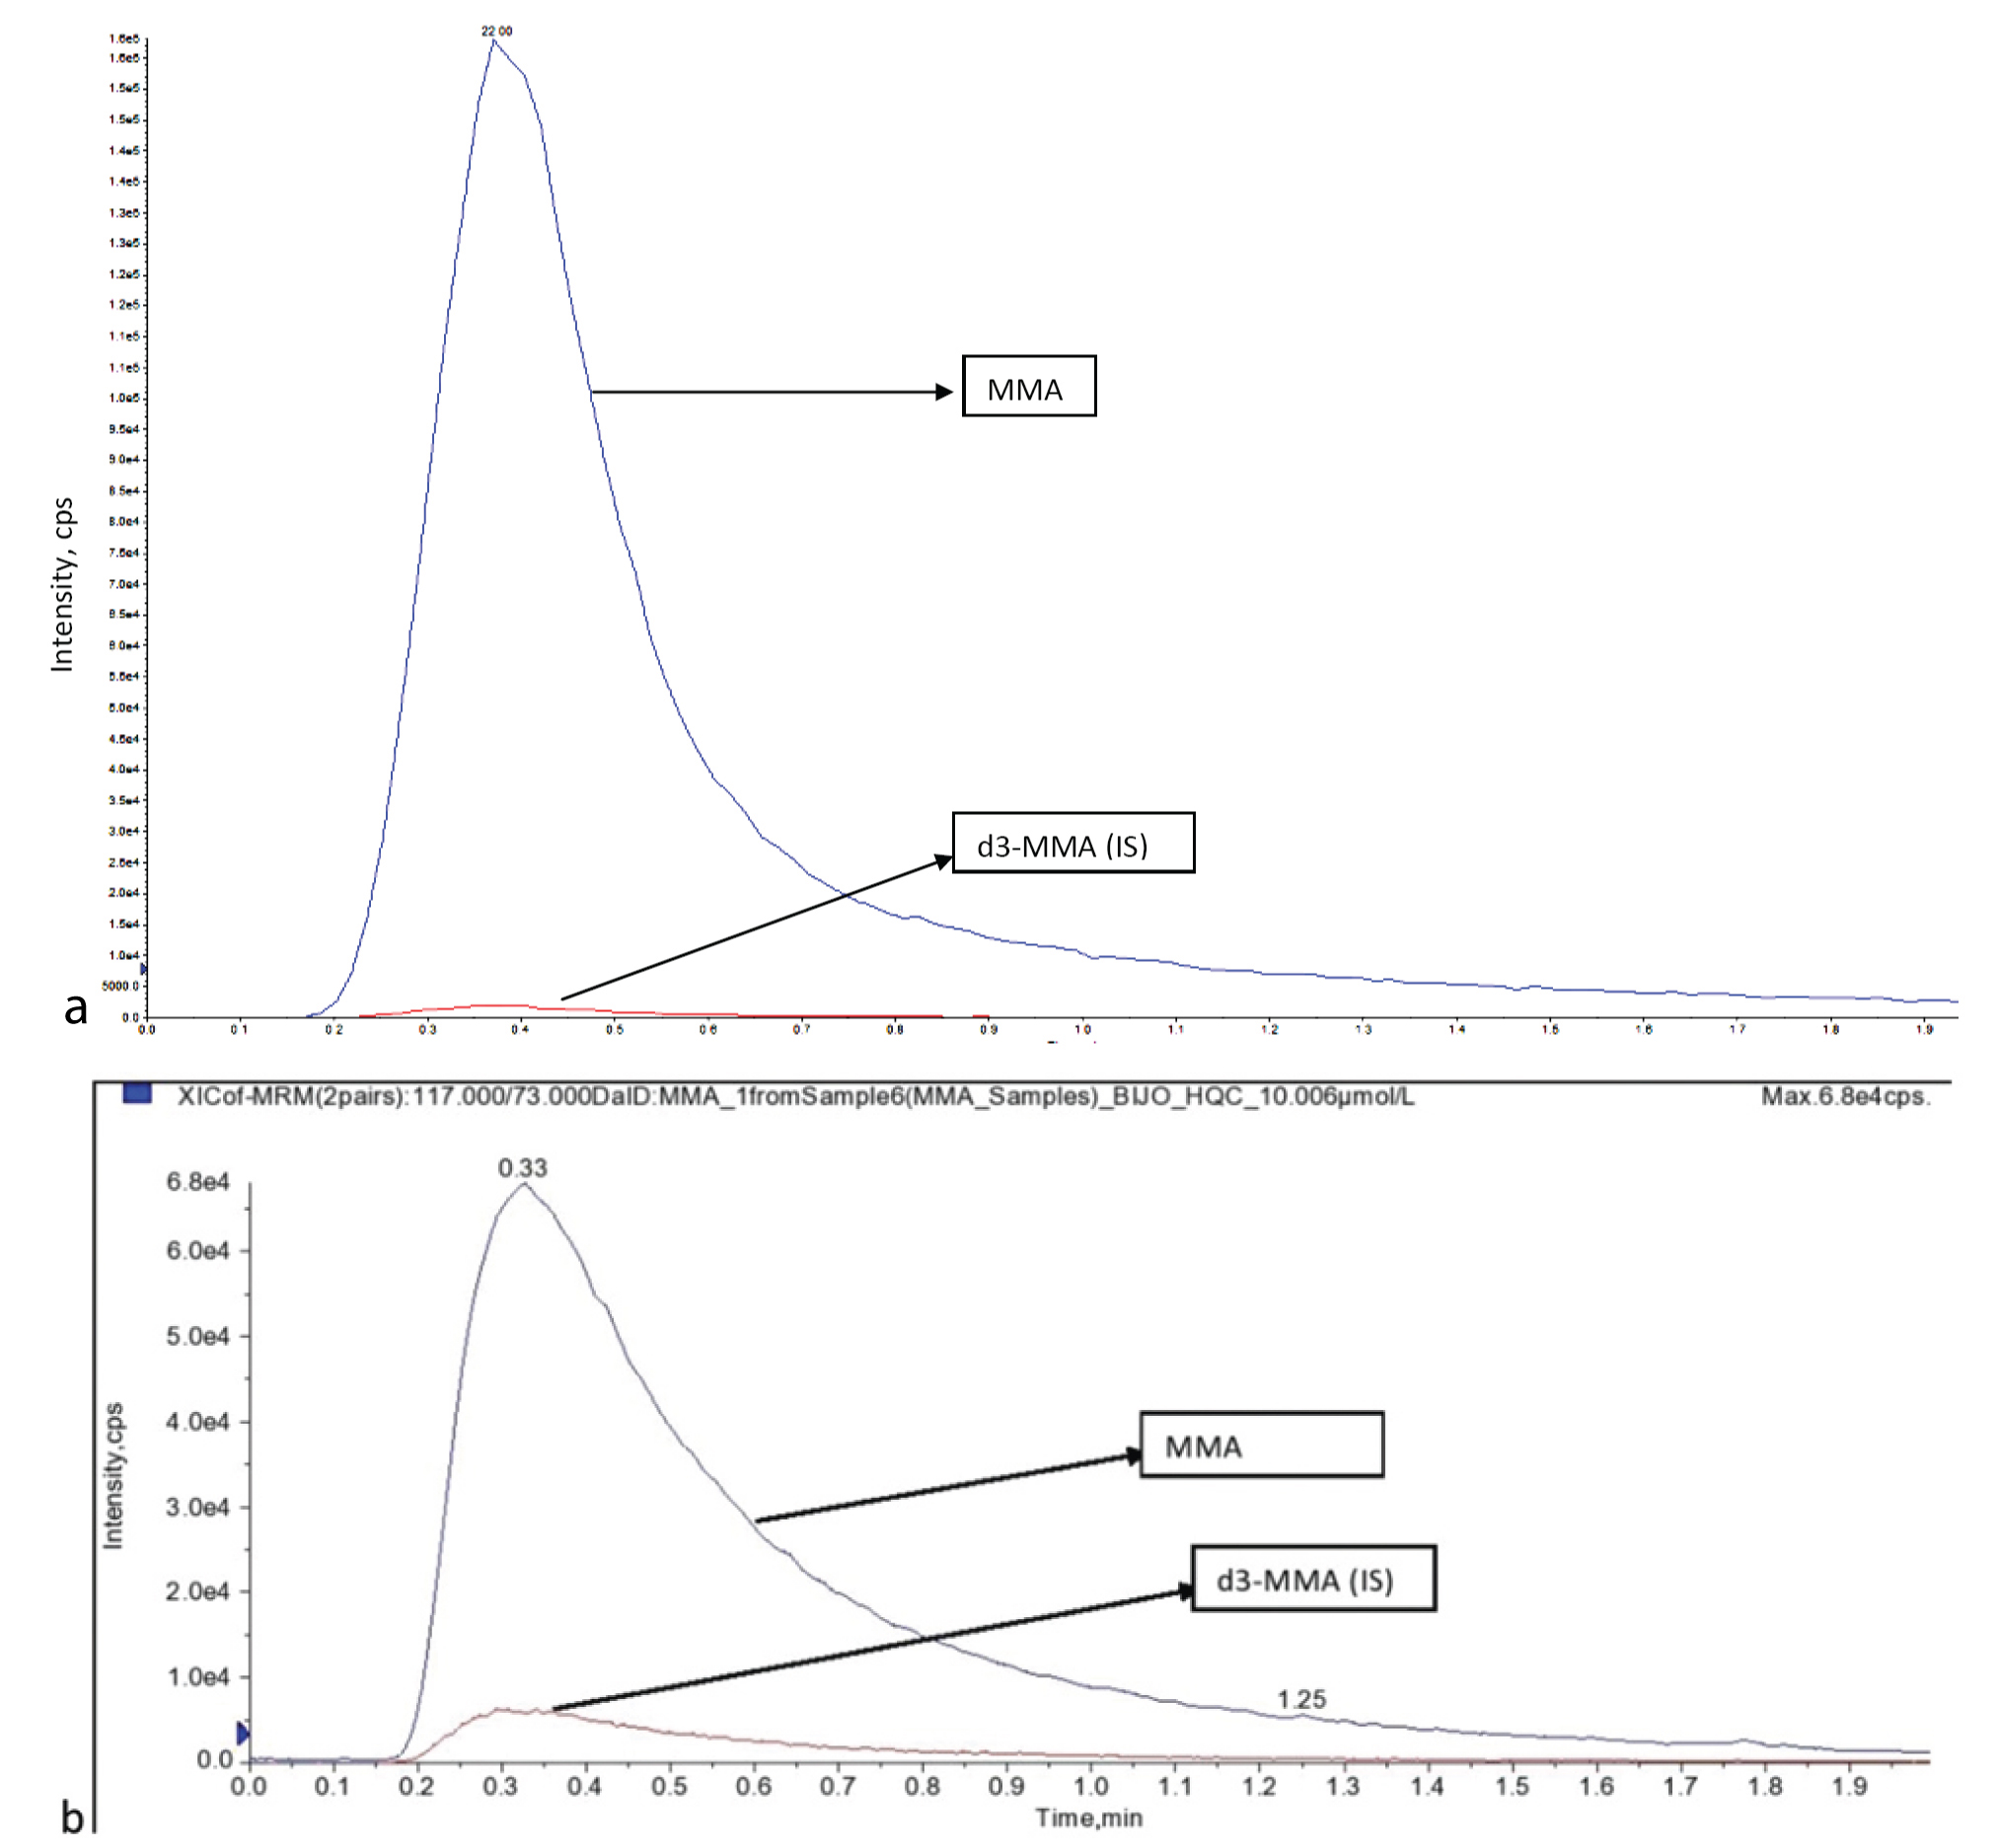
a) Chromatograms MMA and d3-MMA LQC- 2.006 μmol/L; b) MMA and d3 MMA at HQC- 10.006 μmol/L.
MMA: Methylmalonic acid; LQC: Low quality control; HQC: High quality control
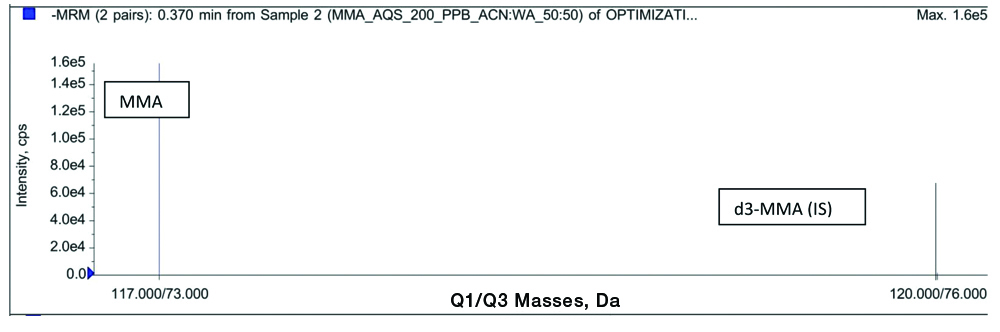
The mass spectrometer was operated in negative ion electrospray spectrometry with mass between 200-500 m/z. The scan mass spectra and product ion mass spectra of analyte and internal standard is as shown in [Table/Fig-2].
Full-scan product ion spectra of methylmalonic acid (11773) and deuterated methylmalonic acid (d3-MMA)(120→76).
Preparation of Stock Solution and Calibration Standards
Standard stock solution of methylmalonic acid (≈400 μg/mL) and for MMA IS (≈400 μg/mL) was prepared in diluent (Acetonitrile: water, 50/50, v/v). Multiple levels of DBS calibrators (0, 0.5,1.0,2.0,5,0,10.0,20.0 μmol/L) and Low Quality Control (LQC=2.0 μmol/L) and High Quality Control (HQC=10.0 μmol/L) Quality control (QC≈2.0 and 10.0 μmol/L) was prepared, which covered the analytical measurement range for MMA. The spiked blood (50 μL) was spotted on the filter paper and dried for three hours at room temperature. Upon drying it was transferred into a zip-lock bag with silica gel desiccator and humidity indicator. It was stored at -20°C until analysed. The peak intensity of MMA was plotted against the corresponding concentration of the calibrator standards.
Assay validation: CLSI (Clinical and Laboratory Standards Institute) guideline were followed for the validation of the developed method [19].
Linearity: Linearity was assessed by analysing at least six non-zero concentrations from 0.5 to 20 μmol/L. The curves were constructed from a linear weight (1/X2) least squares regression obtained by plotting peak intensity ratios of the analyte to Internal Standard against the nominal concentration of analyte. The calculation was based on the peak area ratio of analyte versus the area of internal standard. The concentration of the analyte were calculated from calibration curve (y= mx+c; where, y is the peak ratio).
Precision and accuracy were determined by replicated analysis of two quality control levels (LQC & HQC) on three different batches, two on the same day and one on the next day. For intraday 12 replicates and for interday 18 replicates were studied over a period of two days and the standard deviation, accuracy, precision and Coefficient of Variation (CV) was calculated.
Stability of the prepared controls was determined at different temperature (Freshly prepared, 2-8°C and −20°C) at an interval of 10 days for over two months.
Extraction procedure: Two blood spots each of 3.2 mm diameter was punched out from the MMA spiked blood spot using a Panthera puncher and was extracted with 150 μL of extraction solution containing a mixture of acetonitrile, water and formic acid (70/30/0.5%, v/v). The samples were vortexed for 15 minutes followed by 10 minutes centrifugation at 2500 rpm. The supernatant (100 μL) was transferred into microtiter plate and submitted for injection and analysis.
The extraction efficiency of analytical method was determined at two QC concentrations (2.0 and 10.0 μmol/L), respectively, by comparing the peak area of extracted samples with area of aqueous samples.
Statistical Analysis
Statistical analysis was performed using SPSS version 26. Reference range values for MMA was determined using n=2000 random samples from newborns with normal propionylcarnitine value and four true positive samples. The descriptive analysis included mean, median, standard deviation and coefficient of variation. The 0.5th and 99.5th percentile of the total underlying sample distribution value was taken as the reference range.
Results
Linearity: The linearity was tested from 0.5 μmol/L to 20.0 μmol/L. Three each set of linearity concentration were injected and analysed over their different run. The calibration plot showed that the increasing amount of standard spiked DBS displayed a linear relationship with the analyte response detected and with all slopes and linear regression coefficient values are very close to 1 i.e., (greater than 0.98). DBS calibrators of MMA at six different concentrations showed detectable and reproducible signals with a linear response and R2 of 0.98 and percentage accuracy ranged between 96.1% and 107.6% [Table/Fig-3].
| Linearity level | Level-1 n=6 | Level-2 n=6 | Level-3 n=6 | Level-4 n=6 | Level-5 n=6 | Level-6 n=6 | Regression |
|---|
| Nominal Conc. (μmol/L) | 0.500 | 1.0 | 2.0 | 5.0 | 10.0 | 20.0 | - |
| Batch-1 | 0.425 | 0.965 | 1.868 | 5.115 | 11.236 | 19.452 | 0.9936 |
| Batch-2 | 0.521 | 0.865 | 2.223 | 4.923 | 8.562 | 19.526 | 0.9951 |
| Batch-3 | 0.552 | 1.236 | 2.362 | 5.269 | 10.256 | 18.695 | 0.9977 |
| Average | 0.499 | 1.022 | 2.151 | 5.102 | 10.018 | 19.224 | |
| Accuracy (%) | 99.9 | 102.2 | 107.6 | 102.0 | 100.2 | 96.1 | |
Precision and accuracy: The precision of MMA assay was checked during the validation process by determining MMA levels in one false positive sample and in one negative control sample in the same batch (intra-assay) and in two different batches (inter-assay). The percentage coefficient of variation showed no significant difference and remained under the acceptable below 15%. Six replicates of each of the two controls were extracted and analysed against a standard calibration curve. This was repeated in three batch of analytical run [Table/Fig-4]- two on the same day to determine intraday assay precision; and one on the subsequent day to study interday precision. The details of Interday and Intraday precision and accuracy are as summarised in [Table/Fig-5].
Batch wise Linearity study.
| Precision and accuracy | Conc. levels | 1 | 2 | 3 | 4 | 5 | 6 | Avg. Conc. | Std. Dev | (%) CV | (%) Avg. Accuracy |
|---|
| Batch-1n=6 | LQC Conc.(2.005 μmol/L) | 1.865 | 2.225 | 2.125 | 1.956 | 2.321 | 2.015 | 2.0845 | 0.171 | 8.2 | 104.0 |
| HQC Conc. (10.006 μmol/L) | 9.658 | 10.458 | 10.569 | 10.256 | 10.254 | 11.235 | 10.405 | 0.514 | 4.9 | 104.0 |
| Batch-2n=6 | LQC Conc. (2.005 μmol/L) | 2.145 | 2.458 | 1.965 | 1.843 | 2.214 | 2.224 | 2.1415 | 0.216 | 10.1 | 106.8 |
| HQC Conc. (10.006 μmol/L) | 10.226 | 10.258 | 11.326 | 11.423 | 10.442 | 11.237 | 10.8187 | 0.567 | 5.2 | 108.1 |
| Batch-3n=6 | LQC Conc. (2.005 μmol/L) | 2.042 | 2.223 | 2.652 | 1.923 | 1.995 | 2.014 | 2.1415 | 0.269 | 12.6 | 106.8 |
| HQC Conc. (10.006 μmol/L) | 11.425 | 10.256 | 10.895 | 10.226 | 10.849 | 11.241 | 10.8153 | 0.494 | 4.6 | 108.1 |
LQC: Low quality control; HQC: High quality control; CV: Coefficient of variation
Intraday and Interday variability study.
| Analyte | Expected concentration | Intraday variability | Interday variability |
|---|
| | Avg. Conc.(μmol/L) | Std. Dev. | CV (%) | Average accuracy (%) | Avg. Conc. (μmol/L) | Std. Dev. | CV(%) | Average accuracy (%) |
|---|
| Methylmalonic acid | QC Low- 2.005 μmol/L | 2.1130 | 0.188 | 8.90 | 105.4 | 2.1225 | 0.211 | 9.93 | 105.9 |
| QC High- 10.006 μmol/L | 10.6118 | 0.559 | 5.27 | 106.1 | 10.6797 | 0.533 | 4.99 | 106.7 |
Storage stability: The stability of MMA in DBS was determined for over two month at an interval of 10 days with freshly prepared samples and samples stored at 2-8°C and −20°±5°C. Six replicates of LQC and HQC each of fresh, 2-8°C and -20°C stored samples were quantified against the calibration curve standards of concentration range equivalent to that used for the calculation of precision and accuracy. Looking at the [Table/Fig-6], it is apparent that the sample group stored at -20°C and freshly prepared samples reported significantly more stability as compared with the sample group stored at 2-8°C making it most preferred option for long time sample storage.
Batch-wise linearity study (storage stability).
| Controls | Fresh quality control (n=6) | 2-8°C Stored quality control (n=6) | -20°C Stored quality control (n=6) |
|---|
| Nominal Conc. (μmol/L) | LQC Conc. (2.012 μmol/L) | HQC Conc. (10.026 μmol/L) | LQC Conc. (2.005 μmol/L) | HQC Conc. (10.006μmol/L) | LQC Conc. (2.005 μmol/L) | HQC Conc. (10.006μmol/L) |
|---|
| 1 | 2.156 | 10.226 | 1.958 | 9.458 | 2.105 | 10.256 |
| 2 | 2.228 | 10.452 | 1.936 | 9.245 | 2.143 | 10.895 |
| 3 | 2.015 | 10.892 | 1.856 | 9.863 | 2.003 | 10.426 |
| 4 | 1.996 | 10.268 | 1.926 | 10.256 | 1.952 | 10.889 |
| 5 | 2.105 | 10.362 | 2.125 | 9.115 | 2.236 | 10.208 |
| 6 | 2.228 | 10.102 | 1.759 | 9.853 | 2.114 | 10.119 |
| Avg. Conc. | 2.1213 | 10.3837 | 1.9267 | 9.6317 | 2.0922 | 10.4655 |
| Std. Dev. | 0.101 | 0.276 | 0.121 | 0.433 | 0.101 | 0.345 |
| CV (%) | 4.77 | 2.66 | 6.29 | 4.50 | 4.85 | 3.30 |
| Avg. Accuracy (%) | 105.4 | 103.6 | 96.1 | 96.3 | 104.3 | 104.67 |
Recovery: Six (LQC and HQC) samples were extracted as per the extraction procedure described in the methodology. The area response of MMA and Internal standard of extracted DBS sample were compared against area response of MMA from extracted sample and MMA in aqueous sample. The results obtained from the recovery analysis is as displayed in [Table/Fig-7].
| Controls | LQC Response (cps) n=6 | HQC Response (cps) (n=6) |
|---|
| Nominal Conc. (μmol/L) | MMA extracted(Intensity, cps) | MMA aqueous(Intensity, cps) | MMA extracted(Intensity, cps) | MMA aqueous(Intensity, cps) |
|---|
| 1 | 40895 | 54189 | 195685 | 285147 |
| 2 | 38956 | 55236 | 215826 | 295641 |
| 3 | 42158 | 52314 | 235162 | 285493 |
| 4 | 40258 | 52896 | 214892 | 224896 |
| 5 | 41326 | 48715 | 196754 | 304289 |
| 6 | 45628 | 55395 | 223579 | 294618 |
| Avg. Conc. | 41536.83 | 53124.17 | 213649.67 | 281680.67 |
| Std. Dev. | 2274.907 | 2485.943 | 15335.219 | 28720.898 |
| CV (%) | 5.48 | 54189 | 195685 | 10.20 |
| Avg. Accuracy (%) | 78.19 | 75.85 |
Discussion
The advent of tandem mass spectrometry in NBS has greatly amplified the diagnostic investigation and therapeutic interventions in affected individual and has contributed enormously in the improved patient outcome [20-22]. The lack of a pathognomonic marker in the screening for methylmalonic acid resulted in large number of false positive results [23]. Increment in the false positivity not only affects the screening machinery but leads to an added stress among the parents. It was proved by many earlier studies, that false positive results cause an elevation in the parental anxiety and also involve a wastage of useful resources in the follow-up and recall etc., [24-26]. The use of propionylcarnitine for the detection of disorder like MMA produced an erroneous result, especially when the elevation is not disease specific, so this emphasised us to develop the FIA method for the estimation of methylmalonic acid as a second-tier testing in newborns.
DBS have been developed as a second-tier testing for the diagnosis of methylmalonic aciduria. la Marca G et al., proposed a method which is capable of monitoring MMA in NBS DBS samples. However, the required sensitivity for diagnosis of B-12 deficiency was lacking [27]. The index study is in corroboration with the findings of Turgeon CT et al., who developed a method for MMA quantification, by derivatisation of MMA to butyl esters in healthy women samples [28]. Hence, furthermore, the method may be suitable for application in NBS for tier test confirmation of MMA reducing the false positive result from routinely applied methods.
In the current scenario, quantification for methylmalonic acid using the same instrumental set-up and the same blood spot used for the primary NBS was a practically possible tactics to differentially identify MMA. The major challenge in this method is the presence of Succinic Acid (SA) as an isomeric from of MMA and hence to quantify MMA separately often required a chromatographic separation of MMA and SA [29]. However, for chromatographic separation, a column is required and which inturn add to the screening cost. In developed countries this may be possible. But, in resource-constrained set-up like ours with a higher birth rate of 18.2 births/1,000 population [30] and 900 births/day in Delhi, of which one or two babies have metabolic defects [31-33]. In concurrence to the study by Turgeon CT et al., it may be proposed that any elevation in MMA could be suggestive of MMA in the second tier screening [28]. Only from the patients who were presumptive positive in second tier screening, a urine sample was collected for urinary confirmation by Gas Chromatography-Mass Spectrometry (GC/MS) and a blood sample for molecular confirmation [34]. The molecular confirmation is considered a must for the accurate diagnosis, clarification, re-assurance, genetic counseling and potential prenatal screening.
Limitation(s)
The primary limitation of this experimental approach is that, the study did not quantitate and differentiate SA in the DBS to eliminate its interference. Secondly, the study use restricted to convenience sample from 23 hospitals who were part of DST-SERB initiative, hence tends to miss non-institutional and other hospital deliveries. Therefore, the applicability of these results to wider population needed a cross-national study.
Conclusion(s)
Newborn screening has been established as important tool to detect IEM and to curb the incidence of congenital anomalies. However, in the current status, the expanded NBS is often limited because of the cost in the procurement of commercial kits. LC-MS/MS based screening for many disorder can be made pocket friendly and within the reach of all needy patients if we can develop our own in-house method. The simplicity of present method facilitates its easy adoption into existing screening platform without the need for any added instrument and infrastructure.
LQC: Low quality control; HQC: High quality control; CV: Coefficient of variation