The TREM-1 is a transmembrane glycoprotein of 234 amino acids and approximately 30 kDa that belongs to the immunoglobulin superfamily receptors expressed on PMNs and mature monocytes. These are stimulatory immunoreceptors that display a central role in allowing the recognition of foreign antigens or pathogens by the immune system [7]. TREM-1 amplifies infection-induced inflammatory response signals primarily through mediation of adapter protein DNAx activation protein-12 on the cell surface. Human tissues infected with bacteria are infiltrated with neutrophils and monocytes that expressed high levels of TREM-1. TREM-1 expressed by activated phagocytes may be a more “direct” marker of infection [4].
The aim of this study was to assess the role of TREM-1 gene expression as an early marker for diagnosis of NS in NICU and find out its relation to clinical disease severity compared with the conventional blood culture and other markers.
Materials and Methods
This case-control study was carried out at Microbiology and Immunology Department, Faculty of Medicine, Menoufia University, in collabouration with the Medical Microbiology Department, El-Menshawy General Hospital, Tanta, Egypt during the period from June 2019 to July 2020. The study involved 75 neonates (36 males and 39 females) from those admitted to the NICU of El-Menshawy General Hospital and 25 apparently healthy neonates served as a control group.
Group classification: The studied neonates were categorised into four groups; Group I: 25 neonates (14 males and 11 females) with Early Onset Sepsis (EOS) that occurred within the first 72 hours after birth [8]. Group II: 25 neonates (13 males and 12 females) with Late Onset Sepsis (LOS) that occurred after the first 72 hours after birth [8]. Group III: 25 neonates (14 males and 11 females) with septic shock. Group IV: 25 age and sex-matched healthy neonates with no evidence of sepsis or any other medical illness as a control group.
Written consents were obtained from all the neonates’ guardians and the study protocol was approved by the Ethical Committee of the Faculty of Medicine, Menoufia University (No.3216/15-4-2019). Inclusion and exclusion criteria were determined according to the Egyptian Neonatal Network (EGNN, 2020) [9].
Inclusion criteria were: Age: within one month; presence of (at least) two out of the following three criteria:
1) Risk factors of sepsis (e.g., prematurity, chorioamnionitis).
2) Two or more clinical signs of sepsis (poor reflexes, lethargy, respiratory distress, bradycardia, apnea, convulsions, abdominal distension, and bleeding).
3) Abnormal haemogram, positive CRP and positive blood culture.
Exclusion criteria: Neonates with congenital infections, major chromosomal abnormalities and prior use of antibiotics or intravenous immunoglobulins [9].
All neonates were subjected to full clinical assessment that involved careful neonatal and maternal history taking and complete general examination with stress upon signs and symptoms of NS as described by World Health Organisation (WHO) [10] young infant study group and Integrated Management of Childhood Illness (IMCI) group [11].
Data concerning routine laboratory investigations e.g., Complete Blood Count (CBC), CRP, liver enzymes (Alanine Aminotransferase (ALT) and Aspartate Aminotransferase (AST)) and Kidney Function Tests (KFT) (urea and creatinine) were collected from the neonates’ files.
Blood sample collection: Venous blood (2.5 mL) was withdrawn from each neonate under complete aseptic conditions. Each blood sample was divided as follows: 1/2 mL for estimation of TREM-1 mRNA expression by RT-PCR assay and 2 mL for conventional blood culture.
Conventional blood culture technique: Neonates’ blood samples were collected and incubated into blood culture bottles (30 mL, Salix, Egypt) under complete aseptic conditions at 37°C. Blood samples were obtained before starting the course of antibiotics. The first subculture was done after three days of aerobic incubation. If no growth, the samples were incubated up to 10 days with further subculture. Bacterial growth was detected after sub-culturing on blood, chocolate, nutrient, MacConkey’s and Sabouraud’s agar [12]. Organism were isolated, identified by standard microbiological methods [12] and tested against various antimicrobial agents; a bacterial suspension was compared to a 0.5 McFarland standard bacterial suspension. About 0.5 mL of the prepared bacterial solution was applied to the surface of Mueller-Hinton agar plate. Up to 9 commercially-prepared fixed concentration paper antibiotic disks were placed on the inoculated agar surface. Plates were incubated for 24 hour at 37°C prior to determination of results. The zones of growth inhibition around each of the antibiotic disks were measured and interpreted according to CLSI, 2019 guidelines [13].
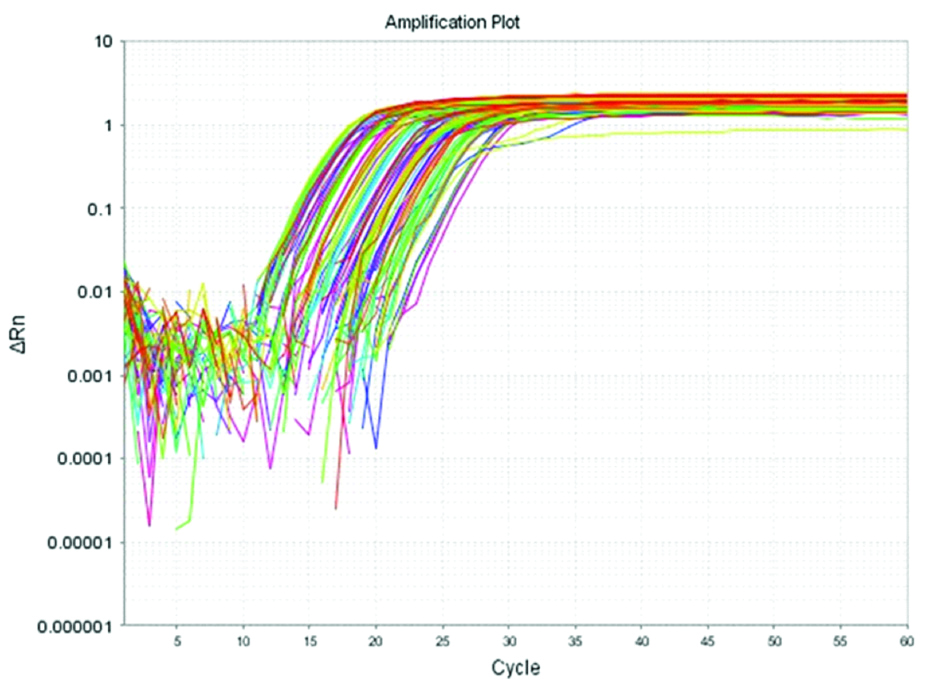
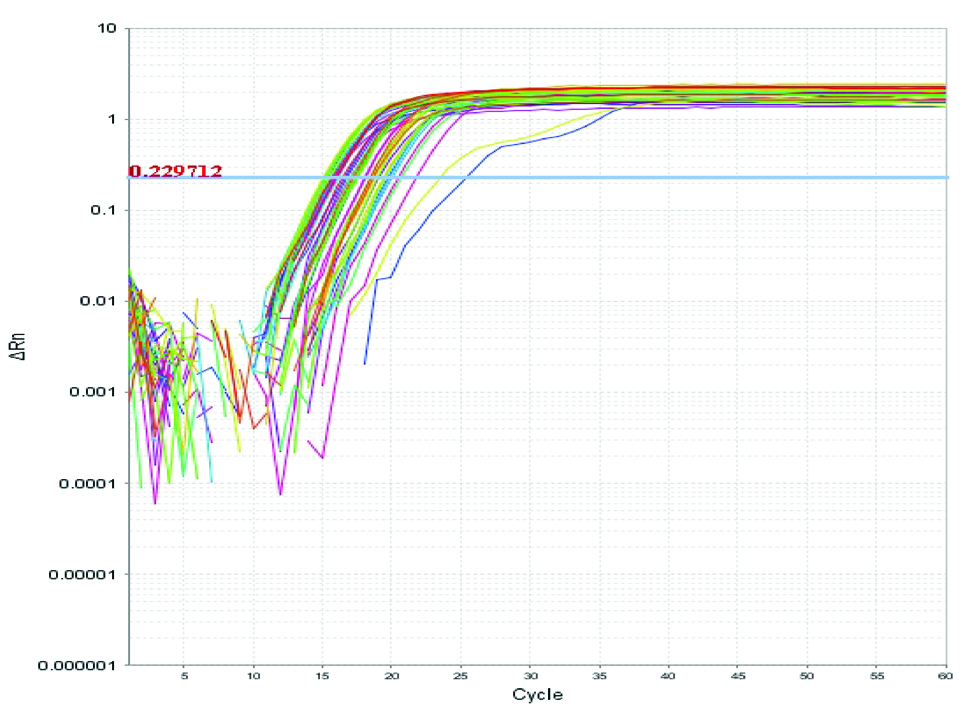
Estimation of TREM-1 gene expression level by RT-PCR assay: The technique involved three main steps: 1) RNA isolation: Total RNA was extracted from the PMNs by using the total RNA purification kit for isolation of total RNA by silica gel membrane adsorption (Gene JET® Whole Blood RNA Purification Mini Kit, Lithuania), according to the manufacturer’s instructions; 2) Conversion of RNA into cDNA: The total RNA was reverse transcribed to complementary DNA by using High Capacity/cDNA Reverse Transcription Kit (Lithuania); 3) Analysis of gene expression: by calculating a relative quantitative value of TREM-1 cDNA to β2 microglobulin cDNA (Reference gene) in peripheral blood of neonates suffering from sepsis. β2 microglobulin was used as an endogenous control to detect the effect of haemolysis [14]. Complementary DNA was amplified with SYBR Green by using the Maxima SYBR Green/ROX qPCR Master Mix (2X) (Lithuania), according to the manufacturer’s protocol [Table/Fig-1,2]. PCR primer sequences is presented in [Table/Fig-3].
Real time amplification plot for TREM-1 mRNA. In this figure, Rn is plotted against PCR cycle number.
Real time amplification plot for β2 microglobulin mRNA. In this figure, Rn is plotted against PCR cycle number.
DNA sequences of TREM-1 and β2 microglobulin genes [15].
| Genes | DNA sequences | Amplicon sizes |
|---|
| TREM-1 | F: 5’-TGG TCT TCT CTG TCC TGT TTG-3’R: 5’-ACT CCC TGC CTT TTA CCT C-3’ | 158 bp |
| β2 microglobulin | F: 5’-ATG AGT ATG CCT GCC GTGTG-3’R: 5’-CCA AAT GCG GCA TCT TCAAAC-3’ | 205 bp |
| (F, forward primer; and R, reverse primer). |
Statistical Analysis
Statistical analysis was done using SPSS version 20. Continuous/numerical data were presented as mean±Standard Deviation (SD), and were compared by Analysis of Variance (ANOVA) test. Categorical variables were shown as numbers (percentages) and were compared by Chi-square (χ2) test. Linear regression analysis was applied to evaluate the association between TREM-1 mRNA expression and other laboratory parameters. The diagnostic performance of TREM-1 was expressed as sensitivity, specificity, PPV, NPV, and Area Under the Receiver Operating Characteristic (AUROC) curve. Statistical significance was set at p-value <0.05.
Results
Socio-demographic and clinical characteristics of the studied neonatal groups are shown in [Table/Fig-4]. Regarding neonatal clinical data, the mean body temperature was 36.60±0.73, 36.88±1.49 and 38.13±1.39 for groups I, II and III, respectively with a highly significant statistical difference as compared to the control group (p3<0.001, p5<0.001 and p6=0.007). All of suckling reflex status, stage of respiratory distress, degree of activity and consciousness level displayed a significant statistical difference in relation to the control neonates (p<0.001, p=0.006, p<0.001 and p=0.003 respectively) [Table/Fig-4].
Sociodemographic and clinical characteristics among the studied neonatal groups.
| Studied parameters | Group I (n=25) | Group II (n=25) | Group III (n=25) | Group IV (n=25) | χ2 | p-value |
|---|
| No. | % | No. | % | No. | % | No. | % |
|---|
| Gender |
| Male | 14 | 56.0 | 13 | 52.0 | 14 | 56.0 | 14 | 56.0 | 0.92 | 0.811 |
| Female | 11 | 44.0 | 12 | 48.0 | 11 | 44.0 | 11 | 44.0 |
| Sig between groups | p1=0.776, p2=1.000, p3=1, p4=0.776, p5=0.776, p6=1 | | |
| Neonatal clinical data: Body temperature (°C) |
| Min-Max. | 36.0-39.0 | 35.60-40.0 | 35.0-39.80 | 35.0-37.8 | F=9.586* | <0.001* |
| Mean±SD. | 36.60±0.73 | 36.88±1.49 | 38.13±1.39 | 37.51±1.22 |
| Sig between groups | p1<0.001*, p2<0.001*, p3<0.001*, p4=0.851, p5<0.001*, p6=0.007* |
| Suckling reflex |
| Proper | 10 | 40.0 | 9 | 36.0 | 3 | 12.0 | 19 | 76.0 | χ2=24.038* | <0.001* |
| Poor | 15 | 60.0 | 16 | 64.0 | 22 | 88.0 | 6 | 24.0 |
| Sig between groups | Fisher Exact p1=0.010*, p2=0.024*, p3=0.010*, p4<0.001*, p5=0.355, p6<0.001* | | |
| Respiratory distress | (n=23) | (n=20) | (n=14) | | | | |
| Stage III | 12 | 52.2 | 14 | 70.0 | 2 | 14.3 | - | - | χ2=10.372* | 0.006* |
| Stage IV | 11 | 47.8 | 6 | 30.0 | 12 | 85.7 | - | - |
| Sig between groups | p1=0.233, p2=0.021*, p4=0.001* | | |
| Activity |
| Active | 10 | 40.0 | 16 | 64.0 | 5 | 20.0 | 19 | 76.0 | χ2=18.720* | <0.001* |
| Hypotonia /poor activity | 15 | 60.0 | 9 | 36.0 | 20 | 80.0 | 6 | 24.0 |
| Sig between groups | p1=0.089, p2=0.123, p3=0.010*, p4 0.002*, p5=0.355, p6<0.001* | | |
| Consciousness |
| Conscious | 10 | 40.0 | 15 | 60.0 | 5 | 20.0 | 19 | 76.0 | χ2=20.210* | 0.003* |
| Disturbed consciousness | 5 | 20.0 | 3 | 12.0 | 10 | 40.0 | 4 | 16.0 |
| Unconscious | 10 | 40.0 | 7 | 28.0 | 10 | 40.0 | 2 | 8.0 |
| Sig between groups | MCp1=0.462, p2=0.189, MCp3=0.015*, p4=0.010*, MCp5=0.220, p6<0.001* | | |
| Septic focus (source of infection)@ |
| Respiratory tract infection | 17 | 68.0 | 12 | 48.0 | 7 | 28.0 | - | - | χ2=8.333* | 0.016* |
| UTI | 2 | 8.0 | 8 | 32.0 | 11 | 44.0 | - | - |
| Sig between groups | p1=0.034*, p2=0.004*, p4=0.382 | | |
χ2: Chi-square test; MC: Monte carlo
F: F for ANOVA test, Pairwise comparison bet. Each 2 groups was done using Post-Hoc Test (Tukey)
p: p-value for comparing between the studied groups; *: Statistically significant at p≤0.05; p1: p-value for comparing between Group I and Group II; p2: p-value for comparing between Group I and Group III; p3: p-value for comparing between Group I and Group IV; p4: p-value for comparing between Group II and Group III; p5: p-value for comparing between Group II and Group IV; p6: p-value for comparing between Group III and Group IV; @only positively infected babies are mentioned
As regards possible sources of infection, respiratory tract infection accounted for 68%, 48% and 28%, meanwhile; UTI accounted for 8%, 32% and 44% for groups I, II and III, respectively, with a statistically significant difference between the studied groups (p=0.016) [Table/Fig-4].
About 96.0%, 80.0%, 72.0% of groups I, II and III, respectively had LBW of about <2500 gm with a significant statistical difference between the studied groups as compared to the control group (p3<0.001, p5<0.001 and p6=0.045). Similarly, 96%, 100% and 100% of groups I, II and III, respectively were premature with a highly significant statistical difference (p3<0.001, p5<0.001 and p6<0.001) [Table/Fig-5].
Neonatal risk factors among the studied neonatal groups.
| Neonatal risk factors | Group I (n=25) | Group II (n=25) | Group III (n=25) | Group IV (n=25) | χ2 | p-value |
|---|
| No. | % | No. | % | No. | % | No. | % |
|---|
| LBW (<3500 gm) | 24 | 96 | 20 | 80 | 18 | 72 | 7 | 28 | 12.516* | 0.006* |
| Sig bet groups | FEp1=0.349, p2=0.031*, p3<0.001*, p4=0.001*, p5<0.001*, p6=0.045* | | |
| Prematurity | 24 | 96 | 25 | 100 | 25 | 100 | 5 | 20 | 14.092* | MCp<0.001* |
| Sig between groups | FEp1=1.000, FEp2=1.000, p3<0.001*, p4=-, p5<0.001*, p6<0.001* | | |
| Meconium stained liquor | 2 | 8 | 5 | 20 | 3 | 12 | 1 | 4 | 0.947 | MCp=0.960 |
| Sig between groups | FEp1=0.221, FEp2=0.637, p3=0.551, p4=0.44, p5=0.817, p6=0.297 | | |
| Ammnionitis | 2 | 8 | 4 | 1 | 3 | 12 | 1 | 4 | 1.644 | MCp=0.755 |
| Sig between groups | FEp1=0.384, FEp2=0.637, p3=0.551, p4=0.157, p5=0.324, p6=0.297 | | |
| Duration of hospitalisation |
| <3 days | 25 | 100 | 2 | 8 | 0 | 0 | 10 | 80 | 84.709* | MCp<0.001* |
| 3-7 days | 0 | 0 | 4 | 16 | 4 | 16 | 15 | 20 | | |
| >7 days | 0 | 0 | 19 | 76 | 21 | 84 | 0 | 0 | | |
| Sig between groups | MCp1<0.001*, MCp2<0.001*, FEp3=0.051, MCp4<0.001*, MCp5<0.001*, MCp6<0.001* | | |
| Combined/more than one risk factor |
| Yes | 23 | 92 | 24 | 96 | 24 | 96 | 5 | 20 | 54.773* | MCp<0.001* |
| No | 2 | 8 | 1 | 4 | 1 | 4 | 20 | 80 | | |
| Sig between groups | p1=0.113, p2=0.113, MCp3<0.001*, p4= -, MCp5<0.001*, MCp6<0.001* | | |
LBW: Low birth weight; χ2: Chi-square test; MC: Monte carlo; F: F for ANOVA test, Pairwise comparison bet. Each 2 groups was done using Post-Hoc Test (Tukey); P: p-value for comparing between the studied groups; *: Statistically significant at p≤0.05; p1: p-value for comparing between Group I and Group II; p2: p-value for comparing between Group I and Group III; p3: p-value for comparing between Group I and Group IV; p4: p-value for comparing between Group II and Group III; p5: p-value for comparing between Group II and Group IV; p: p-value for comparing between Group III and Group IV
Most of group II (76%) and group III (84%) neonates had a significantly longer duration of hospitalisation compared to the control group (p5 and p6<0.001). Moreover, presence of more than one neonatal risk factor was highly significant (p<0.001). On the other hand, no statistically significant difference was detected regarding development of meconium- stained liquor, ammnionitis and gender [Table/Fig-4,5]. No statistically significant difference was detected between the three studied groups regarding blood culture results (p=0.803) [Table/Fig-6].
Blood culture results and the isolated organisms among the studied neonatal groups.
| Types of the isolated organisms | Group I (n=25) | Group II (n=25) | Group III (n=25) | Total | χ2 | p-value |
|---|
| No. | % | No. | % | No. | % | No. | % |
|---|
| Gram-negative bacteria (n=8) |
| Klebsiella spp. | 2 | 11.1 | 1 | 5.5 | 1 | 5.5 | 4 | 22.2 | 0.277 | 0.991 |
| Pseudomonas spp. | 1 | 5.5 | 1 | 5.5 | 1 | 5.5 | 3 | 16.7 |
| Acinetobacter spp. | 0 | 0 | 0 | 0 | 1 | 5.5 | 1 | 5.5 |
| Gram-positive bacteria (n=7) |
| Staph. aureus | 1 | 5.5 | 1 | 5.5 | 1 | 5.5 | 3 | 16.7 | 0.194 | 0.907 |
| Coagulase- Negative Staphylococci (CONs) | 1 | 5.5 | 1 | 5.5 | 2 | 11.1 | 4 | 22.2 | | |
| Fungus (n=3) |
| Candida spp. | 1 | 5.5 | 1 | 5.5 | 1 | 5.5 | 3 | 16.7 | 0.068 | 0.966 |
| Total culture-positive cases (n=18) | 6 | 33.3 | 5 | 27.8 | 7 | 38.9 | 18 | 24 | 0.439 | 0.803 |
| Total culture-negative cases (n=57) | 19 | 33.3 | 20 | 35.1 | 18 | 31.6 | 57 | 76 |
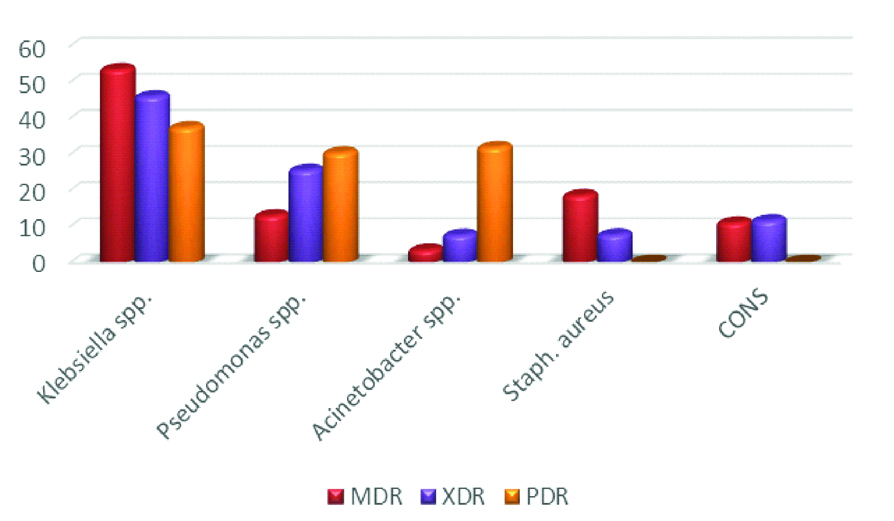
Importantly, the prevalence of multi-drug resistant strains reached 53.6% and 18.7% respectively for the obtained Klebsiella and Staph. aureus isolates. Moreover, 46.1% and 25.7% of the isolated Klebsiella and Pseudomonas spp. respectively were XDR, while 37.5%, 30.5% and 32% of the isolated Klebsiella, Pseudomonas and Acinetobacter spp. respectively were PDR isolates [Table/Fig-7].
Antimicrobial resistance pattern of the isolated microorganisms from the studied groups.
MDR: Multi drug resistance; XDR: Extensively drug resistance; PDR: Pan drug resistant; X axis % distribution Y axis organisms
According to RT-PCR results, the mean values of TREM-1 gene expression fold changes were 1.13±0.90, 1.14±1.22 and 0.38±0.24 for neonates with EOS, LOS and septic shock respectively with a significant statistical difference between group I and group III (p2=0.004), group II and group III (p4=0.038). A significant statistical difference was also noticed upon comparing the three neonatal groups I, II and III to the control group (p3=0.048, p5=0.049 and p6<0.001) [Table/Fig-8].
The mean values of TREM-1 gene expression fold changes among the studied neonatal groups (n=100).
| TREM-1 gene expression levels | Group I (n=25) | Group II (n=25) | Group III (n=25) | Group IV (n=25) | H | p-value |
|---|
| Min-Max | 0.11-2.69 | 0.14-2.98 | 0.01-0.90 | 0.50-1.08 | 18.329 | <0.001* |
| Mean±SD | 1.13±0.90 | 1.14±1.22 | 0.38±0.24 | 1.01±0.25 |
| Sig. between Groups | p1=0.438, p2=0.004*, p3=0.048*, p4=0.038*, p5=0.049*, p6<0.001* |
SD: Standard deviation; p-value less than 0.05 considered significant
[Table/Fig-9] shows correlation between the mean values of TREM-1 gene expression fold changes and routine laboratory investigations for diagnosis of NS. In group I and group II; a significant positive correlation was detected between the mean values of TREM-1 gene expression level and all of ALT, AST, urea, creatinine, K+, HCO3, PaO2 and capillary refill time (p<0.05). On the other hand, in group I and II, a highly significant negative correlation was detected between TREM-1 expression level and platelet count (p<0.001). For group III, a significant negative correlation was detected between the mean values of TREM-1 gene expression level and all of ALT, AST, urea, creatinine, K+, HCO3 and PaCO2 (p<0.05).
Correlation between mean values of TREM-1 gene expression fold changes and routine laboratory tests for diagnosis of NS.
| Routine laboratory tests for diagnosis of NS | TREM-1 gene expression |
|---|
| Group I (n=25) | Group II (n=25) | Group III (n=25) | Group IV (n=25) |
|---|
| rs | p-value | rs | p-value | rs | p-value | rs | p-value |
|---|
| CBC |
| TLC / mm3 | 0.521* | 0.008* | 0.187 | 0.370 | 0.324 | 0.114 | 0.273 | 0.185 |
| I/T ratio | -0.026 | 0.901 | 0.031 | 0.884 | 0.124 | 0.555 | 0.029 | 0.89 |
| I/M ratio | -0.017 | 0.936 | 0.164 | 0.434 | -0.137 | 0.513 | 0.181 | 0.386 |
| Platelet count/ mm3 | -0.637* | 0.001* | -0.661* | <0.001* | -0.180 | 0.389 | 0.212 | 0.308 |
| CRP | 0.101 | 0.630 | 0.171 | 0.414 | 0.340 | 0.097 | 0.15 | 0.472 |
| Liver function tests |
| ALT (U/L) | 0.591* | <0.001* | 0.157 | 0.005* | -0.624 | 0.016* | 0.634 | 0.090 |
| AST (U/L) | 0.955* | <0.001* | 0.091 | 0.014* | -0.124 | 0.001* | 0.383 | 0.348 |
| Kidney function tests Urea (mg/dL) | 0.646* | <0.001* | 0.552* | <0.001* | -0.990* | <0.001* | 0.102 | 0.809 |
| Creatinine (mg/dL) | 0.898* | <0.001* | 0.912* | <0.001* | -0.940* | <0.001* | 0.126 | 0.765 |
| Electrolyte conc. in blood |
| Na- (mEq/L) | -0.875 | <0.001* | -0.955 | <0.001* | 0.724 | 0.015* | 0.163 | 0.698 |
| K+ (mEq/L) | 0.854 | 0.001* | 0.979 | 0.003* | -0.976 | 0.004* | 0.539 | 0.167 |
| ABGs |
| pH | 0.017 | 0.936 | 0.164 | 0.434 | -0.137 | 0.513 | 0.213 | 0.611 |
| PaCO2 (mmHg) | -0.965* | 0.007* | -0.924 | 0.024* | -0.970 | 0.006* | 0.584 | 0.128 |
| HCO3 (mEq/L) | 0.974* | 0.005* | 0.943* | 0.016* | -0.969* | 0.006* | 0.455 | 0.257 |
| PaO2 (mmHg) | 0.707* | 0.018* | 0.972* | 0.005* | -0.959* | 0.009* | 0.682 | 0.062 |
| Capillary refill time (sec.) | 0.976* | 0.004* | 0.922* | 0.025* | -0.829 | 0.082 | 0.634 | 0.09 |
ABGs: Arterial blood gases; ALT: Alanine aminotransferase; AST: Aspartate aminotransferase; I/T: Immature/total leucocytes; I/M: Immature/mature leucocytes; CBC: Complete blood count; CRP: C-reactive protein; TLC: Total leukocyte count; rs: spearman correlation coefficient
Regarding clinical outcomes, about 33.3% (2/6), 40% (2/5) and 14.3% (1/7) of EOS, LOS and septic shock neonates respectively were cured despite of having positive blood cultures. On the other hand, 52.6% (10/19), 30% (6/20) and 66.7% (12/18), respectively were died despite of having negative blood cultures with no significant statistical difference between the studied groups (p=0.169 and p=0.952). As for TREM-1, a highly significant statistical difference was detected between group I and group III as well as between group II and group III dead neonates regarding TREM-1 expression fold changes (p2<0.001 and p4<0.001, respectively) as shown in [Table/Fig-10].
Blood culture results and TREM-1 gene expression fold changes in relation to clinical outcomes in the studied NS groups.
| Outcome | Group I | Group II | Group III | Test of Sig. | p-value |
|---|
| Blood culture results |
|---|
| Positive (n=6) | Negative (n=19) | Positive (n=5) | Negative (n=20) | Positive (n=7) | Negative (n=18) |
|---|
| No. | % | No. | % | No. | % | No. | % | No. | % | No. | % |
|---|
| Cured | 2 | 33.3 | 9 | 47.4 | 2 | 40 | 14 | 70 | 1 | 14.3 | 6 | 33.3 | χ2=0.918p=0.169 | p1=0.683p2=0.828p4=0.906 |
| Died | 4 | 66.7 | 10 | 52.6 | 3 | 60 | 6 | 30 | 6 | 85.7 | 12 | 66.7 | χ2=0.096p=0.952 | p1=0.808p2=0.773p4=0.836 |
| TREM-1 gene expression | Test of Sig. | p-value |
| Group IMin-Max | Group IIMin-Max. | Group IIIMin-Max |
| Mean±SD | Mean±SD | Mean±SD |
| Outcome |
| Cured | 0.11-0.35 | 0.14-0.38 | 0.15-0.36 | H=0.545p=0.761 | p1=0.599p2=0.462p4=0.833 |
| 0.24±0.09 | 0.26±0.07 | 0.22±0.09 |
| Died | 0.92-2.69 | 1.98-2.98 | 0.01-0.90 | H=23.892p<0.001* | p1=0.141p2<0.001*p4<0.001* |
| 1.82±0.57 | 2.71±0.41 | 0.45±0.25 |
At a cut-off point of ≥0.631 TREM-1 mRNA could be considered as an early marker for diagnosis of NS with a sensitivity, specificity, PPV, NPV and 95% CI of 65.33%, 96.0%, 98.0%, 48.0% and 0.609-0.808, respectively. At a cut-off point of >0.369 TREM-1 gene expression could be considered as a potential prognostic marker for prediction of mortality associated with NS with a sensitivity, specificity, PPV, NPV and 95% CI of 87.8%, 97.06%, 97.3%, 86.8% and 0.811-0.993 respectively as shown in [Table/Fig-11].
Value of TREM-1 gene expression in diagnosis of NS and prediction of mortality among septic neonates.
| AUC | p | 95% C.I | Cut-off | Sensitivity | Specificity | PPV | NPV |
|---|
| For diagnosis of NS | 0.708 | 0.002* | 0.609-0.808 | .0.631 | 65.33 | 96 | 98 | 48 |
| For prediction of mortality | 0.902 | <0.001* | 0.811-0.993 | >0.369 | 87.80 | 97.06 | 97.3 | 86.8 |
AUC: Area Under a Curve; CI: Confidence Intervals; NPV: Negative predictive value; PPV: Positive predictive value
Discussion
Neonatal Sepsis is a clinical syndrome in an infant aged 28 days of life or younger manifested by systemic signs of infection and isolation of a bacterial pathogen from the blood stream. It’s a broader term that includes septicaemia, meningitis, pneumonia, pyelonephritis, diarrhoea and neonatal tetanus [1]. Assessment of the severity of NS is based only on predictive scores is not completely adequate for prediction of potential complications and lethal outcomes [4]. There is a constant search for a marker that is specific and sensitive enough to improve the predictive value of clinical scores [5]. Microbiological testing of the blood is important in diagnosis of sepsis, but the time required for obtaining results ranges from 48 hours to 7 days. Biomarkers of sepsis, however, can be obtained in a much shorter period of time, which makes them superior in diagnosing sepsis and monitoring therapy [16]. The TREM family functions as modulators of cellular response, regulating positively and negatively the activation of myeloid cells during inflammation. TREM-1 is widely expressed on myeloid cells and acts as an inflammatory trigger and amplifier after exposure to extracellular fungal and bacterial pathogens [4].
The current study included 75 septic neonates from the NICU of El-Menshawy General Hospital. Neonates of male gender represented 54.7% (41/75) which came in concordance with Almohammady M et al., where 55.7% of the studied septic neonates were males [17]. Olorukooba AA et al., documented the same observation [18]. Their findings attributed to the increased biological vulnerability of male neonates during the post-natal period especially when maternal stress factors are present. Women pregnant to male foetuses have a higher incidence of preterm labour, pregnancy-induced hypertension, gestational diabetes mellitus, failure to progress and caesarean section because androgen precursors delay pulmonary maturity and are involved in the production of oestrogen, which may facilitate labour leading to pre-term birth [19].
Regarding gestational age, most of neonates in groups I, II and III (96%, 100% and 100%, respectively) were preterm neonates (<37 weeks) with a highly significant statistical difference (p<0.001) as compared to the control group. Medhat H et al., stated that male neonates, prematurity and LBW were significantly associated with higher incidence of NS [20]. Husada D et al., reported that the gestational age of the studied septic neonates ranged from 26-37 weeks [21]. In this study, the majority of the studied neonates were of LBW (<2500 gm) (62/75; 82.7%) with a significant difference as compared to the control group (p=0.006). In the same context, Hammoud MS et al., noticed that about 84.2% of neonates with signs of NS were of LBW [22].
Many other studies addressed that, prematurity and LBW were significant risk factors for developing NS [23,24]. That is because those newborns had poorly developed immune status; the adaptive response requires 5-7 days from delivery to develop, during this period infants are dependent on innate immune system as well as passively acquired immunoglobulin from the mother. Defects of immunoregulatory genes and prematurity together with LBW are associated with an incomplete maturation and/or function of the innate immune system resulting in an increased probability of infections [25].
According to the current findings, the mean body temperature was 36.60±0.73, 36.88±1.49 and 38.13±1.39 for groups I, II and III, respectively with a highly significant statistical difference as compared to the control group (p<0.001). Shaheen I and Ali D reported that about 60.6% of the studied septic neonates were hypothermic [26]; meanwhile a study from Iran [27] noticed that in neonates with sepsis, body temperature may be elevated, normal or depressed. Nevertheless, the incidence of respiratory distress was significantly high in group II and group III which came in agreement with Nyma Z et al., [28].
Importantly, UTI accounted for 8%, 32% and 44% of groups I, II and III, respectively with a significant difference (p=0.016). A study from the Netherlands [29] agreed with these results. Additionally, Respiratory Tract Infection (RTI) was confirmed by both clinical and laboratory findings in 68%, 48% and 28% of group I, II and III respectively. Adatara P et al., [30] reported that 81.3% of neonates admitted to NICU complained pneumonia. UTI and RTI were explored as possible sources of infection that may progress to NS particularly in LBW and preterm neonates. Regarding duration of hospitalisation, 100% of group I neonates were hospitalised for <3 days, about 76% and 84% of groups II and III, respectively were hospitalised for >7 days; meanwhile most of control group (80%) were hospitalised for <3 days; with a highly significant statistical difference (MCp<0.001). Adatara P et al., agreed with these findings [30].
Considered as the cornerstone for establishment of NS diagnosis, the current study involved blood culture technique for isolation and identification of the causative pathogens among the studied neonates. The total culture-proven cases represented 24% (18/75) while the remaining 57/75 (76%) cases were culture negative but with no statistically significant difference. A study from Canada [31] reported that only 11.8% of the performed blood cultures grew microorganisms. In another study done in Cairo University, Egypt [17] only 31.7% of the investigated blood cultures were pathogen-positive. Klebsiella spp. was the most common cause of NS in several developing countries. Previous reports of outbreaks of NS due to Klebsiella spp. in NICUs came in parallel with the current results where Klebsiella spp. were the most frequent Gram-negative isolates (4/18; 22.2%) [32-34]. Mai JY et al., noted that neonates with LBW were at higher risk for infection by Klebsiella [35]. As for Gram-positive isolates, CoNs and S. aureus accounted for 22.2% (4/18) and 16.7% (3/18) of positive blood cultures’ isolates respectively. Bizzarro MJ et al., reported nearly the same results [36]. In the present study, about 53.6% and 18.7% of the isolated Klebsiella and S. aureus respectively were MDR. Thatrimontrichai A et al., stated that the most common pathogenic organisms (MDR/nonMDR) were K. pneumoniae (83/15) of all septic neonatal episodes [37]. Also, Geyesus T et al., reported that 84.2% of K. pneumoniae and 67.3% of S. aureus isolates obtained from NS samples displayed MDR phenotype [38].
Although, blood culture is considered the gold standard for the diagnosis of NS, it has variable sensitivity. Moreover, negative blood culture does not rule out the disease [26]. Additionally, cultures obtained after antibiotic initiation are difficult to interpret and frequently lead to prolonged therapy. Maternal antibiotic treatment before or during delivery may mask detection of bacteremia in the newborn. Ultimately, contaminated blood cultures require additional blood draws and continued treatment while the repeat cultures are processing. The principal effect of timing of blood cultures in neonates is the low threshold for the start of antibiotic treatment decreasing the chance of isolating organisms on subsequent cultures [27]. In an attempt to overcome blood culture drawbacks, TREM-1 gene expression level was explored as a potential and predictive marker for NS. The mean values of TREM-1 gene expression levels for group I were significantly higher than that of group III (p2=0.004); also the mean values of TREM-1 expression fold changes for group II were significantly higher than that of group III (p4=0.038). These findings agreed with that reported by Shehab El-Din E et al., and Atef D et al., who found an inverse correlation between TREM-1 mRNA levels and the severity of pathophysiological conditions of acute bacterial infections in neonates with NS [39,40]. Additionally, a significant difference was noted upon comparing all the three patients groups to the control group regarding TREM-1 mRNA expression fold changes. Similarly, a study done in Egypt by El-Madbouly AA et al., suggested TREM-1 expression level as a diagnostic biomarker for NS where the mean level of TREM-1 was significantly higher in NS group than the control group [41].
The current findings revealed a positive correlation between the mean values of TREM-1 gene expression level and all of CRP, I/T ratio and I/M ratio. On the other hand, a negative correlation was detected between TREM-1 expression level and platelet count. These results came in line with those reported by Midan D, [42]. Also, El-Madbouly AA et al., noticed that there were positive correlations between TREM-1 expression level and all of WBCs (r= 0.689), ANC (r=0.428), I/T ratio (r=0.795), CRP (r=0.680) and sepsis score (r=0.733) while TREM-1 levels were negatively correlated to gestational age (r=-0.511) and weight (r=-0.51); Multi-regression linear analysis showed that CRP and sepsis score were independently related to TREM-1 levels (r2=0.835, p<0.001) [41]. Moreover, a highly significant difference was detected between group I, group II and group III neonates as regards TREM-1 gene expression fold changes for dead neonates; a finding which is similarly reported by Zidan M et al., and Adly AA et al., [43,44]. Regarding clinical outcomes, about 66.7%, 60% and 85.7% respectively of group I group II and group III neonates died which showed positive blood culture. A study done by Shehab El-Din E et al., reported that the total mortality rate for the proven NS cases reached 51% (25/49) and 42.9% (39/91) respectively for EOS and LOS [39].
In the current study, at a cut-off point of ≥0.631 TREM-1 mRNA could be considered as a potential marker for diagnosis of NS with a sensitivity, specificity, PPV, NPV and 95% CI of 65.33%, 96.0%, 98.0%, 48.0% and 0.609-0.808, respectively. Midan D, reported that on using ROC curve of TREM-1 expression level to diagnose NS cases, it had a p-value <0.001 with sensitivity, specificity and accuracy of 100% [42]. This proofs the relevance of TREM-1 estimation as a potential marker in diagnosing NS.
Limitation(s)
This study included a relatively small sample size. Lack of financial facilities disabled the use of automated blood cultures as well as anaerobic cultivation of the samples.
Conclusion(s)
TREM-1 gene expression levels may be considered an early marker for NS that could help in identifying septic neonates and eliminating un-useful antibiotic treatment. With regard to sepsis diagnosis and severity; TREM-1 gene expression have positive values in prognostic evaluation of the disease and may be taken as a survival-impacting risk factor. Future trials with larger sample size using serial measurements of TREM-1 gene expression levels are ultimately required to identify the optimal cut-off value and to establish diagnostic accuracy.
χ2: Chi-square test; MC: Monte carlo
F: F for ANOVA test, Pairwise comparison bet. Each 2 groups was done using Post-Hoc Test (Tukey)
p: p-value for comparing between the studied groups; *: Statistically significant at p≤0.05; p1: p-value for comparing between Group I and Group II; p2: p-value for comparing between Group I and Group III; p3: p-value for comparing between Group I and Group IV; p4: p-value for comparing between Group II and Group III; p5: p-value for comparing between Group II and Group IV; p6: p-value for comparing between Group III and Group IV; @only positively infected babies are mentioned
LBW: Low birth weight; χ2: Chi-square test; MC: Monte carlo; F: F for ANOVA test, Pairwise comparison bet. Each 2 groups was done using Post-Hoc Test (Tukey); P: p-value for comparing between the studied groups; *: Statistically significant at p≤0.05; p1: p-value for comparing between Group I and Group II; p2: p-value for comparing between Group I and Group III; p3: p-value for comparing between Group I and Group IV; p4: p-value for comparing between Group II and Group III; p5: p-value for comparing between Group II and Group IV; p: p-value for comparing between Group III and Group IV
SD: Standard deviation; p-value less than 0.05 considered significant
ABGs: Arterial blood gases; ALT: Alanine aminotransferase; AST: Aspartate aminotransferase; I/T: Immature/total leucocytes; I/M: Immature/mature leucocytes; CBC: Complete blood count; CRP: C-reactive protein; TLC: Total leukocyte count; rs: spearman correlation coefficient
AUC: Area Under a Curve; CI: Confidence Intervals; NPV: Negative predictive value; PPV: Positive predictive value