“Health is wealth”, this may be an old saying but it is applicable universally forever because health plays a very predominant and inevitable role in the life of every human being on the earth. Our ancestors led a life as fit as a fiddle due to their nutritious food habits and intense physical activities. In the recent days, humans are easily affected by various health issues one of which is obesity [1]. Obesity is growing at an alarming rate because it not only affects the elderly or middle-aged people but also children, youngsters and adolescents. According to WHO factsheet, 39% of adults aged 18 years and over were overweight and 13% were obese in 2016. Among children aged 5-19, over 340 million were overweight or obese [2]. In the present scenario, bringing obesity under control and protecting humans from its effects are of utmost importance.
The main reason for obesity is the lack of physical activity. At present, every human being wishes to have an admirable body image and has a very good insight about the outlook; structure and weight of his/her own body. But due to their mechanical life style and sedentary nature of work, they are not able to maintain what they perceive. They may feel that their personality is admirable but, in many cases, it may just be the reverse of what they imagine. This is prevalent among most of the college students, particularly among the students of medical college because of the stressful nature of their work [3]. This study was conducted with the objective of making such students be aware of their real health condition and personality. This study may also create an awareness about the perilous effects of sedentary life style and serve as an effective tool to enhance their health. They will also guide the common public and others of their age group by propagating the need for physical activity in daily life as a routine task. With this background, this study was aimed to assess the relationship between self-perceived body weight and the actual body weight among the medical students and to analyse their perceptions on physical activity.
Materials and Methods
This analytical cross-sectional study was done during July to September, 2017 in Dhanalakshmi Srinivasan Medical College and Hospital, Perambalur, Tamil Nadu, India. The study was started after getting approval from Institutional Ethics Committee (IECHS/DSMCH/048). Four hundred medical students including 316 girls and 84 boys, (sample size was calculated assuming 50% as frequency of occurrence of outcome, confidence interval of 95%, design effect as 1 and drop-out rate of 5%) [4] was included in the study using universal sampling method.
Students of both gender of age group 17-24 years who gave voluntary consent were included in the study and students who were not willing to participate in the study due to various reasons were excluded. Informed written consent was obtained from all the students at the beginning of the study. The students were approached in groups of 20 at the college hostel in the evenings and they were requested to complete the 9-figure Silhouette Matching Test (SMT) [Annexure-1] proposed by Stunkard and Stellard and modified by Collins [5].
Scoring of SMT: The students were asked to represent the figure how they currently looked (Feel) and how they actually wanted to look (Ideal). The number of the figure and its corresponding BMI was noted. The BMI values for each number were not shown to the students at the time of testing. Increase in feel BMI indicates they perceive more weight and decrease in feel BMI indicates they perceive less weight. The Feel minus Ideal Discrepancy (FID) score was also noted [6]. Negative scores represent the desire to be fatter and positive ones represent the desire to be thinner.
Every participant’s socio-demographic profile was collected in a general proforma and anthropometry was done. Weight was measured in Kilograms using a standardised weighing machine and height in centimeters, using a stadiometer. BMI was calculated using the Quetelet formula, i.e., Weight (Kg)/height (metres)2 [7]. Waist circumference and hip circumference were measured directly over the skin following adequate privacy settings for the participants [8]. Students were then subjected to a validated self-administered questionnaire EBBS [Annexure-2] regarding their perceptions and practice of physical activity and the factors influencing them. This questionnaire was prepared based on the benefits and barrier associated with physical activity and exercise. The validity coefficient is 0.85 for the whole scale, 0.95 for the benefits aspect and 0.80 for the barrier aspect [4]. The reliability is 0.89 for the whole scale, 0.89 for the benefits aspect and 0.77 for the barrier aspect [9].
EBBS instrument scoring: The instrument has a four-response, forced-choice Likert-type format with responses ranging from 4 (strongly agree) to 1 (strongly disagree). Barrier scale items were reverse-scored. Items on the barrier scale are numbers 4, 6, 9, 12, 14, 16, 19, 21, 24, 28, 33, 37, 40 and 42. The higher the score, the more positively the individual perceives exercise [9]. Higher benefits score indicate more interest towards exercising and higher barrier score denotes they are least interested in physical activity.
Statistical Analysis
The data was entered in excel sheets. Continuous variables were represented as mean±Standard Deviation (SD). Gender-wise comparisons were done using Student’s Independent t-test. Correlation between actual BMI and perceived BMI was done using Pearson Correlation test. The software used for analysis was SPSS version 17.0. The p-value <0.05 is considered statistically significant.
Results
The BMI of the study participants ranged from 18.59 to 25.87, which represented normal and overweight group among the participants. The mean BMI was 22.23±3.65 kg/m2 [Table/Fig-1].
Baseline characteristics.
| Parameter | Value |
|---|
| Number (n) | 400 |
| Age (years) (mean±SD) | 19.67±1.35 |
| Gender |
| Female, n (%) | 316 (79) |
| Male, n (%) | 84 (21) |
| Anthropometry |
| Weight (Kg) | 58.21±11.51 |
| Height (cm) | 161.58±8.50 |
| BMI (kg/m2) | 22.23±3.65 |
| Waist circumference (cm) | 71.64±10.30 |
| Hip circumference (cm) | 91.53±46.88 |
| Waist: Hip ratio | 1.42±7.05 |
SD: Standard deviation
[Table/Fig-2] represents the various components of SMT which was used to assess the perceived body image, which gives the mean value (along with SD) of feel and Ideal score, Feel BMI, Ideal BMI and FID (1.54±3.53).
Perceived body weight status using Silhouette Matching Test (SMT).
| Parameter | Value |
|---|
| Feel score | 4.42±1.1.35 |
| Ideal score | 3.88±0.918 |
| Feel BMI score | 23.45±3.60 |
| Ideal BMI score | 21.91±2.38 |
| Feel-Ideal discrepancy (FID) | 1.54±3.53 |
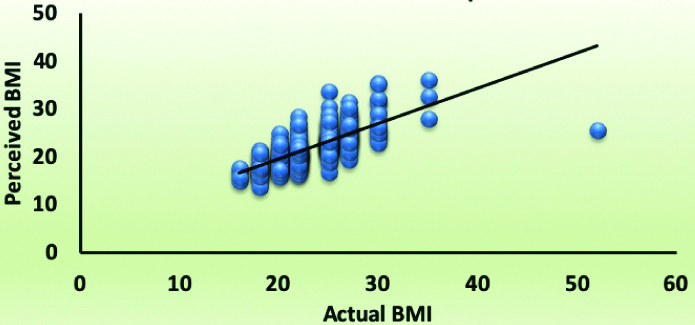
Correlation was sought between actual BMI and perceived BMI (Feel BMI) using Pearson Correlation test [Table/Fig-3] which showed strong positive correlation (r=0.726; p=0.0001).
Correlation between actual BMI and perceived BMI.
Done using pearson correlation test (r=0.726;p=0.0001)
The values like benefits score, barrier score and total score are depicted as median with range. The benefit barrier ratio was observed as 2.28 meaning that the benefit score is twice greater than the barrier score [Table/Fig-4].
Median scores of exercise benefits/barriers scale.
| Parameter | Median | Range |
|---|
| Benefits score | 87 | 42-121 |
| Barrier score | 38 | 17-107 |
| Total score | 124 | 71-170 |
| Benefit: Barrier ratio | 2.28 |
During gender-wise comparison on BMI, SMT and EBBS by Independent Student’s unpaired t-test [Table/Fig-5], it was found that males had high benefits score significantly (p=0.0002) than females.
Gender-wise comparison on BMI, SMT and EBBS score.
| Parameter | Male (N=84) | Female (N=316) | p-value |
|---|
| Height (cm) | 171.93±7.45 | 158.83±6.38 | 0.0001* |
| Weight (Kg) | 66.22±13.00 | 56.09±10.07 | 0.0001* |
| BMI (kg/m2) | 22.24±3.81 | 22.23±3.60 | 0.972 |
| Waist circumference (cm) | 76.20±11.54 | 70.43±9.61 | 0.0001* |
| Hip circumference (cm) | 103.35±99.63 | 88.39±11.00 | 0.009* |
| Waist:Hip ratio | 2.86±12.61 | 1.04±4.51 | 0.035* |
| Feel BMI | 24.77±5.00 | 23.10±3.03 | 0.0001* |
| Ideal BMI | 23.85±3.46 | 21.40±1.66 | 0.0001* |
| Feel-Ideal discrepancy | 1.93±5.10 | 1.70±2.95 | 0.074 |
| Benefits score# | 92 (63-120) | 86 (42-121) | 0.0002* |
| Barrier score# | 37.5 (25-54) | 38 (17-107) | 0.438 |
| Total score# | 127 (99-167) | 124 (71-170) | 0.003* |
*Statistically significant p-value- Unpaired Student’s independent T-test; All the values are given as mean±standard deviation; #The values are represented as median (range); BMI: Body mass Index, SMT: Silhouette matching test; EBBS-Exercise benefit and barrier scale
Discussion
In connection with the first objective of the study, it was found that actual BMI and the perceived BMI showed strong positive correlation. This indicates that as the actual BMI increases, the feel BMI also increases. Similar results were proven by Zaccagni L et al., who observed that the body dissatisfaction (FID) increased with increasing BMI [10]. In their study, the actual measured BMI in males was significantly higher than in females (24.0±2.8 vs 21.8±2.6; p<0.0001). In the current study, gender differences were observed in almost all of the anthropometric parameters with males having higher values than females. The male students have significantly higher Feel BMI and Ideal BMI than females (p=0.0001). The mean FID values were positive in both genders meaning that both male and female students had overestimated their weight and wanted to lose weight. In contrary, in a study by Barrett SC and Huffman FG, they found that females underestimated their actual, perceived and desired body weight significantly when compared to males [11]. The males had higher FID and had significant value; hence males have more concern and awareness over their body image.
In relation to the second objective, in present study participants had higher benefits score when compared to the barrier score. Similar finding was observed in the study by Lowell GP et al., who used the same instrument i.e., EBBS to find the benefits and barriers to physical activity in university female students in UK [12]. Another study by Martínez-Lemos RI et al., reported higher scores for barriers to exercise among Spanish university students [13]. In this study, males had high exercise benefits scores and total score when compared with females (p=0.0002 and 0.003, respectively). This finding, in addition to the higher FID, shows that male participants are more actively involved in physical activity and are more concerned about maintaining their body weight which was also a similar finding in the study done among Italian university students [10]. The importance of physical activity was better perceived among male students who generally tend to be more active. Female students, on the other hand may need strong motivation. The most important factor which acts as a barrier as stated by the participants of this study is lack of time. In a focus group interview among students conducted by Madrigal L et al., they have documented that main barrier among girls was that the prioritisation of physical activity and organised sports were poor [14]. In spite of the barriers, the students have a higher benefit/barrier ratio, which is a good point to be taken for they can be motivated easily towards achieving an active life style.
Limitation(s)
Though this study has included both subjective and objective measurements of body image, it would have been ideal if body composition analyser technique was used to study the body image accurately. Further, this study has to be upgraded with a larger sample including all the BMI groups for better generalisability.
Conclusion(s)
This study compares the relationship between actual BMI and self-perceived BMI which were well correlated indicating the participant’s awareness of their body image. Males were found to be having more FID indicating their desire to lose weight as compared to females. It was also found that both male and female students had higher range of benefit scores than barrier scores which is a favourable sign towards a healthy and active physical life. This study will serve as an awareness among students to become more concerned about their health and fitness and also to get involved in physical activity.
SD: Standard deviation
*Statistically significant p-value- Unpaired Student’s independent T-test; All the values are given as mean±standard deviation; #The values are represented as median (range); BMI: Body mass Index, SMT: Silhouette matching test; EBBS-Exercise benefit and barrier scale