Introduction
Obesity is defined by the World Health Organisation (WHO) as abnormal or excessive fat accumulation that may impair health [1]. Obesity is a global epidemic with at least 600 million adults affected worldwide with growing numbers especially in Sub-Saharan Africa [1-3]. Obesity is a public health challenge in many low and middle income countries including Nigeria [3,4]. The prevalence of overweight and obese individuals, range between 20.3-35.1% and 8.1-22.2%, respectively in Nigeria [4]. There is evidence on a global scale that obesity adversely affects individuals’ health [3,5]. Obesity is a risk factor for several non-communicable diseases including cardiovascular diseases, cancers, osteoarthritis, pulmonary embolism, cognitive impairment and mental health disorders including depression [6-11].
Several studies have looked at the prevalence of obesity among several professional groups and its effects on workplace performance, physical function and capacity, and cognitive performance [12-15]. Obese employees have been found to have higher rates of sick leaves [11] and workplace employer paid healthcare costs [12-15]. Direct measures of obesity include underwater weighing and Dual Energy X-Ray Absorptiometry (DEXA) but facilities for these measures are largely unavailable in resource-poor settings (like ours) and these measures are also not routinely used in clinical practice. Indirect measures of obesity commonly employed in assessment of obesity include: BMI, WC, WHpR, WHtR, and Skinfold Thickness (ST). BMI is widely used to categorise overweight and obesity and may be regarded an ideal measure of adiposity, because it is easy to measure and closely relates to obesity related health risks [16,17].
However, individuals may be “metabolically obese” (with elevated visceral fat) but fall within the normal BMI category, while sharing many of the health risks for obesity [18,19]. Furthermore, BMI does not distinguish between fat, muscle or bone mass; hence, muscular individuals may be misclassified as being overweight or obese despite having normal body fat percentage [20]. BMI, WHtR, WC and WHpR all independently predict cardiovascular risk [21,22]; however, in comparing the associations of various measures of obesity with cardiovascular risk, cardiovascular mortality and all-cause mortality, measures of central obesity; WC, WHR, WHtR have been shown to be superior to BMI [21-23]. Several studies have found a high prevalence of general obesity and being overweight among medical doctors with rates ranging from 48% to 65% [15-18]. A high prevalence of central obesity has also been recorded among doctors and other health professionals [16,20,24]. Central obesity has worse health outcomes than general obesity and plays a greater role in the causation of CVDs and diabetes mellitus [19,25-27].
Physicians manage the health problems associated with obesity and counsel obese patients on healthy lifestyles and weight loss measures. It is important that the physicians themselves be healthy, in order to attend adequately to patients. A healthy-looking non-obese doctor may also seem more credible when counselling patients on healthy life styles and diet, than an overweight or obese doctor [25,27-33].
This study was conceptualised to assess the prevalence of obesity among physicians in Bayelsa State, in the Niger Delta region of Nigeria. Four anthropometric measures: BMI, WC, WHpR and WHtR were deployed in this assessment, the ability of these measures to predict cardiovascular risk in relation to elevated BP was also compared.
Materials and Methods
There was a descriptive cross-sectional study collection conducted between August 2018 and January 2019. Ethical clearance (application form no NDUTH REC/0039b/2017) was obtained.
Inclusion criteria and Exclusion criteria: Inclusion criteria were all medical doctors, irrespective of their cadre, working in Bayelsa state. Exclusion criterion was visibly pregnant female doctors.
Study setting: The study was conducted in Bayelsa state, Nigeria. Two hundred and forty four apparently healthy physicians were recruited from all the medical doctors registered to practice medicine in Bayelsa state. There are about 700 medical doctors registered to practice in the three levels of healthcare service delivery in both public and private health sectors of the state. Participants spanned through different cadre of the profession including house officers, resident doctors, medical officers, consultants and professors in various specialties and sub-specialties of medical practice.
Sample size: Sample size for studying proportions with population <10, 000 [34]

nf=the desired sample size when population is less than 10,000
N=the estimate of the population size (approximately 700 registered doctors in the state)

Where, z=the standard normal deviate (using 95% confidence level=1.96)
p=the proportion in the target population estimated to be obese (the prevalence of obesity in medical doctors is 48% to 65% [15-18], therefore, midpoint=56.5%)
q=1.0-p
d=degree of accuracy desired, set at 0.05 therefore,
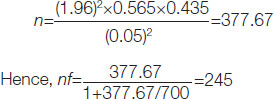
The sample size appropriately powered and calculated for this study was 245.
Sampling technique: Three clusters of doctors were created based on the place of primary assignment of the medical doctors. Doctors working in the Federal Medical Centre (FMC), Yenagoa formed cluster one. Cluster two comprised of doctors working in the employment of the Niger Delta University Teaching Hospital (NDUTH), while the other doctors working at the secondary and primary levels of care in the private and public sectors formed the third cluster. The doctors in the third cluster are members of the Association of General Medical Practitioners (AGMPN) of Nigeria (Bayelsa state) and that was the avenue used for their sampling. Eighty-two doctors each were selected from the three clusters using a simple random sampling technique (Balloting). Doctors who declined participation were replaced by picking new names from the balloting box in each of the clusters. The lists of doctors in the two tertiary institutions were obtained from the management of the institutions while the doctors’ list in the AGMPN was obtained from the Association’s officials.
Study instrument (Questionnaire): The study instrument was a self-administered questionnaire developed from the WHO stepwise approach to Surveillance guidelines [16,35] by the researchers. It explored information on socio-demographic, work duration and professional status/cadre.
Study procedures: Preselected study participants were informed by phone or physically about their selection and an office selected in each of the clusters: FMC Yenagoa, NDUTH Okolobiri and the AGMDP state secretariat was used as the venue of their assessment. The offices were open between 12-3 pm and were manned by Research Assistants (RAs).
Training for two days was given to RAs training lasting three hours each day, emphasising the objectives of the study and how to take the required measurements in the study in a consistently accurate manner. Training ended with a field trial where RAs were watched and corrected to ensure compliance to study procedure.
After participant’s submitted the completed self-administered questionnaire, physical measurements were taken by RAs. The average evaluation time for each medical doctor was 20 minutes. Height was measured with each participant standing feet together, without shoes, and with their backs to a rigid tape measure, head held high and looking straight on, at a spot on the opposite wall. A flat ruler was placed on the participant’s head to flatten any hairs present and readings were taken off the tape to the nearest 0.1 centimeter, at the point where the flat ruler touched the rigid tape. A standardised weight scale was used to measure body weight in kilograms (to one decimal place) with the participants wearing only light clothing. A non-stretch linear tape was applied approximately midway between the lower margin of the last palpable rib and the top of the iliac crest [35] for measurement of WC to the nearest 0.1 centimeters. HC was measured across the widest diameter of the hips over the greater trochanters, also to the nearest centimeter. An Accoson mercury sphygmomanometer was used to measure the brachial artery systolic and diastolic blood pressure at Korotkoff 1 and 5 respectively, with participants seated, after resting for 5 minutes [36]. Two BP recordings were taken from the left arm of patients with measurements taken at 5-minute intervals. The average of two measurements was then taken as the BP reading.
Data Processing and Analysis
The anthropometric measurement of two doctors was not done though they filled the questionnaire, so they were not included in the data analysis.
BMI was calculated as weight in kg divided by the square of the height in metres (kg/m2). Using WHO guidelines, obesity was defined as a BMI of ≥30 kg/m2 [1,35]. The threshold for obesity using WC was 94 cm for men and 80 cm for women [37]. WHpR was obtained by dividing WC by HC and WHpR >0.90 in males and >0.85 in females was categorised as obese [37]. After calculating WHtR by dividing WC by height, WHtR ≥0.5 was considered obese [38]. Hypertension was considered present at Systolic Blood Pressure reading ≥140 mmHg and/or diastolic BP reading ≥90 mmHg [39,40].
All participants with elevated BP (systolic BP reading ≥140 mmHg and/or diastolic BP reading ≥90 mmHg) and classified as obese by the anthropometric measures were deemed to be at risk of cardiovascular disease. Using the BP categorisation as the standard indicator of cardiovascular risk [41], the classification of the WC, WHpR, WHtR and BMI were compared and the sensitivity, specificity, Positive Predictive Value (PPV) Negative Predictive Value (NPV) accuracy of these anthropometric measures in predicting cardiovascular risk was assessed. The ROC curve was constructed and Area Under the Curve (AUC) was obtained for the four anthropometric measures to compare their abilities to predict cardiovascular risk among participants using BP as the standard indicator for cardiovascular risk.
Statistical Analysis
Filled questionnaires were checked for completeness and entered into a Microsoft Excel sheet on a personal computer where data was cleaned. Cleaned data was imported into Statistical Package for Social Sciences (SPSS) version 22 software which was used for data analysis. Correlation analysis was also done to explore the relationship between all the measures of cardiovascular risks deployed in the study. Significant level for Pearson’s correlation co-efficient and AUC was set at p-value<0.05
Results
Sociodemographic characteristics of participants
Two hundred and forty four doctors participated in the study. Most of them were less than 30 years old (40.2%) and married (54.9%) and a third were women (29.9%), [Table/Fig-1]. The mean age of study participants was 37.4±11.3 years and mean duration of practice was 9±11.1 years. The data is skewed towards participants who have spent a short duration in their practice in Bayelsa. This may be explained by the brain drain of medical doctors in Nigeria, with many relocating overseas in search of better paying opportunities.
Socio-demographic information of study participants.
| Characteristics | Frequency (N=244) | Percent (%) |
|---|
| Sex |
| Male | 171 | 70.1 |
| Female | 73 | 29.9 |
| Age (in years) |
| ≤30 years | 98 | 40.2 |
| 31-40 years | 68 | 27.9 |
| 41-50 years | 44 | 18.0 |
| 51-60 years | 25 | 10.2 |
| >60 years | 9 | 3.7 |
| Mean age | 37.4±11.3 years |
| Marital Status | | |
| Single | 110 | 45.1 |
| Married | 134 | 54.9 |
| Professional Cadre/Status | | |
| House officer | 98 | 40.2 |
| Resident/Medical officer | 100 | 41.0 |
| Consultant/Professor | 46 | 18.9 |
| Duration of Practice | | |
| <1 years | 88 | 36.1 |
| 1-5 years | 55 | 22.5 |
| 6-10 years | 24 | 9.8 |
| 11-20 years | 36 | 14.8 |
| 21-30 years | 28 | 11.5 |
| >30 years | 13 | 5.3 |
| Mean duration of practice-9.0±11.1 years | |
Prevalence of elevated Blood Pressure (BP) and central obesity among study participants
The prevalence of elevated BP among the study participants was 26.6% [Table/Fig-2]. Almost a fifth of the doctors in the study (18.4%) were obese using the BMI categorisation. However, WC (44.3%), WHtR (58.2%), WHpR (63.1%) showed higher prevalence of obesity compared to the BMI categorisation [Table/Fig-2].
Prevalence of cardiovascular risk as shown by Blood Pressure (BP) readings and anthropometric measures.
| Characteristics | Classification | Frequency N=244 (%) |
|---|
| Blood Pressure (BP) (mmHg) |
| Elevated Systolic BP | ≥140 | 35 (14.3) |
| Elevated Diastolic BP | ≥90 | 61 (25.0) |
| Elevated BP | SBP ≥140DBP ≥90 | 65 (26.6) |
| Generalised obesity |
| Body Mass Index (BMI) | ≥30 kg/m2 | 45 (18.4) |
| Central obesity |
| Waist Circumference (WC) | Male ≥94 cmFemale ≥80 cm | 108 (44.3) |
| Waist-to-Hip Ratio (WHpR) | Male ≥0.9Female ≥0.85 | 154 (63.1) |
| Waist-to-Height Ratio (WHtR) | ≥0.5 | 142 (58.2) |
Diagnostic accuracy of BMI, WC, WHpR and WHtR in identifying cardiovascular risk in relation to elevated BP
[Table/Fig-3] shows the cross-tabulation results between elevated BP (reference CVD indicators) and the screening tests (BMI, WC, WHpR, and WHtR) considered in the study. While BMI and BP classified 45 (18.4) and 65 (26.6%) participants as at risk of CVD; WC, WHpR and WHtR categorised 108 (44.3%), 154 (63.1%) and 142 (58.2%), respectively as so. False-positive case classification is highest between elevated BP and WHpR, while false-negative case classification is highest between elevated BP and BMI [Table/Fig-3].
The cross-tabulation results between the screening tests and reference CVD risk assessment test {Elevated Blood Pressure (BP)}
| Screening test | | CVD risk indicator | Total |
|---|
| Elevated BP |
|---|
| Present | Absent |
|---|
| WC | Obese | 33 | 75 | 108 |
| Non-obese | 32 | 104 | 136 |
| Total | 65 | 179 | 244 |
| WHpR | Obese | 51 | 103 | 154 |
| Non-obese | 14 | 76 | 90 |
| Total | 65 | 179 | 244 |
| WHtR | Obese | 47 | 95 | 142 |
| Non-obese | 18 | 84 | 102 |
| Total | 65 | 179 | 244 |
| BMI | Obese | 17 | 28 | 45 |
| Non-obese | 48 | 151 | 199 |
| Total | 65 | 179 | 244 |
The sensitivity of BMI, WC, WHpR and WHtR in diagnosing cardiovascular risk, considering elevated BP as reference, ranges 26.5% to 78.5% [Table/Fig-4]. The highest NPV was 84.4% between WHpR and elevated BP; while for the PPV the highest proportion was 37.8% for BMI which also has the highest specificity (84.4%).
Diagnostic performance of BMI, WC, WHpR and WHtR in predicting CVD risk in relation to elevated Blood Pressure (BP).
| Diagnostic parameter of screening test | Screening tests |
|---|
| WC | WHpR | WHtR | BMI |
| Sensitivity (%) | 50.8 | 78.5 | 72.3 | 26.5 |
| Specificity (%) | 58.1 | 42.5 | 46.9 | 84.4 |
| Positive Predictive Value (%) | 30.6 | 33.1 | 33.1 | 37.8 |
| Negative Predictive Value (%) | 76.5 | 84.4 | 82.4 | 75.9 |
| Accuracy (%) | 56.1 | 52.0 | 53.7 | 68.8 |
Relationship between cardiovascular risk screening tests
The Pearson’s correlation coefficient between these cardiovascular screening tests shows a positively statistically significant (p<0.05) weak to very strong relationship. The weakest relationship exists between BMI and BP findings [Table/Fig-5]. WC and WHtR show a very strong positive relationship (r=0.88; p=0.001).
Results of correlation between the different cardiovascular risk screening tests.
| Characteristics | Cardiovascular risk screening tests |
|---|
| BMI | WC | WHpR | WHtR | BP |
|---|
| Body Mass Index (BMI) |
| Pearson correlation coefficient (r) | 1.00 | | | | |
| p-value | - | | | | |
| Waist Circumference (WC) |
| Pearson correlation coefficient (r) | 0.67 | 1.00 | | | |
| p-value | 0.037 | - | | | |
| Waist-to-hip Ratio |
| Pearson correlation coefficient (r) | 0.31 | 0.61 | 1.00 | | |
| p-value | 0.001 | 0.001 | - | | |
| Waist-to-height ratio |
| Pearson correlation coefficient (r) | 0.73 | 0.88 | 0.50 | 1.00 | |
| p-value | 0.001 | 0.001 | 0.001 | - | |
| Blood Pressure (BP) |
| Pearson correlation coefficient (r) | 0.15 | 0.30 | 0.27 | 0.21 | 1.00 |
| p-value | 0.019 | 0.001 | 0.001 | 0.001 | - |
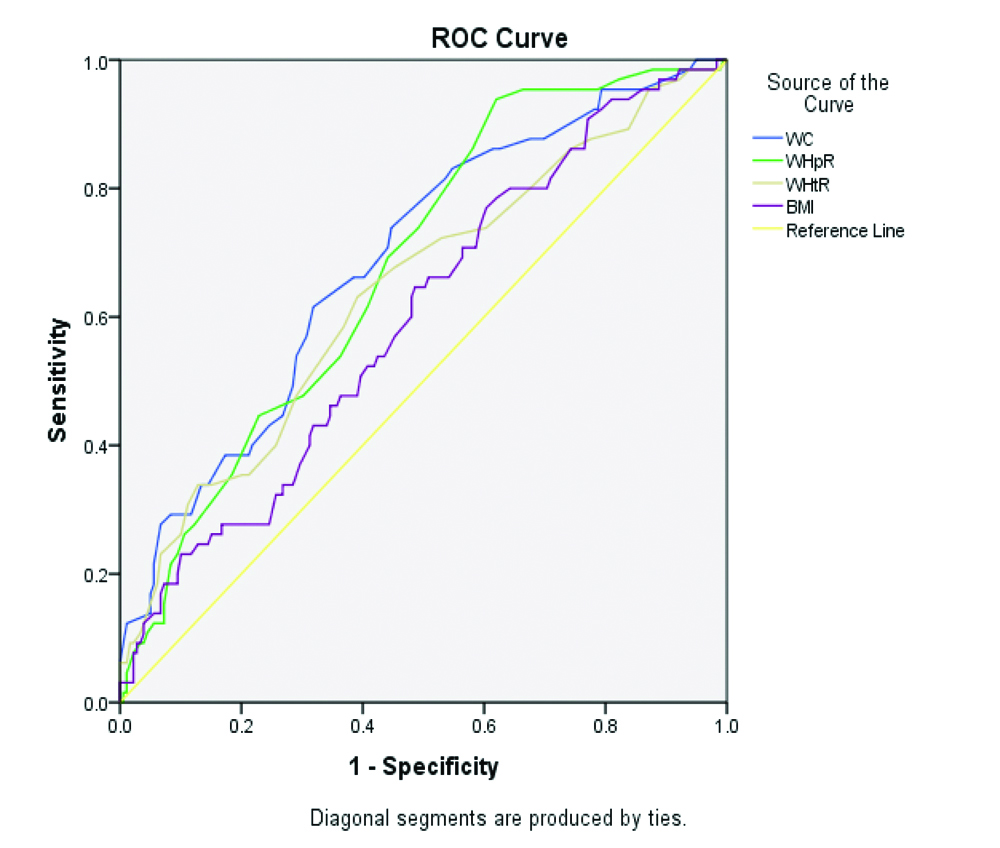
[Table/Fig-6] shows the performances of the screening tests (BMI, WC, WHpR and WHtR) as reflected on the ROC curves [Table/Fig-7]. All anthropometric measures demonstrate a moderately accurate performance in predicting cardiovascular risk (hypertension), as indicated by AUC values that are ≥0.60. WC performed best in predicting cardiovascular risk (hypertension) in the study participants.
Performance of screening tests in identifying cardiovascular risk {elevated Blood Pressure (BP)} among participants.
| Screening test | Area under the ROC Curve (AUC) | 95%CI | p-value |
|---|
| Min | Max |
|---|
| Waist Circumference (WC) | 0.69 | 0.62 | 0.76 | 0.001 |
| Waist-to-Hip Ratio (WHpR) | 0.68 | 0.61 | 0.75 | 0.001 |
| Waist-to-Height Ratio (WHtR) | 0.64 | 0.56 | 0.72 | 0.001 |
| Body Mass Index (BMI) | 0.60 | 0.52 | 0.68 | 0.019 |
ROC curve comparing diagnostic accuracy of WC, WHpR, WHtR and BMI in predicting cardiovascular risk (hypertension).
Discussion
Prevalence of general obesity among medical doctors, using BMI categorisation, was 18.4% in this study. However, WC (44.3%), WHtR (58.2%), WHpR (63.1%) showed higher prevalence of obesity compared to the BMI categorisation. BMI has been regarded for years as the gold standard for measure of adiposity, given that it is easy to measure and is closely associated with obesity related health risks [42]. However, BMI fails to distinguish between fat, muscle or bone mass [43] and shows significant dependencies on age and sex [44]. BMI also overlooks fat distribution which is an important factor in CVD risk [45].
Previous studies have shown that one of the short comings of BMI is that it may classify persons with central obesity as normal or overweight [43,46-48]. BMI may not be an optimal marker for adiposity in older adults as a result of changes in body composition that occur with aging, such as a gradual increase in fat mass, decreased muscle mass and quality or sarcopenia. Indices such as WC, WHtR and WHpR are simple to measure and useful in identifying and characterising obesity morphology [49-52]; particularly where differences in anthropometry among study participants is relevant to consider [45]. Although BMI remains a useful guide to obesity related health problems, measures of central obesity (WC, WHpR, WHtR) are simple alternatives/additives with additional value for predicting cardiovascular and metabolic complications [53-59]. These measures of central obesity have been shown by several studies to be more accurate predictors of cardiovascular health than BMI [46,47,54-59]. Abdominal obesity has been shown to significantly associate with CVD risk factors such as diabetes and dyslipidaemia and CVDs even when the BMI is normal [46,59-62]. Central obesity is also associated with a higher incidence of development of CVD risk factors related to cardiovascular diseases compared with high BMI [60,62]. Therefore, the sole use of BMI in practice-based settings may underestimate obesity and cardiovascular disease risk if central measures of obesity are not also measured and monitored [43-45,47-48,53-59]. The high prevalence of abdominal obesity in the present study further underscores the importance of measuring and monitoring abdominal obesity irrespective of the BMI classification.
In predicting cardiovascular risk using BP levels as the standard, the weakest relationship exists between BMI and BP findings, while measures of central obesity show a very strong positive relationship. Also, WC, WHpR and WHtR showed stronger performance than BMI in predicting hypertension, as indicated by areas under the ROC curve (AUC), with slightly higher AUC for the WC (0.69) in comparison to the other indices. This agrees with previous studies that show accumulation of fat in the upper body, which may reflect both visceral and subcutaneous fat, and, hence, total fatness, predicts hypertension greater than BMI which measures the sum of fat mass and fat-free mass [63-65]. WC which was identified as the best measure in this study has certain peculiar advantages. WC needs only one reading while for others you have to measure two reading. So, it is easier than all and the chance for errors is minimised. Prevalence of abdominal obesity as measured by WC has been found to be currently on the rise faster than general obesity measured using BMI [19,20].
Studies have indicated that WHtR ≥0.50 may more accurately predict HTN and DM than other measurements but those studies were mostly in Asians [66,67]. It is noteworthy that the present study, carried out in black Africans, found waist to height ratio compared favourably with other indices of central obesity in predicting hypertension.
Limitation(s)
The use of hypertension as a proxy measure of CVD risk may have overestimated CVD risk in this population. However, it is important that preventive measures are instituted to curb the rising menace of CVD.
Conclusion(s)
Using BMI alone in epidemiologic studies assessing obesity may result in misclassification of some persons as normal or overweight despite being centrally obese and at increased risk for cardiovascular diseases. A high prevalence of central obesity in medical doctors is worrisome given the associated cardiovascular risks. This study shows all four anthropometric indices (WC, WHtR, WHpR and BMI) are useful in predicting cardiovascular risk, with the best and worst predictors being WC and BMI, respectively.
[1]. World Health Organization. Obesity: preventing and managing the global epidemic. 2000. http://www.who.int/nutrition/publications/obesity/WHO_TRS_894/en/. Accessed 8 May 2017 [Google Scholar]
[2]. Ziraba AK, Fotso JC, Ochako R, Overweight and obesity in urban Africa: A problem of the rich or the poor?BMC Public Health 2009 9:46510.1186/1471-2458-9-46520003478 [Google Scholar] [CrossRef] [PubMed]
[3]. Ng M, Fleming T, Robinson M, Thomson B, Graetz N, Margono C, Global, regional, and national prevalence of overweight and obesity in children and adults during 1980-2013: A systematic analysis for the global burden of disease study 2013Lancet 2014 384(9945):766-81.10.1016/S0140-6736(14)60460-8 [Google Scholar] [CrossRef]
[4]. Chukwuonye II, Chuku A, John C, Ohagwu KA, Imoh ME, Ejiji S, Prevalence of overweight and obesity in adult Nigerians- A systematic reviewDiabetes Metab Syndr Obes 2013 6:43-47.10.2147/DMSO.S3862623573067 [Google Scholar] [CrossRef] [PubMed]
[5]. Wang Y, Beydoun MA, The obesity epidemic in the United States-gender, age, socioeconomic, racial/ethnic, and geographic characteristics: A systematic review and meta-regression analysisEpidemiol Rev 2007 29:06-28.10.1093/epirev/mxm00717510091 [Google Scholar] [CrossRef] [PubMed]
[6]. Hubert HB, Feinleib M, McNamara PM, Castelli WP, Obesity as an independent risk factor for cardiovascular disease: A 26-year follow-up of participants in the Framingham heart studyCirculation 1983 67:968-77.10.1161/01.CIR.67.5.9686219830 [Google Scholar] [CrossRef] [PubMed]
[7]. Goldhaber SZ, Grodstein F, Stampfer MJ, Manson JE, Colditz GA, Speizer FE, A prospective study of risk factors for pulmonary embolism in womenJAMA 1997 277:642-45.10.1001/jama.1997.035403200440339039882 [Google Scholar] [CrossRef] [PubMed]
[8]. Carroll KK, Obesity as a risk factor for certain types of cancerLipids 1998 33:1055-59.10.1007/s11745-998-0305-89870899 [Google Scholar] [CrossRef] [PubMed]
[9]. Powell A, Teichtahl AJ, Wluka AE, Cicuttini FM, Obesity: A preventable risk factor for large joint osteoarthritis which may act through biomechanical factorsBr J Sports Med 2005 39:04-05.10.1136/bjsm.2004.01184115618330 [Google Scholar] [CrossRef] [PubMed]
[10]. Gilleard W, Functional task limitations in obese adultsCurr Obes Rep 2012 1:174-80.10.1007/s13679-012-0019-6 [Google Scholar] [CrossRef]
[11]. Cournot MC, Marquie JC, Ansiau D, Martinaud C, Fonds H, Ferrieres J, Relation between body mass index and cognitive function in healthy middle-aged men and womenNeurology 2006 67:1208-14.10.1212/01.wnl.0000238082.13860.5017030754 [Google Scholar] [CrossRef] [PubMed]
[12]. Neovius K, Johansson K, Kark M, Neovius M, Obesity status and sick leave: A systematic reviewObes Rev 2009 10:17-27.10.1111/j.1467-789X.2008.00521.x18778315 [Google Scholar] [CrossRef] [PubMed]
[13]. Pollack KM, Sorock GS, Slade MD, Cantley L, Sircar K, Taiwo O, Association between body mass index and acute traumatic workplace injury in hourly manufacturing employeesAm J Epidemiol 2007 166:204-11.10.1093/aje/kwm05817485732 [Google Scholar] [CrossRef] [PubMed]
[14]. Schmier JK, Jones ML, Halpern MT, Cost of obesity in the workplaceScand J Work Environ Health 2006 1:05-11.10.5271/sjweh.97016539166 [Google Scholar] [CrossRef] [PubMed]
[15]. Al Alwan I, Badri M, Al-Ghamdi M, Aljarbou A, Alotaibi H, Tamim H, Prevalence of self-reported cardiovascular risk factors among Saudi physicians: A comparative studyInt J Health Sci 2013 7(1):03-13.10.12816/000601523559900 [Google Scholar] [CrossRef] [PubMed]
[16]. Ambakederemo Tamaraemumoemi E, Chikezie UE, Assessment of some traditional cardiovascular risk factors in medical doctors in Southern NigeriaVascular Health and Risk Management 2018 14:299-309.10.2147/VHRM.S17636130498356 [Google Scholar] [CrossRef] [PubMed]
[17]. Beck M, Checking up on the doctor: what patients can learn from the way physicians take care of themselvesWall Street J 2010 Available from: https://www.wsj.com/articles/SB10001424052748704113504575264364125574500. Accessed October 1, 2014 [Google Scholar]
[18]. Alarjan JF, Hindawi OS, Judge LW, Aleyadh ZA, Bellar DM, Prevalence of obesity and behaviors associated with the development of metabolic disease among medical practitioners in JordanJ Educ Health Promot 2015 4:1710.4103/2277-9531.15403625861662 [Google Scholar] [CrossRef] [PubMed]
[19]. Balkau B, Deanfield JE, Despres JP, Bassan JP, Fox KAA, Smith SC, International Day for the Evaluation of Abdominal Obesity (IDEA): A study of WC, cardiovascular disease, and diabetes mellitus in 168 000 primary care patients in 63 countriesCirculation 2007 116(17):1942-51.10.1161/CIRCULATIONAHA.106.67637917965405 [Google Scholar] [CrossRef] [PubMed]
[20]. Dankyau M, Shu’aibu JA, Oyebanji AE, Mamven OV, Prevalence and correlates of obesity and overweight in healthcare workers at a tertiary hospitalJ Med Trop 2016 18:55-59.10.4103/2276-7096.188533 [Google Scholar] [CrossRef]
[21]. Welborn TA, Dhaliwal SS, Preferred clinical measures of central obesity for predicting mortalityEur J Clin Nutr 2007 61(12):1373-79.10.1038/sj.ejcn.160265617299478 [Google Scholar] [CrossRef] [PubMed]
[22]. Ononamadu CB, Ezekwesili CN, Onyeukwu OF, Umeoguaju UF, Ezeigwe OC, Ihegboro GO, Comparative analysis of anthropometric indices of obesity as correlates and potential predictors of risk for hypertension and prehypertension in a population in NigeriaCardiovasc J Afr 2017 28(2):92-97.10.5830/CVJA-2016-06127701484 [Google Scholar] [CrossRef] [PubMed]
[23]. Schneider HJ, Friedrich N, Klotsche J, Pieper L, Nauck M, John U, The predictive value of different measures of obesity for incident cardiovascular events and mortalityJ Clin Endocrinol Metab 2010 95(4):1777-85.10.1210/jc.2009-158420130075 [Google Scholar] [CrossRef] [PubMed]
[24]. Frank E, Physician health and patient careJAMA 2004 291(5):63710.1001/jama.291.5.63714762049 [Google Scholar] [CrossRef] [PubMed]
[25]. Frank E, Breyan J, Elon L, Physician disclosure of healthy personal behaviors improves credibility and ability to motivateArch Fam Med 2000 9(3):287-90.10.1001/archfami.9.3.28710728118 [Google Scholar] [CrossRef] [PubMed]
[26]. Bleich SN, Bennett WL, Gudzune KA, Cooper LA, Impact of physician BMI on obesity care and beliefsObesity 2012 20(5):999-1005.10.1038/oby.2011.40222262162 [Google Scholar] [CrossRef] [PubMed]
[27]. Rogers LQ, Gutin B, Humphries MC, Lemmon CR, Waller JL, Baranowski T, Evaluation of internal medicine residents as exercise role models and associations with self-reported counseling behavior, confidence, and perceived successTeach Learn Med 2006 (3):215-21.10.1207/s15328015tlm1803_516776608 [Google Scholar] [CrossRef] [PubMed]
[28]. Kreuter MW, Chheda SG, Bull FC, How does physician advice influence patient behavior? Evidence for a priming effectArch Fam Med 2000 9(5):426-33.10.1001/archfami.9.5.42610810947 [Google Scholar] [CrossRef] [PubMed]
[29]. Kyle RG, Wills J, Mahoney C, Hoyle L, Kelly M, Atherton IM, Obesity prevalence among healthcare professionals in England: A cross-sectional study using the Health Survey for EnglandBMJ Open 2017 7(12):e01849810.1136/bmjopen-2017-01849829203505 [Google Scholar] [CrossRef] [PubMed]
[30]. Iwuala SO, Ayankogbe OO, Olatona FA, OkparaIgwe U, Sabir AA, Fasanmade OA, Obesity among health service providers in Nigeria: Danger to long term health worker retention?Pan Afr Med J 2015 22:110.11604/pamj.2015.22.1.558626600902 [Google Scholar] [CrossRef] [PubMed]
[31]. Yenagoa Local Government Area in Nigeria. National Population Commission of Nigeria and National Bureau of Statistics. (Accessed 2015 March 17) https://www.citypopulation.de/php/nigeria- admin.php?adm2id=NGA006008 [Google Scholar]
[32]. Bayelsa State government Strategic Health Development plan (2010-2015) https://docplayer.net/1887540-Bayelsa-state-government-strategic-health-development-plan-2010-2015-bayelsa-state-ministry-of-health.html [Google Scholar]
[33]. Major I, Bayelsa state health service scheme and health care delivery service in Yenagoa, Bayelsa state, NigeriaEquatorial Journal of Social Sciences and Human Behaviour 2017 2(1):10-24. [Google Scholar]
[34]. Kish L, Survey Sampling 1965 New YorkJohn Wiley and Sons [Google Scholar]
[35]. The WHO STEPwise approach to Surveillance of non-communicable diseases (STEPS); 2018. Available from: http://www.who.int/chp/steps/en. Accessed July 31, 2018 [Google Scholar]
[36]. JNC 7. National High Blood Pressure Education ProgramThe Seventh report of the Joint National Committee on Prevention, Detection, Evaluation and Treatment of High Blood PressureHypertension 2003 42:1206-52.10.1161/01.HYP.0000107251.49515.c214656957 [Google Scholar] [CrossRef] [PubMed]
[37]. World Health OrganizationWaist Circumference and Waist-Hip Ratio: Report of a WHO Expert Consultation 2008 Geneva:08-11. [Google Scholar]
[38]. Ashwell M, Gibson S, Waist-to-height ratio as an indicator of ‘early health risk’: Simpler and more predictive than using a ‘matrix’ based on BMI and waist circumferenceBMJ Open 2016 6:e01015910.1136/bmjopen-2015-01015926975935 [Google Scholar] [CrossRef] [PubMed]
[39]. Unger T, Borghi C, Charchar F, Khan NA, Poulter NR, Prabhakaran D, 2020 International Society of Hypertension Global Hypertension Practice GuidelinesHypertension 2020 75:1334-57.10.1161/HYPERTENSIONAHA.120.1502632370572 [Google Scholar] [CrossRef] [PubMed]
[40]. Judith A Whitworth, World Health Organization2003 World Health Organization (WHO)/International Society of Hypertension (ISH) statement on management of hypertension. World Health Organization (WHO)/International Society of Hypertension Writing GroupJ Hypertens 2003 21(11):1983-92.10.1097/00004872-200311000-0000214597836 [Google Scholar] [CrossRef] [PubMed]
[41]. Lee CJ, Ryu J, Kim HC, Ryu DR, Ihm SH, Kim YJ, Clinical Benefit of Treatment of Stage-1, Low-Risk Hypertension Korean National Health Insurance DatabaseHypertension 2018 72:1285-93.10.1161/HYPERTENSIONAHA.118.1178730571236 [Google Scholar] [CrossRef] [PubMed]
[42]. Rothman KJ, BMI-related errors in the measurement of obesityInt J Obes 2008 32:S56-59.10.1038/ijo.2008.8718695655 [Google Scholar] [CrossRef] [PubMed]
[43]. Gallagher D, Visser M, Sepulveda D, Pierson RN, Harris T, Heymsfield SB, How useful is body mass index for comparison of body fatness across age, sex, and ethnic groups?Am J Epidemiol 1996 143:228-39.10.1093/oxfordjournals.aje.a0087338561156 [Google Scholar] [CrossRef] [PubMed]
[44]. Ghesmaty Sangachin G, Cavuoto LA, Wang Y, Use of various obesity measurement and classification methods in occupational safety and health research: A systematic review of the literatureBMC Obesity 2018 5:2810.1186/s40608-018-0205-530410773 [Google Scholar] [CrossRef] [PubMed]
[45]. Pischon T, Boeing H, Hoffmann K, Bergmann M, Schulze MB, Overvad General and abdominal adiposity and risk of death in EuropeN Engl J Med 2008 359:2105-20.10.1056/NEJMoa080189119005195 [Google Scholar] [CrossRef] [PubMed]
[46]. Casanueva FF, Moreno B, Rodríguez-Azeredo R, Massien C, Conthe P, Formiguera X, Relationship of abdominal obesity with cardiovascular disease, diabetes and hyperlipidaemia in SpainClin Endocrinol (Oxf) 2010 73(1):35-40.10.1111/j.1365-2265.2009.03727.x19832855 [Google Scholar] [CrossRef] [PubMed]
[47]. Batsis JA, Sahakyan KR, Rodriguez-Escudero JP, Bartels SJ, Somers VK, Lopez-Jimenez F, Normal weight obesity and mortality in United States subjects >/=60 years of age (from the Third National Health and Nutrition Examination Survey)Am J Cardiol 2013 112(10):1592-98.10.1016/j.amjcard.2013.07.01423993123 [Google Scholar] [CrossRef] [PubMed]
[48]. Batsis JA, Singh S, Lopez-Jimenez F, Anthropometric measurements and survival in older Americans: results from the third national health and nutrition examination surveyJ Nutr Health Aging 2014 18(2):123-30.10.1007/s12603-013-0366-324522462 [Google Scholar] [CrossRef] [PubMed]
[49]. International Diabetes Federation criteria for ethnic or country-specific values for waist circumference IDF. The IDF Consensus Worldwide Definition of the Metabolic Syndrome. International Diabetes Federation (IDF); 2006. Available from: https://www.pitt.edu/~super1/Metabolic/IDF1.pdf. Accessed June 21, 2018 [Google Scholar]
[50]. Okosun IS, Cooper RS, Rotimi CN, Osotimehin B, Forrester T, Association of waist circumference with risk of hypertension and type 2 diabetes in Nigerians, Jamaicans, and African-AmericansDiabetes Care 1998 21(11):1836-42.10.2337/diacare.21.11.18369802730 [Google Scholar] [CrossRef] [PubMed]
[51]. Okosun IS, Liao Y, Rotimi CN, Choi S, Cooper RS, Predictive values of waist circumference for dyslipidemia, type 2 diabetes and hypertension in overweight White, Black, and Hispanic American adultsJ Clin Epidemiol 2000a 53(4):401-08.10.1016/S0895-4356(99)00217-6 [Google Scholar] [CrossRef]
[52]. Okosun IS, Rotimi CN, Forrester TE, Fraser H, Osotimehin B, Muna WF, Predictive value of abdominal obesity cut-off points for hypertension in Blacks from West African and Caribbean island nationsInt J Obes 2000b 24(2):180-86.10.1038/sj.ijo.080110410702768 [Google Scholar] [CrossRef] [PubMed]
[53]. Battie CA, Borja-Hart N, Ancheta IB, Flores R, Rao G, Palaniappan L, Comparison of body mass index, waist circumference, and waist to height ratio in the prediction of hypertension and diabetes mellitus: Filipino-American women cardiovascular studyPreventive Medicine Reports 2016 4:608-13.10.1016/j.pmedr.2016.10.00327882291 [Google Scholar] [CrossRef] [PubMed]
[54]. Han TS, Sattar N, Lean M, Assessment of obesity and its clinical implicationsBMJ. 2006 333:695-98.10.1136/bmj.333.7570.69517008674 [Google Scholar] [CrossRef] [PubMed]
[55]. Lean MEJ, Han TS, Morrison CE, Waist circumference as a measure for indicating need for weight managementBMJ 1995 31:158-61.10.1136/bmj.311.6998.1587613427 [Google Scholar] [CrossRef] [PubMed]
[56]. Pouliot MC, Després JP, Lemieux S, Bouchard C, Tremblay A, Nadeau A, Waist circumference and abdominal sagittal diameter: Best simple anthropometric index of abdominal visceral adipose tissue accumulation and related cardiovascular risk in men and womenAm J Cardiol 1994 73:460-68.10.1016/0002-9149(94)90676-9 [Google Scholar] [CrossRef]
[57]. McGrae McDermott M, The international pandemic of chronic cardiovascular diseaseJAMA 2007 297:1253-55.10.1001/jama.297.11.125317374819 [Google Scholar] [CrossRef] [PubMed]
[58]. Siren R, Johan G, Eriksson JG, Vanhanen H, Waist circumference a good indicator of future risk for type 2 diabetes and cardiovascular diseaseBMC Public Health 2012 12:63110.1186/1471-2458-12-63122877354 [Google Scholar] [CrossRef] [PubMed]
[59]. Bosomworth NJ, Normal-weight central obesity: Unique hazard of the toxic waistCanadian Family Physician 2019 65 [Google Scholar]
[60]. Shields M, Tremblay MS, Connor Gorber S, Janssen I, Abdominal obesity and cardiovascular disease risk factors within body mass index categoriesHealth Rep 2012 23(2):07-15. [Google Scholar]
[61]. Csige I, Ujvárosy D, Szabó Z, Lörincz I, Paragh G, Harang M, The Impact of Obesity on the Cardiovascular SystemJournal of Diabetes Research 2018 2018:340730610.1155/2018/340730630525052 [Google Scholar] [CrossRef] [PubMed]
[62]. Barroso TA, Marins LB, Alves R, Gonçalves ACS, Barroso SG, de Souza Rocha G, Association of central obesity with the incidence of cardiovascular diseases and risk factorsInt J Cardiovasc Sci Rio de Janeiro 2017 30(5)10.5935/2359-4802.20170073 [Google Scholar] [CrossRef]
[63]. Abolfotouh MA, Sallam SA, Mohammed MS, Loutfy AA, Hasab AA, Prevalence of elevated blood pressure and association with obesity in Egyptian school adolescentsInternational Journal of Hypertension 2011 2011:95253710.4061/2011/95253721423685 [Google Scholar] [CrossRef] [PubMed]
[64]. Jayawardana R, Ranasinghe P, Sheriff MH, Matthews DR, Katulanda P, Waist to height ratio: A better anthropometric marker of diabetes and cardio-metabolic risks in south Asian adultsDiabetes Res Clin Pract 2013 99(3):292-99.10.1016/j.diabres.2012.12.01323298662 [Google Scholar] [CrossRef] [PubMed]
[65]. Ashwell M, Cole TJ, Dixon AK, Ratio of waist circumference to height is strong predictor of intra-abdominal fatBMJ 1996 313:559-60.10.1136/bmj.313.7056.559d8790002 [Google Scholar] [CrossRef] [PubMed]
[66]. Park SH, Choi SJ, Lee KS, Park HY, Waist circumference and waist-to-height ratio as predictors of cardiovascular disease risk in Korean adultsCirc J 2009 73:1643-50.10.1253/circj.CJ-09-016119638708 [Google Scholar] [CrossRef] [PubMed]
[67]. Aekplakorn W, Kosulwat V, Suriyawongpaisal P, Obesity indices and cardiovascular risk factors in Thai adultsInt J Obes 2006 30:1782-90.10.1038/sj.ijo.080334616619055 [Google Scholar] [CrossRef] [PubMed]