The late fall and winter of 2019 saw the global outbreak of the novel coronavirus strain emerging from Wuhan, China [1], challenging national public health responses across the world. Fundamental to controlling and understanding the spread of the virus throughout the community is a well-established laboratory testing and surveillance program. During the course of the outbreak, the United States Food and Drug Administration (FDA) issued numerous EUA, including a real-time Reverse-Transcriptase Polymerase Chain Reaction (rRT-PCR) assay developed by the US Centers for Disease Control and Prevention (CDC) [2]. This assay is now widely used throughout the Department of Defense and numerous civilian sector healthcare and public health facilities.
Briefly, the laboratoty test relies upon the qualitative detection of nucleic acid from SARS-CoV-2 from upper and lower respiratory specimens (e.g., nasopharyngeal/oropharyngeal swab, bronchoalveolar lavage). The collecting healthcare provider then places the specimen into a stabilising medium, commonly called as Viral Transport Medium (VTM). Those samples are then shipped to molecular laboratories for processing and clinical diagnostic test. However, this standardised supply chain process is shared commonly with the global civilian testing centers since all clinical labs must adhere to the FDA guidelines. The global supply chain for all sample collection, processing, and testing materials has been severely degraded during the COVID-19 pandemic [3]. The supply chain issues extend beyond the molecular testing supplies to include the VTM required to ship samples from hospitals to labs [4].
The current CDC guidance lists Amies transport medium and sterile PBS as options to VTM [5] but there is a limited documentation on the performance of these when used for SARS-CoV-2 testing. With only three viable alternatives, there is a clear need to investigate other options. Additionally, sterile PBS does not contain any stabilising agents and the viability of samples for testing after prolonged shipping times poses a concern. Recent evidence suggests that the stabilisation agent Invitrogen RNAlater™ may be used to prolong RNA virus stability for downstream molecular testing [6]. Furthermore, viral infectivity remains high when samples are stored in RNAlater™ for over 30 days at -80°C, 4°C, or room temperature, suggesting the highly protective and stabilising nature of RNAlater™ [7]. Also RNAlater™ has been shown to be protective of the H5N1 highly pathogenic avian influenza virus in fecal homogenate [8]. Finally, recent evidence suggests that RNAlater™ can be used to stabilise RNA from salivary collection approaches used in the clinic for a wide range of potential uses, including pathogen detection [9].
Materials and Methods
The study was designed as a synthetic molecular test without human subjects. Two patient-derived specimens were used in confirmatory testing as described below. The study took place in April 2020 at the United States Air Force School of Aerospace Medicine in Dayton, Ohio, USA. This study was determined as part of a public health response activity by the Air Force Research Laboratory Institutional Review Board (FWR20190037N).
The approach was based on the CDC 2019-Novel Coronavirus (2019-nCoV) Real-Time RT-PCR Diagnostic Panel [2] to ensure method of standardisation for clinical uniformity. The ability to detect viral RNA diluted into RNAlater™ and PBS were compared to a VTM reference over a course of 3 days at 2-8°C and included a single freeze-thaw cycle to simulate conditions during shipment.
Sample Preparation
The invitro transcribed SARS-CoV-2 RNA standard, available from the CDC (10,000 copies/μL), was directly diluted to 300 copies/μL in respective medium (VTM, PBS, or RNAlater™) and then diluted serially 1:3 to 0.9 copies/μL in each respective medium. The amount of RNA in the final reaction volumes were 75, 25, 8.3, 2.8, and 0.9 copies/μL. The CDC indicates a limit of detection for the assays as one copy/μL. The 5-point concentration series was then aliquoted into 500 μL samples and stored at 2-8°C for RNA extraction at 0 hour, 24 hour, 48 hour, and 72 hour post dilution. An additional 500 μL sample was placed on dry ice immediately following dilution to simulate overnight shipping. A medium-only sample for each time point was served as a negative process control for all the tests. The VTM used was the Remel MicroTest M4RT (Cat # R12552), the PBS used was from Gibco (Cat # 10010-023) and RNAlater™ was purchased from Qiagen (Cat # 1018087), this product is now discontinued in that name and is available from Qiagen as RNAprotect Tissue Reagent (Cat # 76106) [10].
RNA Extraction
RNA was extracted from the samples using a single QIAamp Viral RNA Mini kit (Qiagen, Cat #52906) following the manufacturer’s package insert. The input volume was 140 μL and each sample was extracted in triplicate. Extractions were performed independently and the extracted RNA was stored at -80°C until use for PCR. This ensured that all samples received identical treatment throughout the process.
Thermocycling Preparation and Parameters
Thermocycling reactions conditions were per the CDC 2019-Novel Coronavirus (2019-nCoV) Real-Time RT-PCR Diagnostic Panel EUA Instructions For Use (IFU) [2]. After manual extraction with the EUA validated kit, RNA was introduced to the version 2 EUA assays purchased from IDT (Cat #10006606). The N3 target was not included as the version 3 EUA IFU eliminated this assay target from recommended testing. The sequences for the N1 forward primer, reverse primer, and dual probes used were (5’>3’) GACCCCAAAATC AGCGAAAT, TCTGGTTACTGCCAGTT GAATCTG, FAM-ACCCCGCATTACGTTTGGTGGACC-BHQ1, and FAM-ACCCCGCAT/ZEN/TACGTTTGGTGGACC-3IABkFQ, respectively. For the N2 target the sequences were TTACAAACATT GGCCGCAAA, GCGCGACATTCCGAAGAA, FAM-ACAATTTGCCC CCAGCGCTTCAG-BHQ1, and FAM-ACAATTTGC/ZEN/CCCCAG CGCTTCAG-3IABkF, respectively. Finally, the internal control (human RNAse P) sequences used were AGATTTGGACCTG CGAGCG, GAGCGGCTGTCTCCACAAGT, FAM-TTCTGACCTGAA GGCTCTGCGCG-BHQ-1, and FAM-TTCTGACCT/ZEN/GAAGGCT CTGCGCG-3IABkFQ, respectively.
The mastermix was TaqPath 1-step RT-qPCR Master Mix, CG (Thermofisher, A15299) for all samples in 20 μL final reaction volumes (8.5 μL nuclease-free water, 1.5 μL primer/probe mix, 5 μL Master Mix, and 5 μL sample RNA). Three pre-cycling stages were used: 2 minutes at 25°C, 15 minutes at 50°C for reverse transcription, 2 minutes at 95°C for heat inactivation of reverse transcriptase and heat activation of the DNA polymerase. Following the hot-start stage, 45 cycles were used of 3 seconds at 95°C and 30 seconds at 55°C in standard mode on an ABI 7500 FAST (Thermo Fisher). Although the master mix did include ROX as a passive reference dye, in accordance with CDC guidelines, a passive reference was not used in data acquisition. Each plate also included a No Template Control (NTC) well for each assay to serve as an amplification control. In accordance with the CDC EUA IFU, amplification was positive if the Cycle threshold (Ct) was below 40.
Statistical Analysis
PCR performance of PBS and RNAlater™ was compared against the reference VTM. Ct values were averaged from triplicate concentration-condition samples. Differences in the PCR performance of the SARS-CoV-2 assays in the respective media were determined using two-way analyses of variance and goodness of fit comparisons from non-linear first-order exponential regression fits.
Each SARS-CoV-2 target in the EUA assay were compared independently using GraphPad Prism 7.0c and mean values with the standard deviation were reported. Concentration versus Ct data were fit using a first-order exponential regression {Ct=(Ct0-A) e-K*(RNA)+A}, where A is a fit parameter relative to the plateau and gap, and K is a fit parameter relative to the concentration in the experiment. Differences in performance over time were calculated using a repeated measures two-way ANOVA correcting for multiple comparisons for each alternative medium and assay with the immediate addition (0 hours) as the reference and a 5% false discovery rate approach according to the two-stage step-up method [11]. When necessary for use in the two-way ANOVA, missing values were imputed with non-linear regression predicted values. Mean values with the standard deviation are reported.
Results
PCR Results for VTM
The goal was to compare viral RNA storage in PBS or RNAlater™ with storage in VTM. Unexpectedly, VTM was not suitable for RNA storage, likely due to the presence of RNA degrading enzymes. For example, the initial PCR resulted in undetectable signals, with Ct values less than 40 for all dilutions except 75 copies/μL (N1 average values 34.6±0.5, N2 average 35.3±1.3, Rp average 34.3±0.1). To confirm this result, the experiment was repeated with a different lot of VTM from the same manufacturer, as well as two separate lots of Universal Transport Medium (UTM) from a different manufacturer. The Ct values for all dilutions in these three additional media were higher than expected (N1 values of 33.5±0.4, 28.1±0.9, and 31.0±0.6), again indicating that transport media are not suitable for RNA storage.
Two laboratory-confirmed remnant deidentified positive patient samples were used as diluent for purified RNA to determine if the transport media were degrading the positive RNA control [Table/Fig-1]. The samples were diluted directly into each of the four media (VTM, UTM, RNAlater™, or PBS) or the RNA was purified from the sample and then diluted into the media (labelled “Sample” and “Extract” in [Table/Fig-1], respectively). The crude positive patient samples (containing live, intact virus) showed consistent Ct values, whereas the PCR only detected 1 of 4 tests when extracted RNA was directly diluted into transport media. Therefore, using transport media appears to be inappropriate in studies where specimens may have been lysed prior to addition to the media.
N1 Ct values for unextracted, intact samples and extracted RNA from remnant deidentified positive patients (labelled as “Sample #” and “Extract #”, respectively).
| Variables | Sample 1 | Extract 1 | Sample 2 | Extract 2 |
|---|
| VTM | 21.29 | Undetected | 30.11 | Undetected |
| UTM | 24.53 | 30.42 | 30.40 | Undetected |
| RNAlater | 23.99 | 24.36 | 30.44 | 30.93 |
| PBS | 24.41 | 24.54 | 27.44 | 30.53 |
PCR Results for PBS
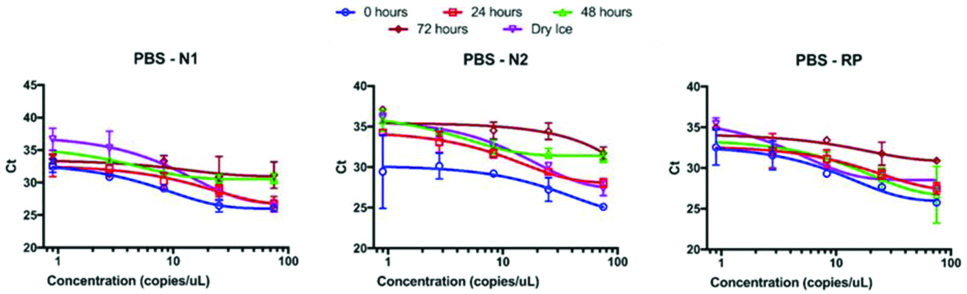
RNA was detectable in all samples diluted into PBS immediately after preparation. The Ct values for the highest RNA concentration tested (75 copies/μL) were 26.0±0.3, 25.1±0.3, and 25.8±0.3 for N1, N2, and Rp, respectively. When fit to a first order exponential curve, the curves visually fit well ([Table/Fig-2], blue circles) and the goodness of fit r2 values for N1 and Rp were 0.95 and 0.83, respectively, but the goodness of fit r2 for N2 was only 0.60. The Ct values observed for 0.9 copies/μL included an outlier of 26.2 compared to one at 32.6 and a failed third replicate for N2. The triplicate values for 2.8 copies/μL were 31.9, 28.9, and 29.5 for N2, so masking the low Ct value from 0.9 copies/μL resulted in a goodness of fit r2 value of 0.83, indicating a well performing assay condition. The performance of the three assays exhibited significant time-dependence, as after 24 hours the Ct values began to shift upward and the data became more variable (discussed below in greater detail). The negative control extractions and NTCs did not amplify in any condition for any assay.
Ct value vs. RNA copies for samples in PBS. All three assays exhibited degraded reliability and analytic sensitivity from 0 hours (blue circles) to 72 hours (brown diamonds). Samples exposed to a freeze-thaw cycle (dry ice, purple inverted triangles) also performed poorly compared to 0 hours.
PCR Results for RNAlater™
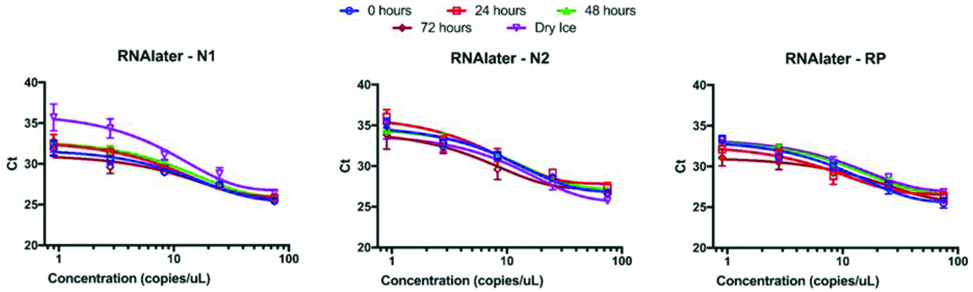
Samples diluted in RNAlater™ displayed similar behaviour to PBS immediately upon dilution. The Ct values of 75 copies/μL of RNA were 25.4±0.1, 26.7±0.2, and 25.5±0.6 for N1, N2, and Rp, respectively. Additionally, the exponential curve fits were visually tight ([Table/Fig-3], blue circles) and the goodness of fit r2 values were 0.94, 0.96, and 0.95, respectively. Assay performance was largely unaffected by exposure to refrigeration at 4°C over three days and freeze-thaw. The exceptions were the low RNA copy values near the limit of detection after exposure to dry ice. The negative control extractions and NTCs did not amplify in any condition for assays.
Ct value vs. RNA copies for samples in RNAlater. All three assays exhibited consistent reliability and performance over time. Only the N1 assay with low amounts of RNA was negatively impacted by a freeze thaw cycle (top panel, purple inverted triangles).
PCR Results Comparison between PBS and RNAlater™
The average goodness-of-fit coefficient of variation for RNAlater™ samples across time was consistently below 5%, whereas the CVs seen in PBS samples was consistently above 11% [Table/Fig-4]. Furthermore, when one considers the assay-specific variability over time, the RNAlater™ fits were consistently good within assays (average r2=0.94, CVs <5%), whereas for PBS the fits were poor and variable (r2 between 0.7 and 0.81, CVs >15%).
Goodness-of-fit comparison by assay, medium, and time.
| Variables | Time interval | N1 r2 | N2 r2 | RP r2 | Time-dependent variation |
|---|
| | | | | Average r2 | Deviation | CV |
|---|
| RNAlater | 0 hour | 0.943 | 0.959 | 0.953 | 0.95 | 0.01 | 0.8% |
| 24 hours | 0.957 | 0.923 | 0.885 | 0.92 | 0.04 | 3.9% |
| 48 hours | 0.973 | 0.961 | 0.985 | 0.97 | 0.01 | 1.2% |
| 72 hours | 0.895 | 0.866 | 0.928 | 0.90 | 0.03 | 3.5% |
| Dry Ice | 0.931 | 0.979 | 0.960 | 0.96 | 0.02 | 2.5% |
| PBS | 0 hour | 0.953 | 0.603 | 0.834 | 0.80 | 0.18 | 22.3% |
| 24 hours | 0.848 | 0.943 | 0.746 | 0.85 | 0.10 | 11.7% |
| 48 hours | 0.764 | 0.867 | 0.639 | 0.76 | 0.11 | 15.1% |
| 72 hours | 0.026 | 0.688 | 0.617 | 0.44 | 0.36 | 81.9% |
| Dry ice | 0.884 | 0.958 | 0.886 | 0.91 | 0.04 | 4.6% |
| Assay-dependent variation | | | |
| RNAlater | Average r2 | 0.94 | 0.94 | 0.94 | | | |
| Deviation | 0.03 | 0.04 | 0.04 | | | |
| CV | 3.1% | 4.8% | 4.0% | | | |
| PBS | Average r2 | 0.70 | 0.81 | 0.74 | | | |
| Deviation | 0.38 | 0.16 | 0.12 | | | |
| CV | 54.7% | 19.5% | 15.8% | | | |
In the ANOVA results for PBS, the time/condition factor accounted for 20.7%, 44.3%, and 17.0% of the variance in the data for N1, N2, and Rp assays, respectively. In contrast, the effect of time was much less in RNAlater™ samples. The respective values were 11.6%, 2.95%, and 4.50% of the variance could be explained by time/condition. For the N1 assay in RNAlater™, multiple comparisons revealed that the variance is mostly affected by the dry ice condition. When those data were masked from the ANOVA, time accounted for only 2.60% of the data variance and significant differences as measured by a 5% false discovery rate were observed at 0.9, 2.8, and 8.3 copies.
Discussion
As expected, the performance of the PCR assay became highly variable over time in samples prepared in PBS. [Table/Fig-2] shows this variability visually, but the degree to which the data degrading quality became most obvious when assessing the fit parameters. Specifically, comparing the goodness-of-fit values demonstrates the increased variability, and therefore the decreased reliability, of samples prepared in PBS compared against those in RNAlater™ [Table/Fig-4]. The average goodness-of-fit coefficient of variation for RNAlater™ samples across time was consistently below 5%, whereas the CVs seen in PBS samples was consistently above 11%. Only for the freeze-thaw cycle the fits are consistently good for samples in PBS. Furthermore, when one considers the assay-specific variability over time, the RNAlater™ fits were consistently good within assays (average r2=0.94, CVs <5%), whereas for PBS the fits were poor and variable (r2 between 0.7 and 0.81, CVs >15%). These observations suggest that RNA degrades over time in PBS and that RNAlater™ permits reliable data acquisition.
These ANOVA results further corroborate the high variability in the PBS data and the consistency of the RNAlater™ data. For PBS, the time/condition factor accounted for 20.7%, 44.3%, and 17.0% of the variance in the data for N1, N2, and Rp assays, respectively. In contrast, the effect of time was much less in RNAlater™ samples. Taken together, these observations are consistent with the difference between the dry ice curve and all others in RNAlater™ N1 [Table/Fig-3], and suggest that the limit of detection of the assay is being affected by a freeze-thaw cycle.
The results showing that a freeze/thaw cycle does not impact results for specimens prepared in PBS is consistent with other research [6,12,13]. Kohl C et al., used a next generation sequencing assay, which are often more sensitive to RNA degradation than RT-PCR assays, and successfully sequenced snap frozen Sendai virus samples [6]. When sequenced, a naïve sample (unextracted) resulted in 4 reads covering 6% of the genome. In contrast, the snap frozen PBS sample yielded more than 136,000 reads covering 88.1% of the genome. Samples stored in RNAlater™ at room temperature for 7 days yielded better performance than snap frozen RNA (more than 198,000 reads, 98.8% genome coverage).
RNAlater™ and similar RNA protecting reagents are designed to explicitly enable molecular testing of RNA. One positive feature of RNAlater™ is that it too enables microbiology and virology testing [7]. Taken together, our SARS-CoV-2 rRT-PCR results suggest using RNAlater™ or snap frozen PBS for sample collection and transport. Additionally, adding RNAse inhibitors to buffered saline solutions could also enhance the effectiveness of PBS as a viable VTM substitute.
Limitation(s)
A limitation of this study is that VTM could not be compared to PBS and RNAlater™ directly over the entire time course because of the RNA degradation in transport media. During the course of the study, another laboratory noticed a similar problem during VTM lot validation (unpublished), suggesting that the issue is inherent to VTM and not laboratory dependent. VTM and other transport media are optimised for preserving the viability of the virus from patient samples for use in molecular and microbiology testing at clinical laboratories. Another limitation is that only purified RNA was used rather than patient samples and matrices. Therefore, further testing is required for validation in patient use. The use of RNAlater™ as a transport medium will require further validation by individual labs before it can be fully implemented in accordance with regulatory requirements.
Conclusion(s)
These results suggests that RNAlater™ and sterile PBS are suitable alternatives to VTM for transporting frozen samples from medical treatment facilities to reference laboratories for use in the CDC 2019-Novel Coronavirus (2019-nCoV) Real-Time RT-PCR Diagnostic Panel. If long-term (>24 hours at 4°C) or non-frozen shipping is desired, then RNAlater™ is a suitable alternative to VTM and PBS is not appropriate. From these results, it can be recommended that EUA developers consider the validation of RNAlater™ or PBS as an alternative method for sample preparation in all EUAs submitted to the FDA for use in the COVID-19 response. Furthermore, including language in EUA submissions stating that if samples are not collected in RNAlater™, they be treated with RNAlater™ in accordance with manufacturer’s guidelines to stabilise the samples for transportation. Finally, the authors recommend that clinical laboratories consider studies to update their sample submission, preparation, and accession guidelines to include optional, though recommended, addition of RNAlater™ to all samples prepared for viral testing.