During orthodontic treatment, fixed appliances remain in the oral cavity for relatively long periods of time, and are exposed to a variety of chemical and physical influences that may affect their properties and subsequently affect the treatment [1]. Fluctuation of salivary pH and composition is a well-recognised factor that affects teeth as well as orthodontic appliances. Human saliva has an average pH of 6.75. However, the pH of the oral environment can be changed by either extrinsic factors like dietary products and fermentation of sugars into acids, or intrinsic factors like acid regurgitation into the oral cavity [1,2]. A salivary pH of 5.5 or below is considered critical, but could be sufficient to cause corrosion of metals [2]. Food and beverage intakes lead to salivary pH fluctuation between 2.2 and 8.5 thereby, affecting the mechanical characteristics and contributing to the corrosion of orthodontic appliances [3].
Acid regurgitation into the oral cavity can be caused by gastro-oesophageal reflux disease, a common chronic gastro-oesophageal disease [4]. Gastric acid with pH 1.2 can reflux into the oesophagus and oral cavity, leading to intraoral pH decreases that are markedly below the critical pH for enamel and contribute to erosive damage of teeth, oral soft tissues, and intraoral appliances [5]. Sufficient salivary flow and salivary buffering capacity act as antagonists to acid attack [6,7]. However, patients with gastro-oesophageal reflux disease tend to have sudden and involuntary onset of acid regurgitation, creating insufficient time for the salivary buffering capacity to act before damage occurs [8]. With the global increase in adult patients seeking orthodontic treatment, acid regurgitation has become an important factor that needs to be addressed.
The most efficient outcome of orthodontic treatment is directly related to the ability of orthodontic archwires to slide through their bracket slot. When sliding mechanics are used, the only forces that contract tooth movement are frictional forces resulting from interactions at bracket-archwire interfaces. Therefore, frictional resistance should be minimised to achieve effective tooth movement [9]. During orthodontic treatment, the brackets and archwires are exposed to the acidic environment of the oral cavity, which affects their physical and mechanical properties [3]. The surface properties of orthodontic wires, such as topography, hardness and roughness can affect the frictional forces generated during orthodontic sliding mechanics, and reduce the clinical efficacy of these wires [9].
Several studies have investigated the effects of acidic environments on the properties and surface characteristics of orthodontic wires [10-20], including corrosion resistance [10], metal ion release [11,12], surface roughness [13-15], nano hardness [16], bending properties, tensile strength, elasticity modulus, and yield strength [17]. However, few studies have investigated the impact of these surface changes on their behaviour [12,18-20]. Therefore, it is valuable to undertake in vitro studies that examine the effects of exposure of orthodontic archwires to different pH levels in terms of surface topography, surface roughness, and frictional resistance properties. The present study aimed to evaluate the effect of exposure to simulated gastric acid solutions with pH 1.2 and pH 4 on the surface topography, roughness and frictional resistance of commercial SS, nickel titanium (NiTi), and beta-titanium (TMA) archwires.
Materials and Methods
A comparative in vitro study was conducted in College of Dentistry, King Saud University during the period from September 2019 to January 2020. Study approval was obtained from the Institutional Ethics committee of King Saud University under ethical number (E-19-4057; CDRC No. IR 0319).
Study Design
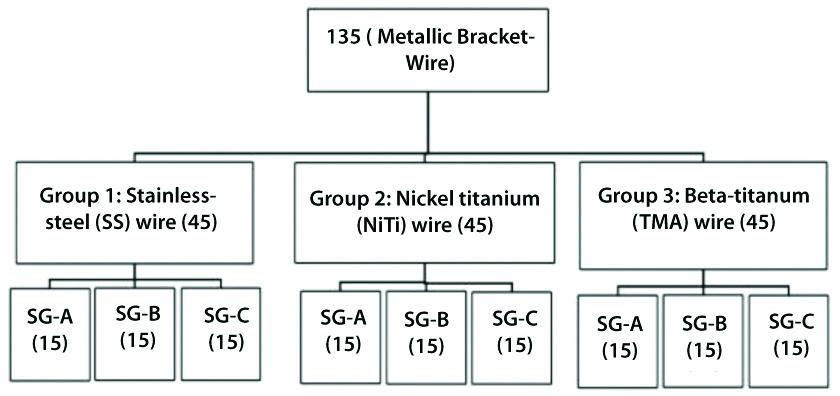
A total of 135 metal orthodontic premolar brackets with 0.022-inch slot Roth prescription of 0 tip and -7 torque (Ortho Organisers, Carlsbad, CA, USA) and 135 orthodontic archwires with dimensions of 0.017×0.025 inches were used. The archwires were divided into three groups of 45 wires according to type: SS (Ortho Organisers), NiTi (Ortho Organisers), and TMA (3M Unitek, Monrovia, CA, USA). Each group were further subdivided into three subgroups of 15 archwires according to the immersed pH solution: control; distilled water pH 6.7 (SG-A), simulated gastric acid pH 4 (SG-B), and simulated gastric acid pH 1.2 (SG-C). Each wire was cut from a straight segment into 6-cm lengths, and tied to its premolar bracket using an elastic module (3M Unitek, CA, USA) [Table/Fig-1]. The groups were colour coded to blind the examiner; each test was done by one examiner. The sample size was adopted using data from previous studies [18,19]. A sample power analysis designated that 15 teeth per subgroup would result in a 90% chance of obtaining significance at the 0.05 level.
Distribution of sample groups.
SG-A, control subgroup (distilled water; pH 6.7); SG-B, Subgroup of wires immersed in simulated gastric acid pH 4; SG-C, Subgroup of wires immersed in simulated gastric acid pH 1.2
Sample Preparation
As received, orthodontic wires were cleaned with de-ionised water using an ultrasonic cleaner, immersed in 70% ethanol for 4-5 s, then washed with de-ionised water, and air-dried to remove any precipitates. This method for removal of any oxide layer that had formed on the alloys during storage was done similar to previous studies [6,10,11]. Each subgroup of wires were then placed in a labelled glass tube filled with distilled water.
Sample Treatment Protocols
Simulated gastric acid solutions with pH 1.2 and pH 4 were prepared in accordance with the British Pharmacopoeia [10,20]. The simulated gastric acid solution with pH 4 was prepared by dissolving 8.954 g of Na2HPO4.12H2O and 3.4023 g of KH2PO4 in 1 L of distilled water, while the simulated gastric acid solution with pH 1.2 was prepared by dissolved 2.0 g of NaCl and 7.0 mL of HCl (concentrated) in 1 L of water.
The study protocol was implemented according to Kulkarni et al., and modified according to Abbate-Daga G et al., to simulate changes in the oral cavity [21,22]. The samples for SG-B and SG-C were immersed in the prepared pH solutions for two minutes, followed by rinsing with distilled water. After the acid treatment, the samples were stored in distilled water at 37°C. The procedure was repeated 6 times a day for 9 days with 24-hours interval between each cycle. The control group was stored in distilled water at 37°C [Table/Fig-2].
Sample treatment protocols.
| SG-A | SG-B | SG-C |
|---|
| Storage in distilled water at 37°C. | 1. Immersion in SG-B (pH 4) for two minutes. | 1. Immersion in SG-C (pH 1.2) for two minutes. |
| 2. Rinsing in distilled water. | 2. Rinsing in distilled water. |
| 3. Storage in distilled water for 30 minutes at 37°C | 3. Storage in distilled water for 30 minutes at 37°C. |
| Procedure repeated 6 times a day × 9 days for each pH group |
SG: Study group
Surface Morphology Examination
Surface morphology was examined by scanning electron microscopy (SEM) using a JSM 6360 LV microscope (JEOL, Tokyo, Japan). All SEM images were taken at 1000× magnification.
Optical Profilometer Evaluation
Surface roughness characterisation and imaging were performed using a Contour GT-K 3D Optical Microscope (Bruker Contour GT, Tucson, AZ, USA) and 3D non contact surface metrology with interferometry. The surface roughness of 10 randomly selected archwires from each subgroup was evaluated. A 5× magnification lens was used with field of view of 1.5×1.5 mm, scan speed of 1×, and thresholding of 3. Samples were placed on the stage and manually adjusted to produce an image with the Vision 64 software (Bruker Corporation, San Jose, CA, USA) used to control the instrument settings, data analyses, and graphical output. The measurements were performed by vertical scanning on the monitor screen. The microscope was equipped with interferometry capability using a broadband light source effective for measuring objects with rough surfaces. Each wire sample was scanned at three selected points. Each point received three interval interferometric scans and was averaged accordingly to determine the average roughness (Ra) value of the specimen [11,17,19,21].
Frictional Resistance Measurement
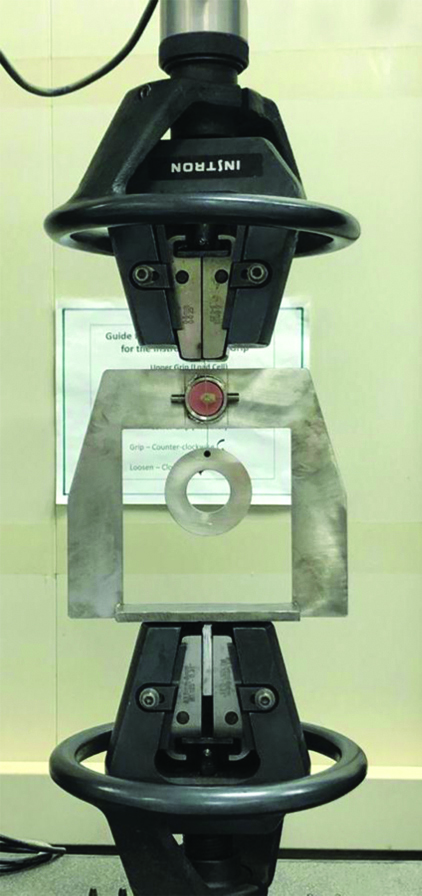
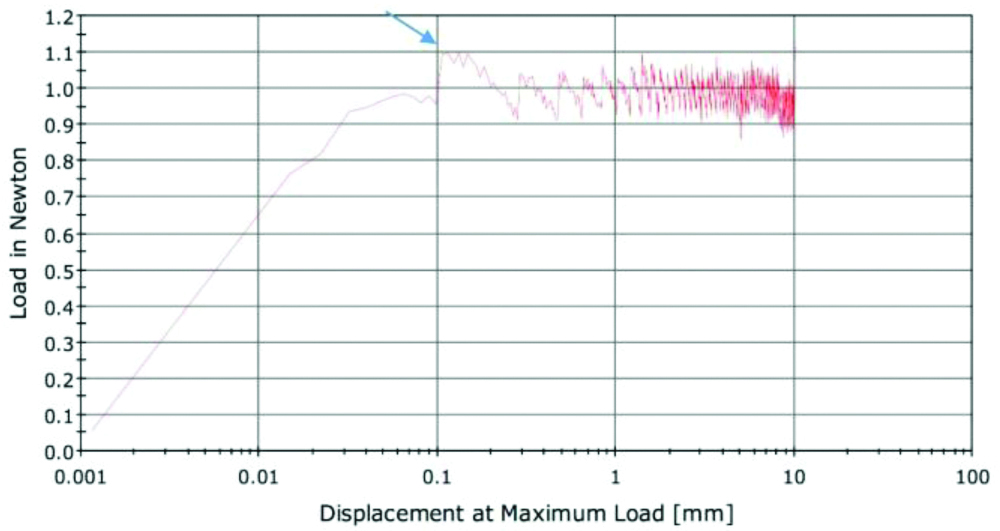
A universal testing machine (Instron 5965 series; North America) was used to test the frictional resistance in a dry field at room temperature of 25°C [Table/Fig-3]. Fifteen wires from each subgroup were examined with a total of 135 non repeated tests. Each wire segment was held in its corresponding mounted bracket slot with an elastic module at the centre to form a test unit. The bracket-wire unit plus mounting template was positioned vertically in the lower jaws of the floor-mounted Instron universal testing machine. The free upper end of the archwire was gripped by the upper jaws of the Instron machine, and connected to a load cell (1.5 N). The testing machine was calibrated by the Instron Calibration Laboratory in terms of crosshead displacement/speed and load cell. The crosshead moving speed was fixed at 5 mm/min for two minutes. The computer software associated with the Instron machine recorded the results on an XY graph, with the X-axis showing the movement of the wire within the bracket (mm/s) and the Y-axis showing the generated force between the bracket and the wire. The static frictional force was taken as the peak of force encountered in the first millimetre of wire displacement within the bracket [Table/Fig-4].
Universal testing machine (Instron machine 5965 series, North America) showing the bracket-wire unit and mounting template was positioned vertically in the lower jaws of the floor-mounted Instron universal testing machine. The free upper end of the archwire was gripped by the upper jaws of the Instron machine and connected to a load cell (1.5 N).
Displacement/load graph demonstrating the initial highest peak of load at 0.1 representing the static frictional resistance.
Statistical Analysis
The collected data were analysed using IBM Statistical Package for the Social Sciences (SPSS) version 25 software (IBM Corp., Armonk, NY, USA). The level of significance for all tests was set at p<0.05. Normality of distribution and homogeneity of variance were examined by the Shapiro test and Levene test, respectively. The tests showed that both normality of distribution and equality of variance were satisfied (p>0.05).
Descriptive statistics, including means, standard deviations, and confidence intervals were calculated for each group. One-way ANOVA was used for comparisons of differences among mean values. If a significant difference (p<0.05) was noted, multiple-group comparisons by Tukey’s post-hoc analysis were performed. The correlation between surface roughness and static friction was examined by Pearson’s correlation coefficient analysis with a level of significance of p≤0.05.
Results
SEM Analysis
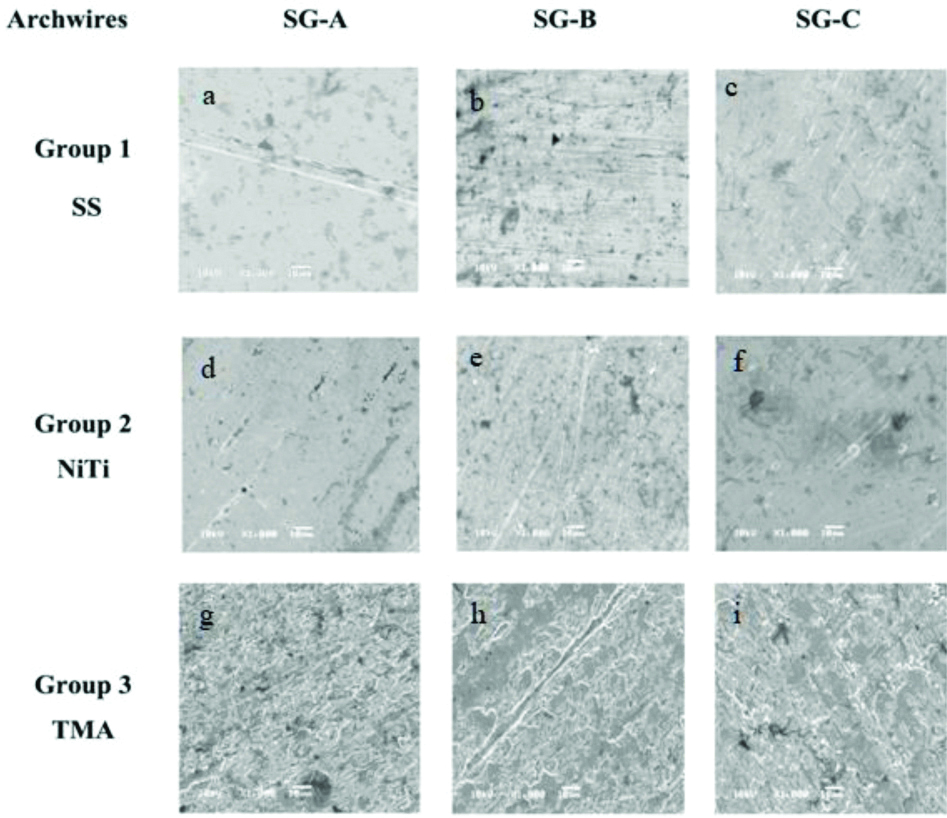
The surface topographies of the wires in the SG-A (control; pH 6.7), SG-B (pH 4), and SG-C (pH1.2) are summarised in [Table/Fig-5]. Each specimen had its own characteristic surface structures. SEM observation of SS wires revealed that those in the control subgroup were smooth, while those in the SG-B pH 4 had more lines and grooves parallel to the long axis of the wire, and those in the SG-C pH 1.2 had slightly more pitting and grooves. Such irregularities were minimum for NiTi wires. However, pitting and grooves were more clearly visible in TMA wires. Specifically, TMA wires in SG-B pH 4 and SG-C pH 1.2 showed more deep grooves than those in the control subgroup.
Scanning electron microscopic images of three groups of orthodontic archwires at 10 kV and x1000 magnification. Group 1; SS, stainless steel: Control (a), immersed in simulated gastric acid pH 4 (b), and pH 1.2 (c). Group 2; NiTi, nickel titanium: Control (d), immersed in simulated gastric acid pH 4 (e), and pH 1.2 (f). Group 3; TMA, beta-titanium: Control (g), immersed in simulated gastric acid pH 4 (h), and pH 1.2 (i).
SG-A, control subgroup (distilled water; pH 6.7); SG-B, subgroup of wires immersed in simulated gastric acid pH 4; SG-C, subgroup of wires immersed in simulated gastric acid pH 1.2
Surface Roughness Analysis
The profilometry data are shown in [Table/Fig-6]. Quantification of surface roughness by profilometry showed significant differences among the SS (p<0.001) and TMA (p=0.003) archwire subgroups. Tukey’s post-hoc analysis revealed significant difference in surface roughness of SS archwires in the SG-C pH 1.2 (p<0.001) and SG-B pH 4 (p=0.005). The same scenario occurred for TMA wires, with significant difference in surface roughness of TMA archwires observed in the SG-C pH 1.2 (p=0.003) and SG-B pH 4 (p=0.012).
Descriptive statistics for surface roughness of the archwires in different pH solutions (n=15 archwires per group).
| Wires | Media | Mean of Ra value (μm) | SD | p-value | Confidence interval | Tukey’s post-hoc test |
|---|
| SG-A | SG-B | SG-C |
|---|
| SS | SG-A | 0.158 | 0.016 | <0.001* | 0.147-0.231 | 1 | | |
| SG-B | 0.179 | 0.021 | 0.164-0.191 | NS | 1 | |
| SG-C | 0.212 | 0.026 | 0.193-0.231 | <0.001* | 0.005* | 1 |
| NiTi | SG-A | 0.305 | 0.013 | 0.824 | 0.296-0.314 | 1 | | |
| SG-B | 0.300 | 0.025 | 0.282-0.318 | NS | 1 | |
| SG-C | 0.301 | 0.021 | 0.286-0.316 | NS | NS | 1 |
| TMA | SG-A | 0.631 | 0.041 | 0.003* | 0.601-0.660 | 1 | | |
| SG-B | 0.723 | 0.081 | 0.666-0.781 | NS | 1 | |
| SG-C | 0.732 | 0.072 | 0.681-0.784 | 0.006* | 0.012* | 1 |
SS: Stainless steel; NiTi: Nickel titanium; TMA: Beta-titanium; NS: Non-significant; SG-A, control subgroup (distilled water; pH 6.7); SG-B, simulated gastric acid pH 4 subgroup; SG-C, simulated gastric acid pH 1.2 subgroup; Ra, average roughness; SD: Standard deviation. Data were analysed by One-way ANOVA. * Refers to significant at p-value ≤0.05
Frictional Resistance Analysis
The frictional resistance data are shown in [Table/Fig-7]. Comparisons of overall mean frictional resistance values showed significant differences within the SS wire subgroups (p=0.005). Tukey’s post-hoc analysis revealed the SS wires in the SG-C pH 1.2 had significantly lower frictional resistance than those in the SG-B pH 4 (p=0.013) and SG-A control (p=0.012). Although not significant, the TMA wires showed decreases in frictional resistance as the pH decreased.
Descriptive statistics of frictional resistance of the archwires in different pH solutions (n=15 per group).
| Wire | Media | Mean FR (gm) | SD | p-value* | Confidence interval | Tukey’s post-hoc Test |
|---|
| SG-A | SG-B | SG-C |
|---|
| SS | SG-A | 139.16 | 39.50 | 0.005* | 117.29-161.02 | 1 | | |
| SG-B | 138.82 | 51.77 | 110.14-167.50 | NS | 1 | |
| SG-C | 97.02 | 14.47 | 88.57-115.65 | 0.012* | 0.013* | 1 |
| NiTi | SG-A | 119.03 | 26.64 | 0.517 | 104.28-133.77 | 1 | | |
| SG-B | 116.10 | 29.15 | 95.26-130.44 | NS | 1 | |
| SG-C | 128.08 | 32.48 | 110.09-146.06 | NS | NS | 1 |
| TMA | SG-A | 251.00 | 55.68 | 0.847 | 213.78-339.04 | 1 | | |
| SG-B | 251.87 | 59.29 | 219.04-284.70 | NS | 1 | |
| SG-C | 239.97 | 72.37 | 199.90-280.05 | NS | NS | 1 |
SS: Stainless steel; NiTi: Nickel titanium; TMA: Beta-titanium; NS: Non-significant; SG-A, control subgroup (distilled water; pH 6.7); SG-B, simulated gastric acid pH 4 subgroup; SG-C, simulated gastric acid pH 1.2 subgroup; FR: Frictional resistance force; gm: Gram; SD: Standard deviation. Data were analysed by One-way ANOVA. * Refers to significant at p-value ≤0.05
Correlation between Frictional Resistance and Surface Roughness
No significant correlation was found between surface roughness and frictional resistance in all archwire groups [Table/Fig-8].
Correlation between frictional resistance and average surface roughness of all archwires.
| Archwire | SS | NiTi | TMA |
|---|
| Media subgroups | SG-A | SG-B | SG-C | SG-A | SG-B | SG-C | SG-A | SG-B | SG-C |
| Pearson correlation coefficient | -0.118 | -0.465 | -0.026 | -0.483 | 0.320 | 0.353 | -0.027 | -0.056 | 0.099 |
| p-value | 0.745 | 0.175 | 0.943 | 0.157 | 0.368 | 0.316 | 0.940 | 0.878 | 0.787 |
SS: Stainless steel; NiTi: Nickel titanium; TMA: Beta-titanium; SG-A, control subgroup (distilled water; pH 6.7); SG-B, simulated gastric acid pH 4 subgroup; SG-C, simulated gastric acid pH 1.2 subgroup. Data were analysed by Pearson’s correlation coefficient analysis (p<0.05)
Discussion
This study was conducted to investigate the effects of simulated gastric acid with pH 1.2 and pH 4 on commercial SS, NiTi, and TMA archwires with regard to surface roughness and frictional resistance. The wire size used was 0.017×0.025 inches because the premolar brackets had a slot size of 0.022 inches and thus, smaller archwires would not be efficient for testing frictional resistance and exhibit large play between the wire and the slot [9]. The study used an elastomeric ligature for ligation of each wire to its bracket to match the first-line choice for most clinical orthodontists, avoid the difficulty in standardising tying strength when using SS ligatures, and reduce the variation in force levels associated with SS ligatures [23].
The immersion time was based on previous studies involving simulations of gastric acid [10,11,21]. It is very important to note that the recovery of salivary pH following intake of acidic food typically requires two minutes for anterior teeth and 5-15 minutes for posterior teeth [24,25]. Therefore, under clinical conditions, the clearing, diluting, and buffering properties of saliva probably help to minimise the harmful erosive effects of gastric acid. However, most previous studies investigated the effects of different pH solutions on archwires after continuous immersion for periods of three weeks to two months without considering the effects of salivary dilution and buffering. Regarding acid concentration and immersion time, there is no clear consensus in the literature for the optimal method of gastric acid simulation and the equivalent time to replicate an in-vivo model. Abbate-Daga G et al., described that patients with moderate gastro-oesophageal reflux disease had a vomiting frequency of 3-7 times per week [22]. According to these findings, the immersion protocol adopted from Kulkarni A et al., was modified and the soaking procedure was repeated six times a day for a total of nine days corresponding to an average total exposure time of 6-8 weeks [21].
Surface Roughness
Surface structure is an inherited characteristic of a material that depends on the manufacturing process, surface finish treatment, and type of alloy used [26]. The surface quality of an archwire is a very important factor for sliding mechanics and speed of tooth movement [27]. Surface roughness is considered one of the essential components of surface quality. It can be defined as a measure of the surface texture and has an influence on how an object will interact with its environment [28]. Several methods have been used to measure surface roughness of orthodontic archwires including laser spectroscopy, atomic force microscopy, and surface profilometry, with the latter being the most commonly used. Bourauel C et al., reported no differences among the three techniques [29].
In the present study, SEM observations revealed little difference in the patterns of irregularities on SS and TMA wires before and after soaking in simulated gastric acid solutions with pH 1.2 and pH 4, consistent with the results of Nanjundan K and Vimala G [19]. However, the images did not allow clear and reproducible subjective interpretation thus, making comparisons with other interpretations difficult.
Therefore, the advantages of profilometry to quantify the surface roughness of the archwires were employed. The surface of the wires in the different simulated gastric acid solutions exhibited various degrees of surface roughness, with significant effects of the pH 1.2 and pH 4 solutions on the SS and TMA archwires compared with the control group. Furthermore, the surface roughness of the SS and TMA archwires in the pH 1.2 solution was higher than that in the control group. This can be explained by the lower pH of the acidic solution having larger effects on the SS and TMA archwires that can be reflected in increased surface roughness.
The results of this study were consistent with those of Escobar CGN et al., who reported that acidic pH had effects on TMA wires [13]. Meanwhile, Nanjundan K and Vimala G examined SS archwires immersed in vinegar, Pepsi, and Colgate Phos-Flur mouth rinse, and showed a tendency toward breakdown and increased surface roughness as the acidity of the medium increased [19]. However, Parenti SI et al., reported that three popular soft drinks with different acidities had no effect on the surface topography and degradation of NiTi archwires [16]. Another study compared the surface properties of SS, NiTi, TMA, and physiognomic NiTi archwires immersed in different pH solutions, and demonstrated no significant differences in surface roughness [14].
Thus, there are contradictions in the literature that make comparisons with previous studies difficult. This is further complicated by several issues, including lack of universal standard archwire, lack of standard exposure time in the medium, and lack of standard testing machine, that limit the use of surface roughness for comparisons. However to date, profilometry is considered the most commonly used technique for successful investigations on surface roughness of orthodontic archwires [13,14,16,27].
Frictional Resistance
Control of frictional resistance between the archwire and its bracket is critical for efficacy of sliding movement during space closure. High frictional resistance can slow tooth movement and extend the period of treatment. In general, the factors affecting frictional resistance between the archwire and its bracket vary with archwire and bracket materials, archwire size, bracket slot size, bracket angulation, ligation mode, and biological and environmental factors [9]. In the present study, we measured the static frictional resistance at the peak of movement from the frictional force-displacement curve within the first 1 mm. Static friction is important because sliding mechanics are not continuous, but occur in repeated short steps [30]. In this study, metallic brackets were used in all samples, so their contribution was considered constant with no influence on the results for surface roughness and frictional resistance.
In the present study, there was a significant difference in frictional resistance force within the SS archwire groups. Interestingly, SS wires in the pH 1.2 subgroup had lower frictional resistance than the control and pH 4 subgroups. However, the pH 1.2 solution cannot improve the quality of the wire. One explanation could be the variation during the manufacturing process, even within the same type of wire. Another explanation could be the friction can be affected by three factors; notching, roughness and binding. The contribution of these factors can affect the frictional resistance.
To date, only a few studies have evaluated the effects of acidic solution or erosive conditions on frictional resistance of archwires [12,18,19]. To the author’s knowledge, one study by Stefanski T et al., examined nine different combinations: three types of twin orthodontic brackets (metallic, monocrystalline ceramic, titanium) and three types of archwires with the same dimensions (SS, NiTi, TMA) under a pH cycling regimen of simulated erosive and nonerosive conditions for five consecutive days [18]. They concluded that erosive conditions did not affect the frictional resistance of orthodontic archwires at clinically significant levels. Another study by Nanjundan K and Vimala G followed a soaking protocol for 24 hour, and demonstrated higher frictional forces between SS wires and brackets after exposure to various erosive solutions [19]. However, Jaber LC et al., assessed the frictional resistance between copper-nickel-titanium (CuNiTi) wires and passive self-ligating brackets after continuous immersion in cariogenic and erosive solutions for 21 days [12], and found that surface roughness increased after exposure to erosive solution while frictional resistance did not increase. Considering that intraoral pH levels oscillate rather than remaining constant and archwires with different manufacturing processes may exhibit different behaviours, these factors could explain the discrepancy between this study and previous studies.
Correlation between Frictional Resistance and Surface Roughness
Although the SS and TMA wires exposed to high acidic solution exhibited elevated Ra values, this did not increase the frictional resistance between the wire and the bracket. There was no correlation between surface roughness and frictional resistance. The relationship between frictional resistance and surface roughness remains a matter of controversy in the literature. Some studies supported such a relationship [20,31,32], while others did not [12,18,29,33,34]. One factor that can explain the lack of correlation between surface roughness and frictional resistance is the inability of profilometry to measure the overall surface of the wire and instead measure only the selected scan area.
Limitation(s)
An in vitro study cannot fully mimic the clinical environment. Surface profilometry can only measure the surface roughness in a small area, making it difficult to accurately measure and examine the surface roughness of the whole wire. The frictional resistance of the archwires was measured under dry conditions, unlike intraoral conditions.
The study recommends an increased sample size to strengthen the power of the study, use of artificial saliva, and increased exposure time to acidic solution. Accordingly, in-vivo studies are required during orthodontic treatment to analyse the clinical effects of acidic solution in the oral environment. Because the acidity of the oral cavity can affect the surface properties of archwires, it is recommended to shorten the period of usage of archwires by regular replacement with new wires.
Conclusion(s)
The present data clearly show that surface roughness was more evident as the pH decreased for the SS and TMA archwires. NiTi archwires did not show any significant changes. With regard to frictional resistance, a significant difference was found, with the SS archwires in the pH 1.2 subgroup. No correlation was found between surface roughness and frictional resistance.