Overweight and obesity are the most common and major global health issues, yet among the most neglected, public health problems in both developed and developing nations [1]. According to the World Health Organisation (WHO) World Health Statistics Report of 2020, globally the age standardised prevalence of obesity among adults is 13.1% and that of India is 3.9% [2]. According to the same report, globally the prevalence of obesity among children and adolescents (5-19 years) is 6.8% and that of India is 2.0% [2]. Currently, India is experiencing a rapid epidemiological transition. Under-nutrition which dominated in the past is being rapidly replaced by obesity [3]. Studies from different parts of India have provided evidence of the rising prevalence of obesity [3-6].
Obesity and overweight are gradually becoming a major health problem in Indian medical students [7]. Studies from different part of countries have shown high prevalence of overweight and obesity in Indian medical students [8,9]. This has been attributed to many risk factors such as the stressful medical education, the amount of material to be absorbed, lack of exercise, irregular diet, sleep deprivation, excessive workload, helplessness, increased psychological pressure and mental tension, all of which are anticipated to bring psychological stress [8,10].
Obese individuals are at an elevated risk for numerous health problems such as diabetes, heart disease, hypertension, and cancer [11]. Evidences also show that obesity is also associated neurodegenerative disorders such as Alzheimer’s disease [12]. Various research studies have demonstrated an association between obesity and impaired cognitive functioning. These studies showed that obese individuals exhibit deficits in multiple cognitive domains, including executive function, and memory [13-17]. Thus, the aim of this study was to find out association between BMI and cognitive functions in medical students and to determine whether there are any gender based differences in association of BMI and Cognitive functions.
Materials and Methods
An observational cross-sectional study was conducted at Cognitive function laboratory of Central Research Laboratory at Dr. Vasantrao Pawar Medical College, Hospital and Research Centre, Nashik between July and December; 2016. Instituitional Ethics clearance was obtained before starting the study (Dr. VPMCH and RC/IEC/1/2016-2017).
Hundred undergraduate medical students from second and third-minor year of MBBS studying in Dr. Vasantrao Pawar Medical College Hospital and Research Centre, Nashik were selected randomly by using ‘Simple Randomised Sampling’ technique. The sample size was validated and certified by institutional biostatistician. Out of the randomly selected students, they were categorised into males and females. The random selection continued till each group (male and female) had equal number of participants.
Inclusion criteria and Exclusion criteria: Informed written consent was taken from all the subjects selected for the study. The subjects who were having history of any systemic disease, colour blindness, hearing impairment, suffering from any sensory-motor disability, medications in past one month, addictions (smoking, alcohol or tobacco consumption etc.,) were excluded from the study.
To eliminate the possible effects of stress on cognitive functions, the readings were taken on the day when the subjects were not exposed to any academic examinations for at least one month.
Assessment of Body Mass Index (BMI): Body weight in kilograms (kg) and height in meters (m) of the subjects were recorded using standardised instruments. BMI of subjects was then calculated using the formula-
BMI (in kg/m2)=Weight (in kg)/height (in m2) [18].
The subjects were then classified into one of the following three groups based on their BMI [18]. The groups being:
Underweight (BMI <18.5 kg/m2).
Normal weight (BMI 18.5- 24.99 kg/m2).
Overweight (BMI >25 kg/m2).
Methods for assessment of cognitive functions: The subjects were tested in a separate silent room of Cognitive Research Laboratory to provide a distraction free environment. The subjects were provided with precisely scripted instructions and were given 2-3 practice (trials) sessions of each test to understand various cognitive function tests. Four domains of cognitive functions (attention, perception, executive functions and working memory) were assessed using the following tests available on cognitive fun.net program [19].
A Attention:
Visual Reaction Time (VRT): It is a reaction time test wherein the subject has to respond as soon as possible to a pre-determined visual stimulus [19]. In this case, the subject had to press ‘space bar of the computer keyboard’ as soon as a stimulus in the form of a ‘Green sphere’ flashed on the screen. This was done five times and average reaction time taken by subject was recorded in milliseconds.
Go/No-Go VRT (GNG VRT): It is a reaction time test in which the subject has to give response to a particular pre-determined visual stimulus while does not have to give any response to the alternate stimulus [19]. In other words, response to the alternate stimulus had to be inhibited. In this study, the subject had to respond to a ‘solid green sphere’ presented to him by pressing ‘space bar on computer keyboard’ while didn’t have to respond when a ‘patterned green sphere’ was presented to him. The test consisted of around 12 trials and after which accuracy (in percentage), average time taken to give correct response (Time Correct) and average of total time taken to give responses (Total Time) were recorded [19].
Auditory Reaction Time (ART): It is a reaction time test wherein the subject has to respond as soon as a pre-determined auditory stimulus is provided to him [19]. In this case, the subject had to press ‘space bar of the computer keyboard’ as soon as a stimulus in the form of a music tone was heard. This was done five times and average time taken by the subject to give response was recorded in milliseconds.
Go/No-Go test ART (GNG ART): It is a reaction time test in which the subject has to give response to a particular pre-determined auditory stimulus while does not have to give any response to the alternate stimulus [19]. In this study, the subject had to respond by pressing ‘space bar on computer keyboard’ to a ‘high tone or low tone’ as specified by computer before each trial. The test consisted of around 12 trials and after which accuracy (in percentage) and average time taken to give correct response (Time Correct) and average of total time taken to give responses (Total Time) were recorded.
B. Perception:
Fast Counting test (FC): It is a test in which the subjects had to press the number key equal to that of the number of dots shown on computer screen [19]. A minimum of four and a maximum of seven dots were shown and 12 trials were taken for each subject. Accuracy and time taken to give response were recorded.
C. Executive Functions:
Eriksen-Flanker test (EFT): It is a paradigm in cognitive neuroscience wherein the target stimulus is flanked by other non-target stimuli. The non-target stimuli may be congruent or incongruent to the target stimuli. The flanking arrows either all pointed in the same direction as the target arrow (e.g., “<<<<<”), or they all pointed in the opposite direction (e.g., “<<><<”). The trials on which the flanking arrows pointed in the same direction as the target arrow were congruent trials; the trials in which they pointed in the opposite direction were the incongruent trials [20]. This test assesses the ability to inhibit habitual response and the ability to solve the conflict and give appropriate response [19,20]. In this study, the subject had to identify the direction in which the central arrow was facing. For example, if the central arrow shown on the screen was facing on right side (→), the subject had to press right arrow key (→), while if it was facing on left side (←), the subject had to press the left arrow key (←). The test consisted of 20 trials, which randomly consisted of both congruent and incongruent stimuli. The average time taken to respond to congruent (Time C) and incongruent stimuli (Time IC) and accuracy with which subjects gave response were recorded.
Colour reading interference test (Stroop Test) (ST): It is a measure of individual’s ability to respond to a stimulus with and without interference [19]. The subject had to read ink colour in place of written words as fast as possible, while ignoring the name indicated by the printed word [19]. The average time taken to give response to stimulus with interference (Time IN) and without interference (Time N) and percentage accuracy was noted.
D Memory:
Visual Forward Digit Span test (VFDS): Digit span tests have widely been used to test for attention-concentration and working memory [21]. In this test, the subject is shown a strand of numbers which he has to remember and type them again in same sequence [21]. In this study, the subject was given three trials for each digit span (starting with three digit span) and only if he had 100% accuracy at that digit span, then the subject was allowed to attempt a higher digit span until he made a mistake. For example: The subject was given three trials for a digit span of three digits, if he had 100% accuracy for all the three trials only then, he was tested for four digit, digit span. In this way, the digit span was increased until the subject was not 100% accurate and his accuracy at this digit span for three trials and the average time taken for only this digit span were recorded.
Visual Backward Digit Span test (VBDS): The subjects were tested similarly as in Visual Forward Digit Span test except that the subjects had to remember and type the digits in reverse sequence as were presented to him. Percentage accuracy and average time taken to give response were recorded for the highest digit span attained by the subject only [21].
Statistical Analysis
The average of recordings of each test in each BMI category of total population (both combined) and gender wise (for male and females) were calculated. The data of normal weight subjects was compared with that of overweight and underweight subjects and ANOVA test of significance was applied on Statistical Package for the Social Sciences (SPSS) Software version 16.0 and p-value less than 0.05 was considered significant. To find out between which groups difference existed on ANOVA test a post-hoc test, Tukey HSD test was applied using SPSS Software version 16.0 and p-value less than 0.05 was considered significant. The data was then plotted on a graph and coefficient of correlation was calculated using Microsoft Excel version 2010.
Results
[Table/Fig-1] gives the distribution of sample data according to BMI and gender. [Table/Fig-2] gives the Mean±Standard deviation of anthropometric variables of the present study population. [Table/Fig-3] shows the mean and standard deviation values of all the cognitive function tests. [Table/Fig-4] shows the results of ANOVA Test of Significance applied between different BMI groups and cognitive functions. [Table/Fig-5] shows results of Tukey’s HSD test to find out where the difference occurred between different BMI groups and Cognitive Functions. [Table/Fig-6] gives the coefficient of correlations (r-values) for BMI and cognitive functions.
Total samples and division of samples according to BMI and Gender.
| Classification | Male | Female | Total |
|---|
| Underweight (BMI <18.5) | 8 | 11 | 19 |
| Normal (BMI 18.5-24.99) | 24 | 30 | 54 |
| Overweight (BMI >25) | 18 | 9 | 27 |
| Total | 50 | 50 | 100 |
BMI: Body mass index
Anthropometric variables of the study population.
| Group | N | Age (in years) | Weight (in kg) | Height (in m) | BMI (in kg/m2) |
|---|
| Combined | 100 | 20.1±1.176 | 62.50±14.96 | 1.66±0.10 | 22.57±4.06 |
| Male | 50 | 20.08±1.29 | 70.56±15.34 | 1.73±0.07 | 23.98±4.33 |
| Female | 50 | 20.01±1.07 | 54.43±9.17 | 1.57±0.06 | 21.84±3.68 |
(Mean±Standard deviation); BMI: Body mass index
Shows the Mean and Standard Deviation (SD) values of all the cognitive function.
| Cognitive domain | Test | Variable | Total population | Males | Females |
|---|
| UW | NW | OW | UW | NW | OW | UW | NW | OW |
|---|
| N | 19 | 54 | 27 | 8 | 24 | 18 | 11 | 30 | 9 |
|---|
| Visual Reaction Time Test | Avg. time taken(in m sec) | Mean | 340.17 | 344.25 | 326.95 | 342.28 | 327.05 | 321.84 | 338.64 | 358.02 | 371.70 |
| SD | 42.26 | 52.66 | 32.05 | 41.32 | 58.17 | 29.07 | 44.86 | 44.08 | 36.95 |
| Go/No Go Visual Reaction Time Test | % Correct | Mean | 94.30 | 94.05 | 92.99 | 95.43 | 93.71 | 93.51 | 93.48 | 94.31 | 91.95 |
| SD | 5.18 | 5.32 | 7.34 | 5.30 | 5.24 | 6.74 | 5.19 | 5.45 | 8.76 |
| Time correct(in m sec) | Mean | 448.77 | 452.16 | 440.87 | 461.66 | 449.76 | 435.41 | 439.39 | 454.09 | 451.78 |
| SD | 43.48 | 57.04 | 52.15 | 55.92 | 57.57 | 53.82 | 31.38 | 57.52 | 49.82 |
| Total time(in m sec) | Mean | 481.65 | 475.32 | 479.13 | 487.58 | 475.22 | 472.27 | 477.33 | 475.40 | 492.83 |
| SD | 46.56 | 73.94 | 55.21 | 53.11 | 67.47 | 58.48 | 43.35 | 79.88 | 48.20 |
| Auditory Reaction Time Test | Avg. time taken(in m sec) | Mean | 274.86 | 296.72 | 278.47 | 280.62 | 285.13 | 266.98 | 270.68 | 305.99 | 301.45 |
| SD | 59.99 | 67.35 | 68.53 | 72.01 | 78.98 | 77.26 | 52.94 | 56.07 | 41.07 |
| Go/No Go Auditory Reaction Time Test | % Correct | Mean | 87.78 | 87.27 | 86.22 | 86.08 | 85.97 | 87.35 | 89.01 | 88.32 | 83.97 |
| SD | 11.18 | 11.67 | 12.41 | 10.82 | 12.86 | 10.12 | 11.79 | 10.72 | 16.55 |
| Time correct(in m sec) | Mean | 1031.3 | 1280.3 | 1073.1 | 896.22 | 1175.9 | 798.42 | 1129.6 | 1363.8 | 1622.6 |
| SD | 746.65 | 956.45 | 860.91 | 482.15 | 774.96 | 460.03 | 903.07 | 1085.97 | 1204.02 |
| Total time(in m sec) | Mean | 1496.4 | 1596.5 | 1238.9 | 1051.2 | 1407.6 | 863.60 | 1820.3 | 1747.7 | 1989.4 |
| SD | 1718.01 | 1490.63 | 1344.03 | 584.36 | 1016.18 | 545.65 | 2190.84 | 2070.65 | 1890.79 |
| Fast Counting Test | % Correct | Mean | 71.45 | 67.94 | 69.68 | 67.09 | 70.31 | 69.78 | 74.63 | 66.05 | 69.47 |
| SD | 15.44 | 15.98 | 17.96 | 14.96 | 14.64 | 19.17 | 15.69 | 16.98 | 16.37 |
| Avg. time(in m sec) | Mean | 1255.6 | 4562.6 | 1067.5 | 1500.7 | 8768.9 | 1068.5 | 1077.4 | 1197.6 | 1065.5 |
| SD | 739.29 | 25340.51 | 149.65 | 1128.99 | 38027.73 | 165.27 | 92.65 | 547.82 | 121.40 |
| Eriksen Flanker Test* | % Correct | Mean | 98.42 | 98.43 | 97.96 | 99.38 | 98.33 | 97.50 | 97.73 | 98.50 | 98.89 |
| SD | 2.91 | 2.89 | 3.74 | 1.77 | 3.19 | 4.29 | 3.44 | 2.67 | 2.20 |
| Time C(in m sec) | Mean | 571.98 | 571.35 | 547.86 | 528.26 | 518.91 | 523.02 | 603.78 | 613.30 | 597.54 |
| SD | 112.08 | 131.11 | 101.69 | 131.64 | 72.73 | 73.10 | 88.55 | 152.07 | 134.50 |
| Time IC(in m sec) | Mean | 683.15 | 647.75 | 1048.8 | 631.49 | 570.99 | 1227.2 | 720.71 | 709.16 | 691.98 |
| SD | 195.21 | 166.62 | 1612.59 | 176.15 | 73.32 | 1965.77 | 207.81 | 194.16 | 158.40 |
| Stroop Test** | % Correct | Mean | 95.22 | 95.71 | 95.99 | 95.02 | 95.98 | 94.91 | 95.37 | 95.50 | 98.15 |
| SD | 5.58 | 4.52 | 6.26 | 3.47 | 4.59 | 7.13 | 6.90 | 4.53 | 3.38 |
| Time N(in m sec) | Mean | 1260.8 | 1135.8 | 1098.8 | 1228.4 | 1138.9 | 1105.4 | 1284.3 | 1133.2 | 1085.6 |
| SD | 252.47 | 249.65 | 328.40 | 123.07 | 259.28 | 382.61 | 320.44 | 246.12 | 197.81 |
| Time IN(in m sec) | Mean | 1548.2 | 1590.2 | 1326.2 | 1678.7 | 1328.2 | 1313.9 | 1453.3 | 1799.9 | 1350.7 |
| SD | 377.84 | 1700.51 | 259.09 | 492.57 | 217.90 | 172.70 | 252.22 | 2268.24 | 392.13 |
| Visual Forward Digit Span Test | % Correct | Mean | 85.61 | 87.93 | 88.36 | 89.01 | 89.02 | 88.98 | 83.14 | 87.06 | 87.12 |
| SD | 8.05 | 7.68 | 7.28 | 8.77 | 6.59 | 6.96 | 6.85 | 8.47 | 8.17 |
| Avg. time(in sec) | Mean | 6.53 | 5.38 | 6.85 | 5.93 | 5.01 | 5.39 | 6.96 | 5.67 | 9.75 |
| SD | 2.23 | 2.47 | 6.96 | 1.88 | 1.78 | 1.57 | 2.44 | 2.91 | 11.75 |
| Visual Backward Digit Span Test (VBDS) | % Correct | Mean | 84.99 | 84.54 | 83.65 | 86.13 | 85.18 | 81.70 | 84.16 | 84.02 | 87.55 |
| SD | 12.90 | 11.26 | 17.30 | 14.33 | 10.21 | 20.45 | 12.41 | 12.17 | 7.63 |
| Avg. time(in sec) | Mean | 10.53 | 7.40 | 6.16 | 7.92 | 7.01 | 6.14 | 12.43 | 7.71 | 6.21 |
| SD | 7.81 | 3.74 | 2.68 | 3.13 | 4.00 | 2.63 | 9.67 | 3.55 | 2.93 |
UW: Under-weight; NW: Normal-weight; OW: Over-weight
*- Average time taken to respond to congruent (Time C) and incongruent stimuli (Time IC)
**- Average time taken to give response to stimulus with interference (Time IN) and without interference (Time N)
Results of ANOVA test applied between BMI groups for various tests of Cognitive Functions.
| Cognitive function domain | Cognitive function test | | Total population | Males | Females |
|---|
| F-value | p-value | F-value | p-value | F-value | p-value |
|---|
| Attention | Visual Reaction Time Test | Avg. time taken (in milliseconds) | 1.281 | 0.282 | 0.525 | 0.595 | 1.299 | 0.282 |
| Go/No Go Visual Reaction Time Test | % Correct | 0.372 | 0.691 | 0.329 | 0.721 | 0.530 | 0.592 |
| Time correct (in milliseconds) | 0.402 | 0.670 | 0.687 | 0.508 | 0.329 | 0.721 |
| Total time (in milliseconds) | 0.078 | 0.925 | 0.172 | 0.843 | 0.226 | 0.798 |
| Auditory Reaction Time Test | Avg. time taken (in milliseconds) | 1.115 | 0.332 | 0.289 | 0.750 | 1.810 | 0.175 |
| Go/No Go Auditory Reaction Time Test | % Correct | 0.112 | 0.894 | 0.078 | 0.925 | 0.529 | 0.593 |
| Time correct (in milliseconds) | 0.792 | 0.456 | 1.925 | 0.157 | 0.525 | 0.595 |
| Total time (in milliseconds) | 0.514 | 0.600 | 2.369 | 0.105 | 0.055 | 0.947 |
| Perception | Fast Counting Test | % Correct | 0.345 | 0.709 | 0.116 | 0.890 | 1.091 | 0.344 |
| Avg. time (in milliseconds) | 0.414 | 0.662 | 0.506 | 0.606 | 0.501 | 0.609 |
| Executive Functions | Eriksen Flanker Test | % Correct | 0.213 | 0.809 | 0.840 | 0.438 | 0.479 | 0.622 |
| Time C (in milliseconds) | 0.381 | 0.685 | 0.040 | 0.961 | 0.053 | 0.948 |
| Time IC (in milliseconds) | 2.116 | 0.126 | 1.693 | 0.195 | 0.056 | 0.946 |
| Stroop Test | % Correct | 0.120 | 0.887 | 0.221 | 0.802 | 1.081 | 0.347 |
| Time N (in milliseconds) | 2.105 | 0.127 | 0.476 | 0.624 | 1.831 | 0.172 |
| Time IN (in milliseconds) | 0.396 | 0.674 | 6.105 | 0.004* | 0.296 | 0.745 |
| Memory | Visual Forward Digit Span Test | % Correct | 0.826 | 0.441 | 0.000 | 1.000 | 1.012 | 0.371 |
| Avg. time (in seconds) | 1.319 | 0.272 | 0.898 | 0.414 | 1.942 | 0.155 |
| Visual Backward Digit Span Test (VBDS) | % Correct | 0.063 | 0.939 | 0.353 | 0.704 | 0.336 | 0.716 |
| Avg. time (in seconds) | 5.282 | 0.007* | 0.793 | 0.458 | 4.054 | 0.024* |
(p-value <0.05- Significant*, p-value <0.001- Statistically Highly Significant**); -Time taken to respond to congruent (Time C) and incongruent stimuli (Time IC); -Time taken to give response to stimulus with interference (Time IN) and without interference (Time N)
Results of Tukey’s HSD test applied between BMI and tests for cognitive functions.
| Cognitive function | Test | Variable | Combined | Males | Females |
|---|
| p-value for Under-weight v/s Normal weight | p-value for Over-weight v/s Normal weight | p-value for Over-weight v/s Under-weight | p-value for Under-weight v/s Normal weight | p-value for Over-weight v/s Normal weight | p-value for Over-weight v/s Under-weight | p-value for Under- weight v/s Normal weight | p-value for Over-weight v/s Normal weight | p-value for Over-weight v/s Under-weight |
|---|
| Attention | Visual Reaction Time Test | Avg. time taken (in m sec) | 0.94 | 0.253 | 0.605 | 0.710 | 0.933 | 0.567 | 0.416 | 0.418 | 0.997 |
| Go/No Go Visual Reaction Time Test | % Correct | 0.985 | 0.720 | 0.737 | 0.752 | 0.993 | 0.719 | 0.922 | 0.568 | 0.841 |
| Time correct (in m sec) | 0.96 | 0.644 | 0.875 | 0.862 | 0.692 | 0.517 | 0.701 | 0.992 | 0.855 |
| Total time | 0.92 | 0.966 | 0.982 | 0.878 | 0.987 | 0.833 | 0.997 | 0.784 | 0.871 |
| Auditory Reaction Time Test | Avg. time taken (in m sec) | 0.43 | 0.476 | 0.982 | 0.989 | 0.733 | 0.910 | 0.154 | 0.972 | 0.409 |
| Go/No Go Auditory Reaction Time Test | % Correct | 0.98 | 0.924 | 0.899 | 1.000 | 0.924 | 0.964 | 0.986 | 0.616 | 0.628 |
| Time correct (in m sec) | 0.56 | 0.590 | 0.987 | 0.533 | 0.149 | 0.931 | 0.810 | 0.801 | 0.566 |
| Total time (in m sec) | 0.96 | 0.571 | 0.834 | 0.536 | 0.092 | 0.851 | 0.994 | 0.942 | 0.979 |
| Perception | Fast Counting Test | % Correct | 0.70 | 0.895 | 0.931 | 0.881 | 0.994 | 0.922 | 0.316 | 0.851 | 0.770 |
| Avg. time taken (in m sec) | 0.78 | 0.709 | 0.999 | 0.782 | 0.625 | 0.999 | 0.715 | 0.706 | 0.990 |
| Executive Functions | Eriksen Flanker Test | % Correct | 1.000 | 0.807 | 0.878 | 0.745 | 0.724 | 0.419 | 0.713 | 0.928 | 0.626 |
| Time C (in m sec) | 1.000 | 0.687 | 0.782 | 0.960 | 0.987 | 0.988 | 0 979 | 0.951 | 0.994 |
| Time IC (in m sec) | 0.967 | 0.116 | 0.325 | 0.991 | 0.189 | 0.469 | 0.984 | 0.970 | 0.941 |
| Stroop Test | % Correct | 0.935 | 0.973 | 0.877 | 0.905 | 0.808 | 0.999 | 0.997 | 0.347 | 0.227 |
| Time N (in m sec) | 0.205 | 0.835 | 0.123 | 0.742 | 0.931 | 0.596 | 0.227 | 0.877 | 0.207 |
| Time IN (in m sec) | 0.992 | 0.655 | 0.830 | 0.006* | 0.964 | 0.006* | 0.848 | 0.788 | 0.991 |
| Memory | Visual Forward Digit Span Test | % Correct | 0.494 | 0.969 | 0.456 | 1.000 | 1.000 | 1.000 | 0.363 | 1.000 | 0.523 |
| Time taken (in sec) | 0.554 | 0.296 | 0.965 | 0.399 | 0.759 | 0.744 | 0.782 | 0.133 | 0.498 |
| Visual Backward Digit Span Test (VBDS) | % Correct | 0.991 | 0.958 | 0.941 | 0.987 | 0.746 | 0.775 | 0.999 | 0.704 | 0.792 |
| Time taken (in sec) | 0.031* | 0.488 | 0.005* | 0.798 | 0.696 | 0.451 | 0.043* | 0.747 | 0.036* |
(p<0.05- Statistically Significant*, p<0.001- Statistically Highly Significant**); - time taken to respond to congruent (Time C) and incongruent stimuli (Time IC); - time taken to give response to stimulus with interference (Time IN) and without interference (Time N)
Coefficient of correlations for BMI versus cognitive functions.
| Cognitive function | Test | Variable | Total population | Males | Females |
|---|
| r-value | r-value | r-value |
|---|
| BMI v/s Attention | Visual Reaction Time Test | 1/Avg. time taken (in milliseconds) | 0.1 | 0.2 | 0.0 |
| Go/No Go Visual Reaction Time Test | % Correct | -0.1 | 0.0 | -0.2 |
| 1/Time for correct responses (in milliseconds) | 0.1 | 0.2 | -0.1 |
| 1/Total time (in milliseconds) | 0.0 | 0.1 | -0.1 |
| Auditory Reaction Time Test | 1/Avg. time taken (in milliseconds) | 0.1 | 0.1 | -0.2 |
| Go/No Go Auditory Reaction Time Test | % Correct | 0.0 | 0.1 | 0.0 |
| 1/Time for correct responses (in milliseconds) | 0.1 | 0.1 | -0.1 |
| 1/Total time (in milliseconds) | 0.1 | 0.2 | 0.0 |
| BMI v/s Perception | Fast Counting Test | % Correct | 0.0 | 0.1 | -0.1 |
| 1/Avg. time taken (in milliseconds) | 0.0 | -0.1 | -0.1 |
| BMI v/s Executive Functions | Eriksen Flanker Test | % Correct | 0.0 | -0.1 | 0.1 |
| 1/Response time for Congruent stimuli (Time C) (in milliseconds) | 0.1 | 0.1 | 0.1 |
| 1/Response time for Incongruent stimuli (Time IC)(in milliseconds) | 0.0 | -0.2 | 0.0 |
| Stroop Test | % Correct | 0.1 | 0.0 | 0.2 |
| 1/Response time for stimuli without interference (Time N) (in milliseconds) | 0.1 | 0.1 | 0.2 |
| 1/Response time for stimuli with interference (Time IN) (in milliseconds) | 0.0 | 0.4* | 0.0 |
| BMI v/s Memory | Visual Forward Digit Span Test | % Correct | 0.1 | 0.0 | 0.1 |
| 1/Response time (in seconds) | 0.0 | 0.0 | -0.1 |
| Visual Backward Digit Span Test (VBDS) | % Correct | 0.0 | -0.1 | 0.0 |
| 1/Response time (in seconds) | 0.3* | 0.2 | 0.4* |
0.3 < r < 0.5-Weak positive correlation*, 0.5 < r < 0.7-Moderate positive correlation **, 0.7 < r < 1-Strong positive correlation*** -0.3 > r > -0.5 -Weak negative correlation****, -0.5 > r > -0.7-Moderate negative correlation*****, -0.7 > r > -1-Strong negative correlation******
BMI versus Attention
On comparing BMI with various tests under the attention domain (viz., VRT, GNGVRT, ART and GNG ART), it was found that the difference between the accuracy and response time of subjects of various BMI cohorts (both with and without matching subjects for gender) was not found to be statistically significant [Table/Fig-4,5] (p>0.05) and the correlation [Table/Fig-6] was also very weak (-0.3 <r <0.3).
BMI versus Perception
The difference between the average time taken to give response and the accuracy with which the response were given by the subjects (both with and without matching subjects for their gender) of various BMI category were not found to be statistically significant [Table/Fig-4,5] (p>0.05) and also the correlation [Table/Fig-6] was very weak (-0.3 < r < 0.3).
BMI versus Executive Functions
In executive functions, Eriksen flanker test and ST were applied. When whole population under study was considered the difference in the time taken and the accuracy to give correct response by subjects of various BMI category were not found to be statistically significant [Table/Fig-4,5] (p>0.05) and the correlation [Table/Fig-6] was also found to be very weak (-0.3 < r < 0.3).
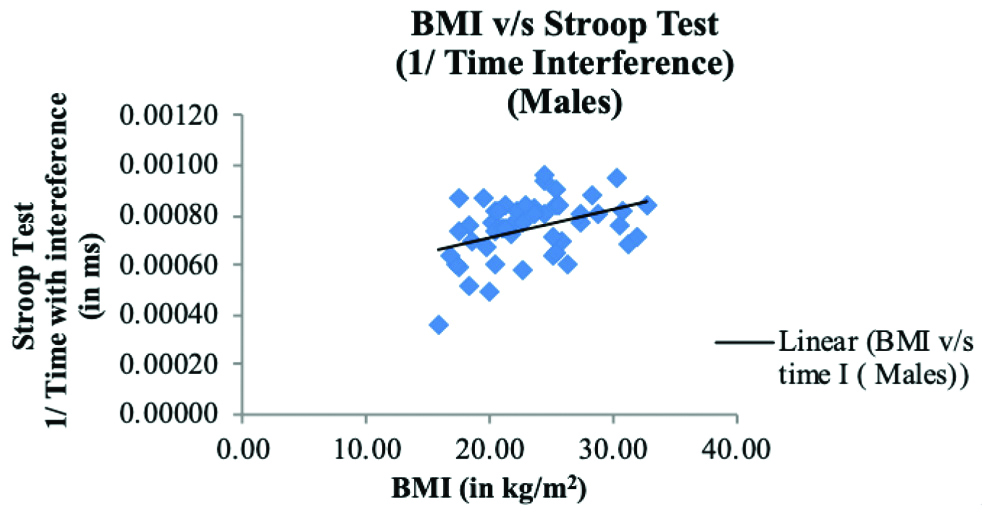
But after comparing the findings according to gender, it was observed [Table/Fig-4,5] that the difference between the time taken to give response to incongruent stimulus in ST by underweight and normal weight male subjects (p=0.006); and by underweight and overweight male subjects (p=0.006) was found to be statistically significant (p<0.05). However, the coefficient of correlation [Table/Fig-6] between reciprocal of time taken by males to give response to incongruent stimulus on ST and BMI was weakly positive (r=0.4) (0.3 < r < 0.5). [Table/Fig-7] shows a scatter chart between BMI and reciprocal of time taken by males to give response to trials with Interference in ST. When the data of females was analysed, the difference of performance on EFT and ST by females of various BMI cohorts [Table/Fig-4,5] was not found to be statistically significant (p>0.05) and the correlation [Table/Fig-6] was also very weak (-0.3 < r < 0.3).
A scatter plot is presented between BMI and 1/time taken by males to give response to trials with Interference in Stroop Test (ST) (r=0.4*).
BMI: Body mass index
BMI versus Memory
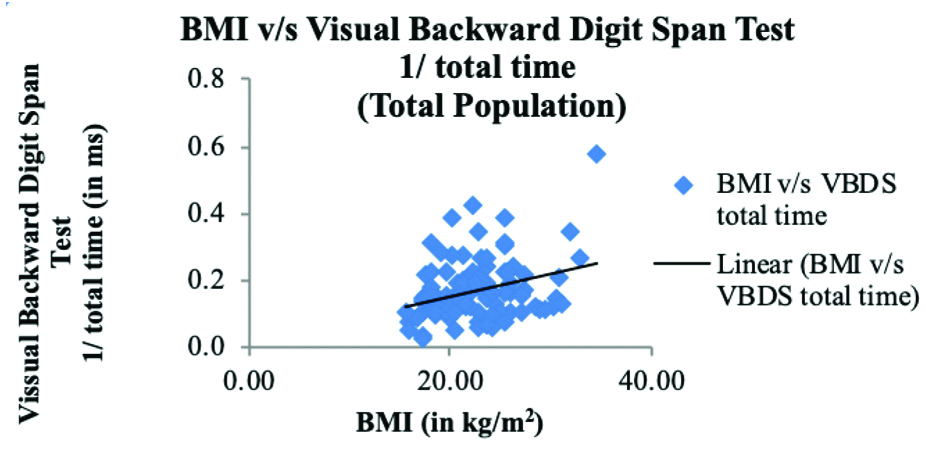
The time taken to give responses and the accuracy with which responses were given by subjects of various BMI categories (both whole population and after matching gender) in VFDS test were not found to be statistically significant [Table/Fig-4,5] (p>0.05) and the correlation [Table/Fig-6] was also found to be very weak (-0.3 < r < 0.3). However, in VBDS Test, when total population was considered [Table/Fig-4,5], the difference in response time of underweight and normal weight subjects (p=0.031); and underweight and overweight subjects (p=0.005) was found to be statistically significant (p<0.05) but the coefficient of correlation [Table/Fig-6] between reciprocal of response time and BMI was weakly positive (r=0.3) (0.3 < r < 0.5). [Table/Fig-8] shows a scatter chart between BMI and reciprocal of Total Time taken to give response by whole study population in VBDS Test.
A scatter plot is presented between BMI and 1/Total Time taken to give response by whole population In Visual Backward Digit Span Test (VBDS) (r=0.3*).
BMI: Body mass index
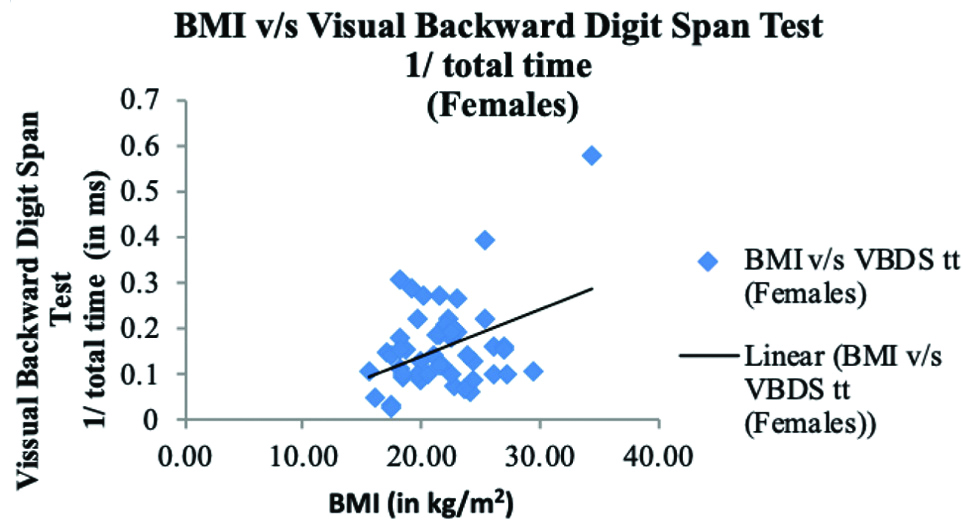
In female subjects, the difference [Table/Fig-4,5] in response time of underweight and normal weight (p=0.043); and underweight and overweight population (p=0.036) was found to be statistically significant (p<0.05) and the correlation [Table/Fig-6] between reciprocal of response time and BMI was weakly positive (r=0.4) (0.3 < r < 0.5). [Table/Fig-9] shows a scatter chart between BMI and reciprocal of Total Time taken by females to give response in VBDS Test. On the other hand, the male subjects of various BMI cohorts did not differ statistically [Table/Fig-4,5] in terms of their reaction times or accuracy (p>0.05) and the correlation [Table/Fig-6] was also very weak (-0.3 < r < 0.3).
A scatter plot is presented between BMI and 1/Total Time taken by females to give response in Visual Backward Digit Span Test (VBDS) (r=0.4*).
BMI: Body mass index
Discussion
Four domains of cognitive functions viz., attention, perception, executive functions and memory were assessed using VRT and ART, Go/No-Go VRT and ART; FC test EFT and ST and VFDS, VBDS test, respectively. The tests used were reaction time tests, where two parameters were studied which are correctness with which subjects gives response and the time taken by the subject to give response. So, it’s a paradigm in which the subject has to balance between correctness and time taken for response. The subject who gives most correct answers with maximum accuracy in least amount of time is labeled to have a good cognitive function [22]. Thus, the percentage correctness is directly related and the time taken to give response is inversely related to cognitive function domain.
The data was statistically analysed and compared different cognitive function tests in various categories of BMI (viz., underweight, normal and overweight). The study also found out certain gender based observations.
One of the novel observations of present study was that, the underweight subjects were associated with a poor cognitive performance. The observation of this study was consistent with observations of Sabia S et al., which suggested that BMI and persistent underweight over the adult life course is associated with poor cognitive functions in late mid-life and the key domain of cognition to be affected was executive functions (p<0.05) [23]. The present study findings were also consistent with Selvamani Y and Singh P who found that under-weight older adults experienced a reduced cognition (p<0.001) [24]. Another study by Fitzpatrick AL et al., observed that underweight people had an increased risk of dementia while being overweight was not associated and being obese, reduced the risk of dementia compared to those with normal BMI in elderly [12]. This suggests that decreased BMI does have a significant impact on the brain function. A few previous studies have given a reason of dysregulated hormone secretion which occurs in anorexia to be a cause of such cognitive decline [23]. A study by Hou Q et al., showed that being overweight reduced risk of cognitive impairment in elderly (p<0.001) [25]. Other studies pointed out that a significant amount of weight loss precedes the onset of dementia (p<0.003) [26] and accelerates by the time of diagnosis (p<0.001) [27]. This shows that weight loss can be an early indicator of cognitive decline.
While present study findings contradicted a few other studies by Elias MF et al., and Elias MF et al., which suggested that BMI and memory function are negatively related (p<0.003) in males [14,15]; and Mond JM et al., which suggested that BMI and focused attention are negatively related (p<0.05) in female children [16]; Baccouche MA et al., which suggested that BMI and working memory was negatively related (p < 0.05) in young adults [17] and Huang T et al., who found that young adults with high BMI performed poorly on tests used to assess their working memory (p<0.05) [28]. The domains of cognitive functions that were affected in these studies were similar to present study i.e., executive functions and working memory [14,15,17,23,28]. While attention and visuo-spatial skills were found not to be associated with BMI in a few other studies [13,17].
In most of the studies, the study population was of middle age group or geriatric population, while in present study younger population was studied. The chronic effect of obesity over cognitive functions to young population could be limited in this study group. However, it has already been documented that individuals with higher BMI in midlife have more cognitive decline in their old age as compared to those who do not have higher BMI in their midlife [29-33].
When the gender based data was analysed, it was observed that in males BMI was associated with executive functions, while in females BMI was associated with working memory. It has been documented that, male and the female brains have been shown to differ anatomically, functionally and biochemically at all stages of life [34]. Males and females have been attributed to differ in terms of cognitive functions [35]. It has been shown that males outperform females in spatial, working memory and mathematical abilities while females have advantages in verbal fluency, perceptual speed, accuracy and fine motor skills [19,34,35]. This difference points out that different mechanisms that could have occurred in males and females affecting the cognition differently and thus, future prospective studies are needed to clarify the underlying mechanism.
Limitation(s)
The current study was limited in several ways. The study was a cross-sectional study, so a causal relationship between BMI and cognitive function could not be established, thus a longitudinal study with special focus on underweight population in this respect is recommended to assess the effect of BMI on cognition over the life span. Another important limitation for the current study involves the manner in which obesity was quantified. BMI is known to be limited in many ways that includes concerns regarding the cut-points for BMI groups and failure to directly measure body fat.
Conclusion(s)
A weak positive correlation was found between BMI and reciprocal of time taken to give response to stimulus with interference in males in ST and BMI and reciprocal of time taken to give response in VBDS Test in Females.
BMI: Body mass index
(Mean±Standard deviation); BMI: Body mass index
UW: Under-weight; NW: Normal-weight; OW: Over-weight
*- Average time taken to respond to congruent (Time C) and incongruent stimuli (Time IC)
**- Average time taken to give response to stimulus with interference (Time IN) and without interference (Time N)
(p-value <0.05- Significant*, p-value <0.001- Statistically Highly Significant**); -Time taken to respond to congruent (Time C) and incongruent stimuli (Time IC); -Time taken to give response to stimulus with interference (Time IN) and without interference (Time N)
(p<0.05- Statistically Significant*, p<0.001- Statistically Highly Significant**); - time taken to respond to congruent (Time C) and incongruent stimuli (Time IC); - time taken to give response to stimulus with interference (Time IN) and without interference (Time N)
0.3 < r < 0.5-Weak positive correlation*, 0.5 < r < 0.7-Moderate positive correlation **, 0.7 < r < 1-Strong positive correlation*** -0.3 > r > -0.5 -Weak negative correlation****, -0.5 > r > -0.7-Moderate negative correlation*****, -0.7 > r > -1-Strong negative correlation******