The global burden of paediatric mortality in low resource settings is high with 5.9 million deaths per year in children under the age of five years [1]. A majority of childhood deaths are attributable to easily treatable illness [2]. It is estimated that about 60% of mortality in this population can be reduced by improving access to care [3]. A mortality benefit has been shown, by providing timely access to specialised emergency care [4]. An appropriate triage can help with timely admission of more sick children to the intensive care unit while others can be managed at wards. A triage can identify the sickest patient for early intervention and has the ability to substantially decrease paediatric mortality and morbidity by providing timely care for critically ill patients [5].
A triage system not only helps to cope with overcrowding but also improves the care by prioritising cases with severe illness in the Emergency Department (ED). There are several validated triage systems around the world [6,7] but, in India there is no use of any formal system of triage for children admitted to the emergency department. Most of the existing scoring systems have been developed to predict mortality in ICU admissions and include multiple physical and laboratory variables, making them time consuming and are thus difficult to implement in the emergency department. A simple scoring system ‘TOPRS’ developed by Bains HS et al., predicted the severity of illness and outcome in the emergency department, but no analysis exists of the reliability and validity of this score [8]. Although, it is feasible to evaluate triage tools in high resourced middle income countries, these studies are difficult to extrapolate to low resource settings, where the need for these tools is greatest. Measurement of the vital signs are time consuming and at times impractical [7], thus tools based on clinical signs can be used, to quickly asses the sickness and triage the patients.
Therefore, the present study was conducted to develop a triage scoring system using physical variables in order to identify paediatric patients with time sensitive illness requiring urgent treatment and ICU admission.
Materials and Methods
This cross-sectional study was conducted from May 2018 to September 2018 at a tertiary care teaching hospital. The ethical clearance and permission from the Institutional Review Board was obtained prior to initiation of the study. (Ref. No. KIMS/KIIT/S5/2018).
Inclusion criteria: All children aged 1 month to 18 years requiring admission to the paediatric ward or PICU were included in the study.
Exclusion criteria: Surgical patients, patients with trauma and those with life threatening illness requiring immediate resuscitation were excluded. From the probability of expected sensitivity of 0.70 in the previous study [11], a sample size of 322 patients was sufficient to validate the score.
Demographic information of all these patients including age and sex, along with various clinical variables i.e., heart rate, respiratory rate, respiratory effort, SpO2, CFT, temperature, level of consciousness and behaviour were noted in a predesigned proforma at the time of admission. Axillary temperature was measured using a mercury thermometer. Oxygen saturation was measured using a pulse oximeter. Each variable was scored depending on its severity as outlined in [Table/Fig-1] and a total score was obtained for each patient. Abnormal values for heart rate, respiratory rate, temperature and blood pressure were recorded according to standard Systemic Inflammatory Response Syndrome (SIRS) criteria [12], which includes fever of more than 38°C (100.4°F) or less than 36°C (96.8°F), heart rate of more than 90 beats per minute, respiratory rate of more than 20 breaths per minute or arterial carbon dioxide tension (PaCO2) of less than 32 mm Hg, and abnormal white blood cell count {>12,000/μL or <4,000/μL or >10% immature (band) forms}.
Clinical variables and their scoring according to severity.
| S. No. | Variables | Range | Score |
|---|
| 1 | Temperature | 36°C-38°C | 0 |
| <36°C, >38°C | 1 |
| 2 | Heart rate | bpm |
| <1 year | 110-160 | 0 |
| <110, >160 | 1 |
| 1-2 year | 100-150 | 0 |
| <100, >150 | 1 |
| 2-5 year | 95-140 | 0 |
| <95, >140 | 1 |
| 5-12 year | 80-120 | 0 |
| <80, >120 | 1 |
| >12 year | 60-100 | 0 |
| <60, >100 | 1 |
| 3 | Respiratory rate | per minute | |
| >1 year | 30-40 | 0 |
| <30, >40 | 1 |
| 1-2 year | 25-35 | 0 |
| <25, >35 | 1 |
| 2-5 year | 25-30 | 0 |
| <25, >35 | 1 |
| 5-12 year | 20-25 | 0 |
| <20, >25 | 1 |
| >12 year | 15-20 | 0 |
| <15, >20 | 1 |
| 4 | Respiratory effort | Nil | 0 |
| Mild | 1 |
| Moderate | 2 |
| Severe | 3 |
| 5 | SpO2 (%) | >90 | 0 |
| <90 | 1 |
| 6 | CRT (sec) | <3 | 0 |
| >3 | 1 |
| 7 | Level of consciousness | A-Alert | 0 |
| V-Response to voice | 1 |
| P-Response to pain | 2 |
| U-Unresponsive | 3 |
| 8 | Behaviour | Playing/sleeping | 0 |
| Irritable/lethargy/confused | 1 |
| Reduced response to pain | 2 |
bpm: Beats per minute; SpO2: Oxygen saturation, CRT: Capillary refill time
The abnormal value for respiratory effort, SpO2, CFT and AVPU (Alert, Voice, Pain, Unresponsive) were as per Advanced Paediatric Life Support [13]. Normal variable was given a score of zero and abnormal variable a score of one for temperature, heart rate, respiratory rate, SpO2 and CRT. For the rest three variables, depending on the severity the score assigned varied from 0 to 3. The outcome (admission to ward or PICU) was correlated with the study variables and total score.
Statistical Analysis
Frequency and percentage were reported for all the categorical independent variables and association of such variables with PICU and ward admission was done using either Chi-square test or Fisher’s-exact test followed by univariate binary logistic regression analysis. Odds ratios with 95% confidence intervals were calculated and reported for each predictor variable. Finally, a modified PETS was developed by taking and summing up all the significant factors together into consideration and a Receiver Operating Characteristic (ROC) curve analysis was performed to discriminate between ward and PICU admission (i.e., predictive ability) and to identify a relevant cut-off at which patient was admitted to PICU. Additionally, an association of modified PETS with the PICU admission was done using Chi-square test. The data were analysed using standard statistical software Stata 15.1. A p-value of <0.01 was considered as statistically significant.
Results
Out of 936 patients admitted, 211 were admitted to PICU. Among the total patients, majority {323 (34.5%)} were in the age group 5-12 years, 598 (63.8%) were males while 338 (36.1%) were females. The distribution of children with each clinical variable (normal/abnormal) along with the predictors of outcome (admission to ward/ PICU) is shown in [Table/Fig-1]. As shown in the [Table/Fig-2], children belonging to the higher age group were less likely to get admitted in ICU. Female was found to be less sick as compared with the male children (OR=0.72; p=0.048). Risk of PICU admission was found to be 2 times higher associated with the higher temperature as compared to the risk associated with low temperature. Except gender, all other variables were significantly associated with outcome (p<0.01).
Predictors of ward/PICU admission.
| Parameters | Ward group N (%) | ICU group N (%) | Odds ratio (95% CI) | p-value |
|---|
| Age (years) |
| <1 | 92 (55.4) | 74 (44.6) | 1.00 | |
| 1-2 | 45 (84.9) | 8 (15.1) | 0.22 (0.10-0.50) | <0.001 |
| 2-5 | 198 (80.2) | 49 (19.8) | 0.31 (0.20-0.48) | <0.001 |
| 5-12 | 270 (83.6) | 53 (16.4) | 0.24 (0.16-0.37) | <0.001 |
| >12 | 120 (81.6) | 27 (18.4) | 0.28 (0.17-0.47) | <0.001 |
| Gender |
| Male | 451 (75.4) | 147 (24.6) | 1.00 | 0.048 |
| Female | 274 (81.1) | 64 (18.9) | 0.72 (0.51-0.99) |
| Temperature |
| 36°C-38°C | 624 (79.8) | 158 (20.2) | 1.00 | <0.001 |
| <36°C, >38°C | 101 (65.6) | 53 (34.4) | 2.07 (1.42-3.01) |
| Heart rate |
| Normal for age | 662 (83.7) | 129 (16.3) | 1.00 | <0.001 |
| Abnormal for age | 63 (43.4) | 82 (56.5) | 6.68 (4.57-9.75) |
| Respiratory rate |
| Normal | 307 (85.7) | 51 (14.2) | 1.00 | <0.001 |
| Abnormal | 418 (72.3) | 160 (27.7) | 2.30 (1.63-3.26) |
| Respiratory effort |
| Nil | 721 (86.5) | 112 (13.4) | 1.00 | <0.001 |
| Mild | 4 (17.4) | 19 (82.6) | 30.6 (10.21-91.53) |
| Moderate | 0 (0.0) | 52 (100.0) | -- |
| Severe | 0 (0.0) | 28 (100.0) | -- |
| CRT (sec) |
| <3 | 711 (79.1) | 188 (20.9) | 1.00 | <0.001 |
| >3 | 14 (37.8) | 23 (62.2) | 6.21 (3.14-12.31) |
| SpO2 |
| >90 | 717 (81.0) | 168 (19.0) | 1.00 | <0.001 |
| <90 | 8 (15.7) | 43 (84.3) | 22.94 (10.57-49.70) |
| Level of consciousness |
| Alert | 724 (85.4) | 124 (14.6) | 1.00 | <0.001 |
| Response to voice | 1 (2.9) | 33 (97.1) | 192.7 (26.1-1421.6) |
| Response to pain | 0 (0.0) | 37 (100.0) | -- |
| Unresponsive | 0 (0.0) | 17 (100.0) | -- |
| Behaviour |
| Playing/sleeping | 724 (99.7) | 2 (0.3) | 1.00 | |
| Irritable/lethargy/confused | 1 (0.5) | 185 (99.5) | -- |
| Reduced response to pain | 0 (0.0) | 24 (100.0) | -- |
| Modified PETS |
| <6 | 574 (79.2) | 43 (7.0) | 1.00 | <0.001 |
| ≥6 | 151 (47.3) | 168 (79.6) | 14.85 (10.16-21.72) |
HR: Heart rate; RR: Respiratory rate; CRT: Capillary refill time; SpO2: Oxygen saturation;
PETS: Modified paediatric triage score; ICU: Intensive care unit
Binary logistic regression was used to identify the predictors of ICU admission (in comparison to ward admission)
Children with abnormal respiratory rate were found to be 2.3 times higher risk of PICU admission compared with the normal respiratory rate. Odds ratio associated with mild respiratory effort was found to be 30.6 times higher risk of ICU admission. A child with more than 3 second of CRT was found to be 6.2 times higher risk of developing PICU admission. A child with less than 90% SpO2 was found to be 23 times higher risk of developing ICU admission as compared with the child who had more than 90%. Response to pain, unresponsiveness, moderate and severe respiratory distress as well as abnormal behaviour (Irritable/lethargy/confused/reduced response to pain) predicted the risk of PICU admission perfectly and therefore the associated odds ratio could not be quantified.
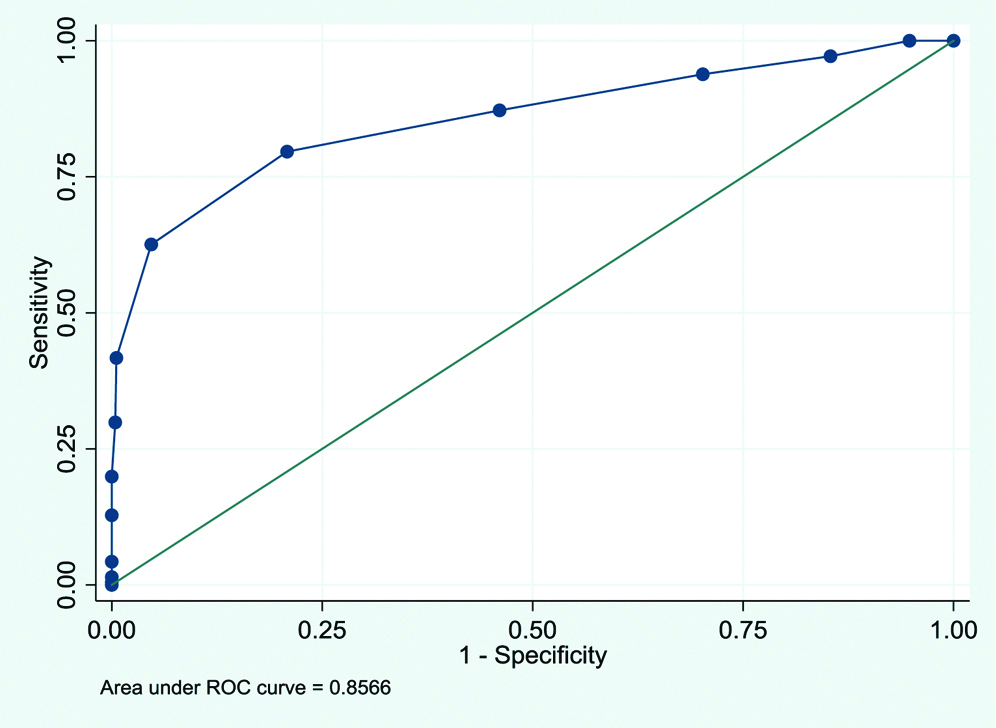
A modified PETS developed based on the above described parameters was found to be reliable in discriminating the children patients with ward and ICU admission (Area Under the Receiver Operating Characteristic Curve (AUROC)=85.6%). This score was further dichotomised by considering the cut-offs value of <6/≥6 (at optimum diagnostic accuracy) which was found to be significantly associated with PICU admission [Table/Fig-2]. A child with modified PETS of ≥6 was found to be 14.8 times higher risk of getting admission in ICU as compared with the child who had the score value of <6. A cut-off of ≥6 for modified PETS was quantified using the optimum values of sensitivity i.e., 79.6% and specificity i.e., 79.2%. 95% Confidence Interval of ROC was 0.86 (0.82-0.89) [Table/Fig-3].
Discrimination ability of the modified triage score.
Discussion
In the present study, a total of eight physical variables were studied, out of which on univariate analysis, all abnormal variables except gender were significantly associated with outcome. This was in contrast to study done by Bains HS et al., in which out of total of six physical variables studied, 3 variables viz., temperature, oxygen saturation and respiratory rate were having a significant effect on outcome [8].
In this study, the area under ROC curve was 85.6% which is an indication of very good predicting ability for admission to ICU. This was similar to that reported by Bains HS and Soni RK, where the predictive ability of the score was found to be 81.7%. In studies conducted simultaneously in India and England for assessing severity of illness by using sick score, the predictive ability was found to be 84.1% [8,14].
In the clinical score “TOPRS” done by Bains HS et al., maximum discrimination was seen at a score of 2.5 with sensitivity of 79.6 and specificity of 74.4. This study showed a similar result. A cut-offs score of ≥6 showed maximum discrimination with 79.6% sensitivity and 79.2% specificity in this study. Paediatric Advance Warning Score (PAWS), a scoring system was used in an emergency department of a tertiary care hospital in England to determine its correlation with admission to PICU [15]. A score of 3 or more was able to identify patients needing paediatric ICU admission with sensitivity of 70% and a specificity of 90%. This finding is in contrast to the present study.
Seiger N et al., evaluated ten different PEWS and found it to be moderate to good in predicting admission ICU [16] with a sensitivity ranging from 61.3-94.4% and specificity of 25.2-86.7%. Finding from this study revealed that the diagnostic indices such as sensitivity and specificity were found to be higher.
The study by Breslin K et al., evaluated the association between PEWS at time of ED disposition and whether this system could predict the need for admission [17]. They found that an increase in PEWS was associated with increased risk of needing ICU admission and that a PEWS of one had the highest discrimination ability to predict admission, while a PEWS of three or higher predicted the need for an ICU bed. They found that PEWS in patients with respiratory complaints only had increased sensitivity and specificity with regard to predicting admission compared to the entire study group and therefore concluded that the PEWS does not provide adequate sensitivity and specificity to be used in isolation.
In this study, elevated PETS were statistically associated with the need for ICU care. Additionally, it was seen that the PETS system can be implemented in a busy ED and with excellent reliability and the optimal cut-off score was ≥6. Studies involving PEWS show similar conclusion that an elevated score is associated with sicker patients with higher risk of needing ICU admission [10,14,16]. The present study shows, cut-off of PETS determined in the ED can reliably predict the need for ICU admission as against the earlier reported PEWS by Gold DL et al., [18]. Such reported increased PEWS which do not reflect actual illness mainly because the patients are in the ED for a relatively limited time whereas this scoring system was originally designed for the inpatient setting where patients are on prolonged periods of observation.
Limitation(s)
This was a single institution analysis and cannot be generalized. This pilot study requires multicentric studies with larger sample size for generisation of the score.
Conclusion(s)
A simple clinically developed scoring system “PETS” based on physical variables alone with an optimal cut-off of ≥6 can predict severity of illness and need for PICU admission in paediatric ED with acceptable validity and can serve as a potentially excellent screening tool. Therefore, all children should have their PETS recorded in the emergency department so that children with PETS ≥6 can be immediately attended by paediatric intensivists and their treatment prioritised to prevent further detoriation.
bpm: Beats per minute; SpO2: Oxygen saturation, CRT: Capillary refill time
HR: Heart rate; RR: Respiratory rate; CRT: Capillary refill time; SpO2: Oxygen saturation;
PETS: Modified paediatric triage score; ICU: Intensive care unit
Binary logistic regression was used to identify the predictors of ICU admission (in comparison to ward admission)