Globally, obesity is one of the most important chronic medical conditions which affects cell metabolism and there increase in adipose tissue, thereby increasing the risk of metabolic syndrome such as Cardiovascular Diseases, hypertension and Type 2 Diabetes Mellitus (T2DM) [1-4]. The prevalence of obesity among children and adolescents is a risk factor for chronic diseases in adulthood, and consequently affects morbidity/mortality in future [5,6]. Obesity is an excess of body fat or adiposity, whether measured by the Body Mass Index (BMI) or body fat [7,8]. Excess adiposity is related to IR, as indexed by elevated HOMA-IR levels [7].
Insulin resistance is a key factor of the metabolic syndrome, and correlates positively with obesity [9,10]. As a consequence of IR in obesity, there is impairment of glucose metabolism [11]. Accordingly, IR plays an important roles in the development of T2DM [12]. In a recent research, Guerrero-Romero et al., proposed that a new fasting index for the early recognition of IR, the product of fasting TyG index. HOMA-IR is a gold standard technique for assessing IR, however this method is difficult and expensive [13]. In addition, the advantage of TyG index is its easily applicability in the clinical setting and it does not require measurement of insulin levels [14].
Recently, the TyG index was evaluated in some diseases (T2DM, CVD), and ethnic groups such as Mexican-Americans and Caucasians from the San Antonio, Koreans, Argentine, Italian, and Brazilian adults [15-18], however it has not yet been determined in the ethnic groups in Southeast Asia. Because, some studies reported that TyG index was different depending upon ethnicities [15-18], hence this study aimed to investigate the association between the TyG index, clinical parameters, and IR for pathogenesis risk of surrogate IR in Thai obese adolescents.
Materials and Methods
The present cross-sectional study was carried out in 300 adolescents between the age group of 13-18 years selected from the Obesity Outpatient Clinic of Mahasarakham Provincial Public Health Office from 2009 to 2013. The Ethical Committee of Mahasarakham University approved this research (number: 0128/2008).
Sample Size Calculation
The sample size was calculated by Cohen [19] for multiple regression analysis with the outcome of IR at a significance level of 5% (α=0.05), statistical power of 0.9, and assuming 20%
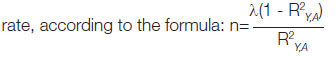
The lambda (λ) value depended on the degree of freedom of the denominator of the v value. v=N-u-1 and v value was taken from Cohen [19] to obtain the lambda value; N is sample size from previous study [20] and u is independent variables. While R2Y,A is the observed multiple correlation coefficient of the model from previous study.

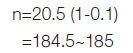
For a trail value of v=71, λ=20.5, substituting λ into the sample size formula, gives R2Y,A=0.1 multiple correlation coefficient of the model from Vasques AC et al., [20].
Calculating for a 20% drop-out by formula: Nd=N/(1-R)2 where N is the sample size calculated no dropouts, Nd that required with dropouts and R dropout rate is expected from Lachin JM et al., and approximately 300 [21].
Inclusion criteria were age 13-18 years and obesity following BMI cut-off points by Cole TJ et al., [22]. Adolescents whose BMI was between 20.90-33.63 kg/m2 were included and those whose BMI were not in this range were excluded from the study. Informed consent was obtained from the subjects and their parents before the study.
Demographic information including age, sex, family history of diabetes, and family history of obesity were collected from all the participants using a detailed proforma. For all the subjects, family history of diabetes and obesity was obtained from their parents, sibling and grandparents. The proforma was adapted from Ethical Committee of Mahasarakham University.
Anthropometry
Weight and height (without shoes) were measured by carefully calibrated beam balance (Detecto@) for weight and a vertical measuring rod for height. These measurements were used for the calculation of BMI for each subject. Skin fold thickness was measured at the biceps and triceps with a calliper according to standard procedures; the average of three readings was recorded in millimeter.
Laboratory Determinations
A 10 mL of fasting blood samples were obtained from all the subjects by nurses and medical technologists. They were immediately processed and divided into aliquots and stored at -80°C for further analyses. The levels of TG were determined using commercially available test kits from Siemens Healthcare Diagnostic Inc®. Fasting Blood Sugar (FBS) levels were calculated using enzymatic test kits from Dade Behring Inc®. In addition, fasting serum insulin was measured by radioimmunoassay test from Linco Research, Inc®. TG and FBS were used to calculate TyG index by multiplying TG (mg/dL) with FBS (mg/dL) and dividing the product by 2 [18]. The TyG index was categorised into three groups based on tertiles of their natural distributions.
Insulin Resistance (IR)
Evaluation of IR was done through the HOMA-IR, which is the product of fasting serum insulin (μU/mL) and FBS (mmol/L) and divided by 22.5 [23]. IR was defined as HOMA-IR value with higher than 90th percentile of the subjects [17].
Statistical Analysis
The TyG index groups were divided by the concept of self-cutting point as tertiles mode score group ranking of existed data by STATA software. The descriptive statistics as mean and standard deviation was performed for clinical variables, and the differences of those variables in TyG groups were assessed by using ANOVA. Bivariate odds ratio (OR) to examine the association of each factor and IR was conducted. From bivariate analysis, factors with a value where p<0.05 were selected for multiple logistic regression. The adjusted OR estimated by multiple logistic regression indicated the association between the IR and TyG index after adjustments were made for others factors. The reference group of IR was lower than 90th percentile. The statistical significance level was set as a p-value <0.05, and STATA version 13.0 software was implied for all data analyses.
Results
The clinical laboratory parameter for all subjects according to TyG index groups is illustrated in [Table/Fig-1].
Clinical parameters for all subjects according to TyG index groups.
| Parameters | Q1 | Q2 | Q3 | p-value |
|---|
| Number of subjects (n) | 100 | 100 | 100 | |
| Age (years) | 15.51±1.74 | 15.14±1.63 | 14.55±1.48 | <0.001** |
| Sex (M/F) | 25/75 | 28/72 | 28/72 | 0.535 |
| BMI (kg/m2) | 25.05±4.15 | 26.59±4.35 | 28.91±4.72 | <0.001** |
| FBS (mg/dL) | 85.62±6.67 | 86.40±5.97 | 90.28±14.45 | <0.001** |
| TG (mg/dL) | 50.84±13.27 | 89.89±12.21 | 173.76±63.68 | <0.001** |
| Bicep (mm) | 16.65±6.75 | 18.65±7.87 | 20.04±7.09 | 0.012* |
| Tricep (mm) | 21.34±7.92 | 22.32±8.56 | 24.32±7.28 | 0.022* |
| TyG index | 2.16±0.26 | 3.87±0.53 | 7.88±3.35 | <0.001** |
| HOMA-IR | 0.43±0.24 | 0.47±0.24 | 0.75±0.83 | <0.001** |
| Family history of diabetes (%) | 51 (51.00) | 42 (42.00) | 47 (47.00) | 0.848 |
| Family history of obesity (%) | 32 (32.00) | 35 (35.00) | 26 (26.00) | 0.808 |
Data are the mean±SD and number (percentage)
p<0.05* statistically significant (ANOVA)
p<0.001** statistically highly significant (ANOVA)
The subjects were stratified into tertiles based on their TyG index levels and dividing the data by STATA software. Few factors including age, BMI, FBS, and TG were statistically highly significant (p<0.001) among the three groups. The tertile (Q3) with the highest mean TyG index also had higher BMI, FBS, TG, bicep, tricep HOMA-IR than (Q2 and Q1). However, sex, family history of diabetes and obesity were not significantly different among the tertile groups. In the same way TyG and HOMA-IR were significantly different among the tertiles (p<0.001).
The association between the TyG index and IR was further explored by categorising the HOMA-IR into high and low. In the bivariate logistic regression analysis, it was observed that HOMA-IR and TyG index were significantly highly associated (3.19; 95% CI 1.782, 5.369; p<0.001), whereas BMI and tricep thickness were significantly associated (p<0.05) with HOMA-IR [Table/Fig-2].
Association of factors and IR with adolescent obesity using Bivariate logistic regression.
| Factor | Crude OR | 95% CI | p-value |
|---|
| Age | -1.78 | 0.186, 1.08 | 0.06 |
| Sex | 0.04 | 0.434, 2.390 | 0.965 |
| BMI | 2.28 | 1.143, 4.857 | 0.018* |
| Bicep | 1.89 | 0.972, 3.773 | 0.052 |
| Tricep | 1.96 | 1.020, 3.917 | 0.043* |
| TyG index | 3.19 | 1.782, 5.369 | <0.001** |
| Family history of diabetic |
| No | 1 | | |
| Yes | 0.39 | 0.542, 2.484 | 0.699 |
| Family history of obesity |
| No | 1 | | |
| Yes | 0.54 | 0.541, 2.953 | 0.583 |
OR: Odds ratio, CI: Confidence interval, p<0.05* statistically significant, p<0.001** statistically highly significant
In the multiple logistic regression analysis in fully adjusted OR, the association between TyG index and HOMA-IR was adjusted for other factors including BMI and tricep (3.06; 95% CI 1.780, 5.170; p<0.001) [Table/Fig-3].
Odds ratios for TyG index on IR based on multiple logistic regression.
| Factor | Crude OR | Adjusted OR | 95% CI | p-value |
|---|
| TyG index | 3.19 | 3.06 | 1.780, 5.170 | <0.001** |
p<0.001** statistically highly significant
The multiple logistic regression model included variables with p-value <0.05.
Discussion
In the present study, the association between the BMI, tricep and TyG index with HOMA-IR in Thailand obese adolescents in a fully adjusted model was identified. Furthermore, no significant association between sex, age, bicep, family history of diabetes, and family history of obesity with HOMA-IR was found. To the best of our knowledge, this is the first study on ethnic groups in Southeast Asia in obese adolescents to investigate the relationship between increasing levels of TyG index and HOMA-IR. And, the findings were in agreement with other researches that HOMA-IR is not only associated with TyG index, but also other body adiposity indicators such as percentages of total and central body fat, and waist-to-height ratio [17].
A study by Moon S et al., had similar findings, they proposed that TyG index was a good surrogate for insulin sensitivity in Korean adolescents, and cutoff point with sensitivity (89.8%) and specificity (83.1%) had a value of 8.55 [24]. As, IR is characterised with a decrease in cell sensitivity to insulin, and it is one of the leading factors for causing metabolic disease especially T2DM [14,25,26]. Some researchers have explained that TyG index is correlated with IR and TyG index has been considered to be a surrogate marker of IR [14,15,27]. In addition, Kodama K et al., proposed that ethnic differences should be considered for IR risk [28]. Moon S et al., also suggested that studies based on ethnic and gender-specific characteristics of TyG index in adolescents are lacking [24]. Therefore, the present study showed that TyG index was associated with IR in Thailand obese adolescents, when the association was adjusted with factors of obesity including BMI and tricep thickness. This result corroborates the previous finding that TyG index and HOMA-IR were positively correlated (p<0.001) in Caucasian children [29], and with Dikaiakou E et al., who studied Greek children and adolescents and found that TyG index showed a positive correlation with IR [30]. Few researchers in Thailand, studied about TyG index, Chamroonkiadtikun P et al., reported that TyG index was associated with risk of T2DM and could be used as a biomarker of developing T2DM in adults [31].
The TyG index level was likewise significantly associated with HOMA-IR in bivariate and multiple logistic regression analysis. Our results correspond to Kang B et al., who reported that the association was found to be (r=0.41) between the TyG index and HOMA-IR in Korean adolescents [32]. Meanwhile, Locateli JC et al., showed that HOMA-IR had a positive correlation with TyG index (r=0.46, p<0.001) and TG/HDL index (r=0.36, p<0.001) in South American overweight and obese children and adolescents [33]. Additionally, association between TyG index and HOMA-IR from bivariate analysis (p<0.001) was found and also found a significant association between the TyG index and HOMA-IR after adjusted with BMI, and tricep (p<0.001). Thus, HOMA-IR is not only associated with TyG index, but also other obesity risk factors. In a recent study, Vieira-Ribeiro SA et al., reported that body adiposity is positively associated with IR, evaluated with the TyG index by multiple linear regression (β=0.010, 95% CI=0.003-0.013; p<0.001) [17]. The triceps skinfold thickness is a simple anthropometric measurement while screening for adiposity in male children and adolescents [34,35]. Chao YP et al., showed that Mid-Arm Muscle Circumference (MAMC) can be used as a surrogate marker in predicting IR in non obese elderly, since MAMC had a significant association with HOMA-IR (r=0.213, p<0.05). And they mentioned that MAMC may have substantial additional value in screening for IR [35]. While Abe Y et al., showed that increased abdominal adiposity as assessed by waist-to-height ratio was related with an increased prevalence of IR, as evaluated by the HOMA-IR [36].
Limitation(s)
The limitations of the study included the cross-sectional design which limited the ability to infer a causal association between TyG index and IR. The pubertal stage was not evaluated. Because obesity in adolescents was associated with higher HOMA-IR values and IR increased at the end of pubertal maturation, adolescents obesity can have a possible influence on the TyG index. Further experiments designed to investigate the role of pubertal stage in association with TyG index will help clarify the role of puberty in obesity adolescent.
Conclusion(s)
In conclusion, the results of TyG index was significantly associated with IR, in Thai obese adolescents, hence confirmed that TyG index can be used as a surrogate marker for IR. However, further experiments are needed to clarify the mechanisms of this association.
Data are the mean±SD and number (percentage)
p<0.05* statistically significant (ANOVA)
p<0.001** statistically highly significant (ANOVA)
OR: Odds ratio, CI: Confidence interval, p<0.05* statistically significant, p<0.001** statistically highly significant
p<0.001** statistically highly significant