Spinal anaesthesia or SAB is a safe, inexpensive, reliable and effective method for providing regional anaesthesia for caesarean sections and lower abdominal surgeries [1]. It is widely performed in developing countries like India and requires less technical skill in comparison to epidural or combined spinal-epidural anaesthesia. The success rate of SAB depends on many technical factors including skill and experience of the anaesthesiologist, anatomy of patient’s spine, patient positioning etc. A failure in obtaining Cerebrospinal Fluid (CSF) despite proper spinal needle placement is considered as technical failure which requires needle redirection or reinsertion.
An estimation of the DSS has been shown to act as a depth guide for proper needle placement. It reduces the number of unsuccessful or repeated attempts and traumatic or bloody tap [2]. The DSS varies considerably in different individuals and even at different levels of the spinal column in the same individual [3]. Hence, a pre-procedure estimation of DSS may be a good guide for the selection of appropriately sized spinal needle and proper needle placement. A conventional spinal needle may be too long for a lean patient, or short for an obese patient. This might cause multiple unsuccessful punctures, causing patient discomfort [4]. Therefore, a correlation between physical parameters with DSS may help in avoiding such unsuccessful punctures. Only few studies estimating DSS in the adult Indian population are there. These have rarely evaluated gender, age, BMI for DSS [5]. Hazarika R et al., observed that DSS correlated with the BMI in their study [1]. Prakash S et al., observed gender-based differences in DSS (male>female), and correlation with BMI [4]. Hence, an observational study was designed to evaluate the variation of DSS in male and the non-pregnant female population at a tertiary care hospital in India.
This study was conceived to assess the variation of DSS with anthropometric indices in the Indian population, to derive formulae for predicting DSS, to check the usefulness of previously suggested formulae in Indian population.
Materials and Methods
This cross-sectional study was conducted at a tertiary care centre in India from August 2017 to July 2018 over a period of one year. Prior ethical permission was taken from the Institutional Ethics Committee (EC/18/2017, dated 12.04.2017).
Inclusion criteria: A total of 700 ASA physical status I and II patients of either sex, aged 18-65 years, who had undergone various elective surgeries below umbilicus under spinal anaesthesia.
Exclusion criteria: Patients having local pathology at the site of injection, belonging to ASA grade III or above, pregnant patients, bleeding disorders, unable to maintain sitting position without assistance, presence of kyphosis, lordosis, scoliosis, or failed SAB and those who did not cooperate or refused to participate in the study.
Thorough pre-anaesthetic check-up was done for each patient. Written informed consent was taken from each of the 700 enrolled patients for participation in the study. The height (cm), weight (kg) and waist circumference (WC, cm) were measured and Body Mass Index (BMI, kg/m2) and Weight Height Ratio (WHR) were calculated. The following formulae were used to determine predicted DSS in this study population:based on weight:
DSS (mm)=0.5×Weight (kg)+18 [6];
Height: DSS (cm)=0.03×height (cm) [7];
WHR: DSS (cm)=0.69+(10.1×WHR) [8]; and
BMI: DSS (cm)=0.56+(0.18×BMI) [8].
In the operation theatre, SAB was performed in the sitting position, by median approach, with 25G Quincke’s spinal needle (8.9 cm) at L4-L5 interspace under all aseptic precautions. It was done by an anaesthesiologist with more than 3 years of experience. Patients were excluded from the final analysis if a different space or paramedian approach was chosen for SAB or in case of traumatic lumbar puncture.
Following deposition of drug in subarachnoid space, the point of contact with the skin was marked with a sterile marker on the needle before removal. The length of the needle which was inside the body was then measured with a standard scale and recorded. The following parameters were noted in all patients: position, approach, space at which SAB was performed, depth of spinal needle inserted (cm) and failure of SAB.
Statistical Analysis
The sample size was calculated based on a previous study [8] with the formula for the cross-sectional study with a quantitative variable [9]. At 95% confidence interval, 80% power and expected correlation coefficient (r=0.107), the required sample size was 683. Considering the potential drop-outs, 700 patients were included in this study.
Data were statistically described in terms of (mean±SD), frequencies (number of cases) and percentages wherever appropriate. Data were tested first for normal distribution by Kolmogorov-Smirnov test. Comparison of quantitative variables between the study groups was done using Student t-test for independent samples if normally distributed. Mann-Whitney U test was used for non-normally distributed quantitative data. For comparing categorical data, Chi-square test was performed. Fisher’s exact test was used instead when the expected frequency is less than 5. A probability value (p-value) less than 0.05 was considered statistically significant. All statistical calculations were done using computer programs Microsoft Excel 2016 (Microsoft Corporation, NY, USA) and SPSS version 21 (Statistical Package for the Social Science; SPSS Inc., Chicago, IL, USA).
Results
Seven hundred patients were recruited and 15 patients were excluded from the final analysis because of violation of study protocol. Thus, final data analysis was performed on 685 patients of which 434 were males and 251 were non-pregnant females. There was no significant age difference between men and women (p=0.202). Most of the patients were in the age group of 58-65 years (24.08%). The demographic profile of the patients, DSS (measured and predicted using various variable based formulae are shown in [Table/Fig-1].
| Parameters | n=685 | p-value |
|---|
| Age (year) (mean±SD) | 43.95±15.35 | - |
| Age distribution (years) | Frequency (%) | - |
| 18 to 28 | 124 (18.1) |
| 28 to 38 | 108 (15.76) |
| 38 to 48 | 145 (21.16) |
| 48 to 58 | 143 (20.87) |
| 58 to 65 | 165 (24.08) |
| Sex (M/F) (%) | 434/251 (63.35/36.65) | - |
| Male (mean age in years)=43.62±15.28 | 0.202 |
| Female (mean age in years)=42.08±15.05 |
| ASA (I/II) | 598/87 (87.29/12.71) | - |
| Weight (kg) | 61.46±0.355 | - |
| Height (cm) | 163.13±0.260 | - |
| WHR | 0.3767±0.002 | - |
| BMI (kg/m2) | 23.1333±0.137 | - |
| WC (cm) | 83.27±0.253 | - |
| DSS (cm) |
| Observed/Measured | 4.60±0.602 |
| Predicted based on weight | 4.87±0.469 |
| Predicted based on height | 4.89±0.206 |
| Predicted based on WHR | 4.49±0.564 |
| Predicted based on BMI | 4.72±0.653 |
M: Male; F: Female; ASA: American society of anaesthesiologists; WHR: Weight height ratio; BMI: Body mass index; WC: Waist circumference; DSS: Distance from skin to subarachnoid space; n: Number of patients
The DSS (measured and predicted) using various variable based formulae are presented in [Table/Fig-1]. The mean measured depth among 434 male subjects was 4.60±0.5818 cm and among 251 female subjects was 4.61±0.6377 cm. This was found to be statistically non-significant (p-value=0.726).
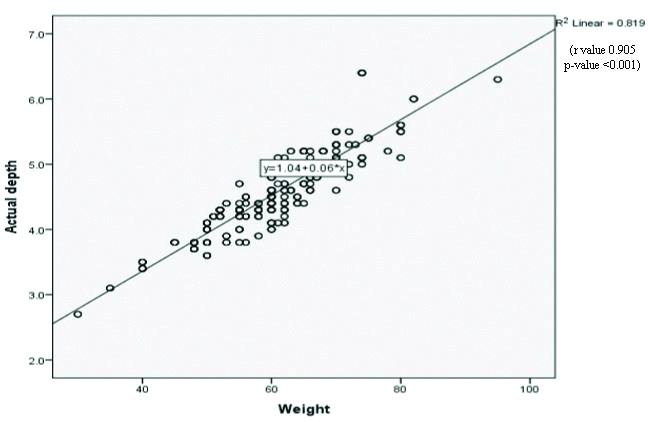
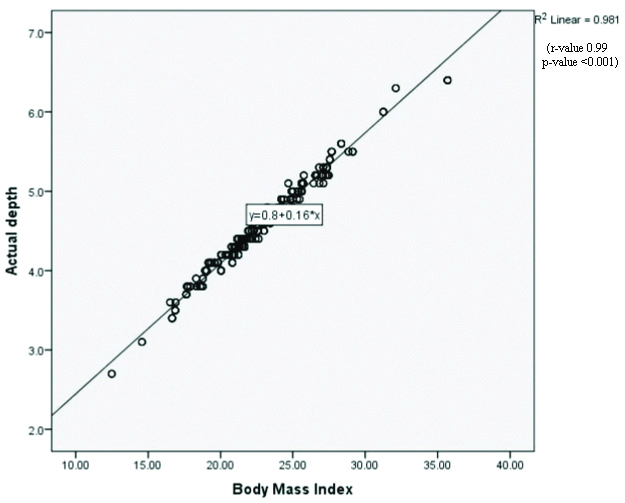
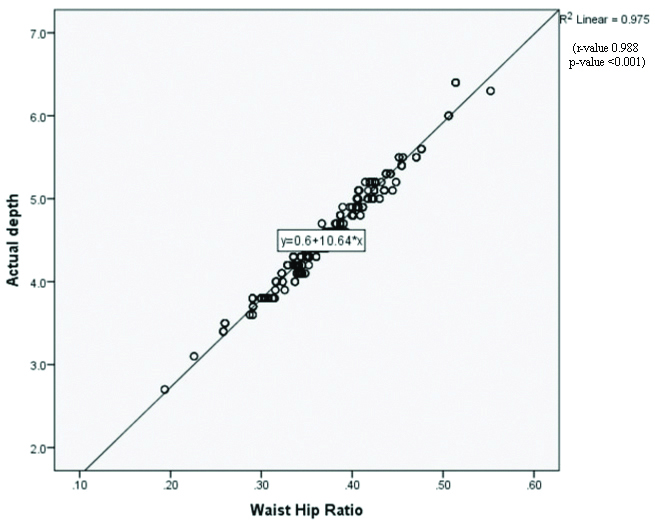
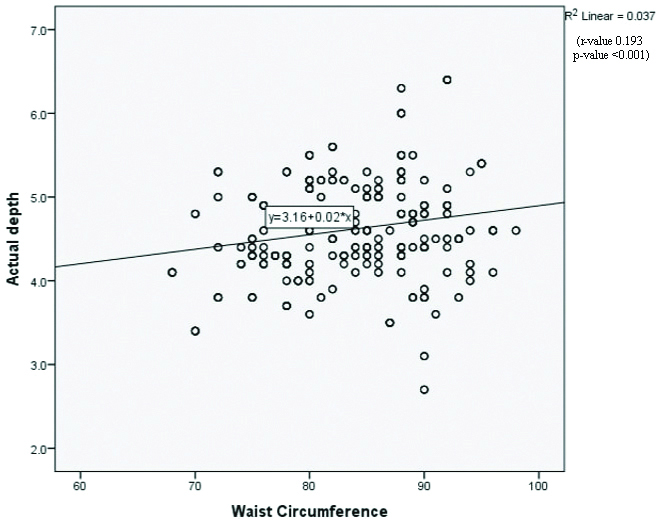
The strength of correlation between measured DSS and Anthropometric Indices was calculated. A significant correlation between DSS and weight, BMI, WHR and WC were found. (p<0.001) [Table/Fig-2]. The statistically significant correlations are plotted in the graphs [Table/Fig-3,4,5 and 6]. No statistically significant correlation between age, height and DSS was found.
Correlation between measured DSS and anthropometric indices.
| Parameters | r-value | p-value | R2 |
|---|
| Age | -0.035 | 0.349 | 0.001 |
| Weight | 0.905 | <0.001 | 0.819 |
| Height | -0.142 | 0.413 | 0.020 |
| WHR | 0.988 | <0.001 | 0.976 |
| WC | 0.193 | <0.001 | 0.037 |
| BMI | 0.99 | <0.001 | 0.980 |
WHR: weight height ratio; BMI: Body mass index; WC: Waist circumference; DSS: Distance from skin to subarachnoid space; Pearson Correlation test. p-value <0.05 to be considered significant
The scatter plot showing correlation between DSS and body weight (r value 0.905 and p-value <0.001).
The scatter plot showing correlation between DSS and BMI (r value 0.99 and p-value <0.001)
The scatter plot showing correlation between DSS and WHR (r value 0.988 and p-value <0.001)
The scatter plot showing correlation Between DSS and WC (r value 0.193 and p-value <0.001).
DSS: Distance from skin to subarachnoid space; WC: Waist circumference
The mean difference between predicted and measured DSS and their correlation were calculated [Table/Fig-7]. It was observed that BMI and WHR had a stronger correlation in predicting DSS. (r-values 0.991 and 0.988, respectively).
Correlation of predicted depths with actual measured depth.
| Predicted DSS by | Mean difference from measured DSS | r value |
|---|
| Weight | 0.27 | 0.905 |
| Height | 0.29 | 0.142 |
| WHR | -0.11 | 0.988 |
| BMI | 0.12 | 0.991 |
WHR: Weight height ratio; BMI: Body mass index; DSS: Distance from skin to subarachnoid space
SAB was successful in first attempt in 624 (91.09%) patients, second attempt in 47 (6.86) patients and third attempt in 11 (1.60) patients. There was a failure of SAB in 3 (0.43%) out of the 685 subjects in this study.
Discussion
In this study, the measured mean DSS was 4.60±0.602 cm (range 2.7 to 6.4 cm). A positive correlation between measured DSS and weight, WHR, WC and BMI were observed. There were no statistically significant correlations between age, height and DSS. The significant correlation was observed between predicted DSS from formulae based on BMI and WHR but not with formulae based on height and weight. The formulae that have derived from this study to predict DSS is presented in [Table/Fig-8].
Formulae for predicting DSS derived from this study.
| Variables | Formula |
|---|
| Weight (kg) | DSS (cm)=1.04+0.06×weight |
| BMI (kg/m2) | DSS (cm)=0.8+0.16×BMI |
| WHR | DSS (cm)=0.6+10.64×WHR) |
| WC (cm) | DSS (cm)=3.16+0.02×WC |
BMI: Body mass index; WC: Waist circumference; DSS: distance from skin to subarachnoid space; WHR: Weight height ratio; BMI: Body mass index
The actual DSS measured in these patients is comparatively shorter than that observed in the Western or Middle East population. Basgul A et al., reported measured mean DSS of 5.40±0.66 cm and Taman HI et al., reported 4.99±0.48 cm but in this study mean DSS was 4.60±0.602 cm in the overall population [10,11]. Hazarika R et al., and Prakash S et al., observed a mean DSS of 4.37±0.31 cm and 4.71±0.31 cm, respectively in the Indian population, which are comparable to this study findings [1,4]. None of the predicted DSS based on different published formulae was found to be accurate in these patients. Predicted DSS based on BMI was the closest one, 4.72 cm more than the actual measured value of this study.
In this study, inverse and insignificant correlation between age and height and DSS was observed. Considering that most of the patients were above 18 years, a significant change in the DSS is not expected in this age group. Vassiliadis M et al., found a positive correlation of DSS with age but not with weight, height and BMI in male patients [12]. During lumbar puncture, the subcutaneous tissue is the most variable layer that is related to weight [13]. Basgul A et al., found weight as the only significant predictor of DSS in patients undergoing urological surgeries [10]. Arzola C et al., reported a significant correlation between weight and BMI with DSS in pregnant women [14]. A strong correlation between BMI and weight with DSS was found in this study too. During pregnancy, the increased weight and exaggerated lumbar lordosis could affect the accuracy of study results. Besides, weight gain in pregnancy is not constant or equal in all women. To avoid this bias in the interpretation of results, pregnant patients were excluded from this study.
The correlation between the WC and DSS was very weak in this study as r value is 0.193 and this finding is significant (p-value <0.001). However, according to the regression model, only 4% of the depth of needle insertion variables were predictable using this model. Razavizadeh MR et al., reported a correlation between the WC and DSS only in 43% predictability [8]. Abe KK et al., reported a significant correlation between DSS and WHR in patients aged 25 days to 80 years who had undergone computed tomography scan for a variety of reasons [15]. However, this correlation may not be reliable because of diversity in the age group. In this study, a strong correlation between DSS and WHR with 97% predictability was found.
Pre-determined DSS can help the anaesthesiologist choose spinal needle of appropriate size. A longer needle is helpful in obese patients. In a normal individual, a long needle could be difficult to control while injecting the drug, and it could also increase the risk of traumatic tap or nerve injury. On the contrary, shorter needles are good for paediatric patients but may not reach the subarachnoid space in adult. Thus, increasing the chances of multiple punctures, failure and patient discomfort. An accurate estimation of DSS is possible with ultrasound. Tyagi V et al., observed that mean DSS measurement by using needle insertion and ultrasound were comparable [16]. Ultrasound-guided DSS measurements may help to reduce the number of attempts, failure and complication rates. However, not everyone has access to ultrasound, especially in developing countries. Moreover, everyone may not be skilled to perform neuraxial ultrasound.
Limitation(s)
The selected study population doesn’t represent the whole country as the study was limited to one particular region so a multicentric trial is needed to have a wider representation of the population. The angle of the spinal needle insertion was not measured. Reliance was placed on visual impression regarding needle being perpendicular to the skin. The formulae to predict the DSS are applicable only for the midline approach and not for the paramedian approach of spinal anaesthesia. They are also not useful in patients with any deformities of the spine.
Conclusion(s)
The proposed formulae can be used to predict the DSS. It would help us in the selection of appropriately sized spinal needle which in turn would reduce the number of attempts and incidence of failure and complications in patients. The decreasing order of strength of correlation between the anthropometric indices and DSS according to this study is BMI>WHR>Weight>WC>Height. Based on this study findings, it can be concluded that the depth of the spinal needle to be inserted for spinal anaesthesia correlates best with BMI and WHR.
M: Male; F: Female; ASA: American society of anaesthesiologists; WHR: Weight height ratio; BMI: Body mass index; WC: Waist circumference; DSS: Distance from skin to subarachnoid space; n: Number of patients
WHR: weight height ratio; BMI: Body mass index; WC: Waist circumference; DSS: Distance from skin to subarachnoid space; Pearson Correlation test. p-value <0.05 to be considered significant
WHR: Weight height ratio; BMI: Body mass index; DSS: Distance from skin to subarachnoid space
BMI: Body mass index; WC: Waist circumference; DSS: distance from skin to subarachnoid space; WHR: Weight height ratio; BMI: Body mass index