Introduction
Enhanced formation and accumulation of Fluorescent Advanced Glycation End products (F-AGEs) in diabetes mellitus have been linked to increased risk of developing the associated vascular complications.
Aim
To evaluate the potential of serum fluorescence levels of F-AGEs as screening tools to distinguish between type 2 diabetic patients with and without microvascular complications such as retinopathy, neuropathy.
Materials and Methods
This cross-sectional study was conducted between June 2016 and June 2017, included 95 type 2 diabetic patients with more than 1 year of diabetes duration. Fasting blood glucose, glycated haemoglobin and total protein levels were estimated by automated methods. Serum F-AGEs were estimated by using a simple spectrofluorometric method. Microvascular complications due to diabetes mellitus were studied in each patient from medical records data on fundus examination for retinopathy and touch, vibration sensation detection for neuropathy. Diabetic patients were categorised into two groups as those without microvascular complications and those with microvascular complications-retinopathy and neuropathy. Statistical tests used for comparisons between groups were chi-square test for gender distribution, independent t-test for other parameters and Pearson’s correlations. The p-value <0.05 indicated significant difference between variables.
Results
Mean age of the population was 55.1±5.3 years. Diabetic patients with microvascular complications (n=26) in the form of retinopathy, neuropathy had significantly higher levels of serum F-AGEs with mean 7.4±1.8 AU/g protein compared with diabetic patients without complications with mean value 1.5±0.7 AU/g protein (p<0.01).
Conclusion
Two categories of serum fluorescent AGE values, without overlap, could be distinguished between diabetic patients with and without complications. Measurement of serum F-AGEs products has the potential to emerge as a simple, valuable screening tool to distinguish between diabetic patients with and without microvascular complications.
Introduction
Diabetes mellitus is a metabolic disease characterised by elevated blood glucose levels or hyperglycaemia resulting from defects in insulin secretion, insulin action or both. Chronic hyperglycaemia is associated with microvascular complications due to damage to small blood vessels and macrovascular due to damage to larger blood vessels. Microvascular complications include damage to retina of eyes (retinopathy), kidneys (nephropathy) and nerves (neuropathy). Macrovascular complications include cardiovascular diseases, peripheral vascular and cerebrovascular diseases. These conditions can lead to end organ damage such as visual impairment, kidney disease, nerve damage, diabetic foot, heart disease, and stroke [1]. Diabetic macroangiopathy, atherosclerosis secondary to diabetes mellitus, cause cerebro-cardiovascular diseases which are major causes of death in diabetic patients. Studies have revealed that major underlying biochemical reactions are overproduction of reactive oxygen species, increased formation of AGEs and activation of the AGEs receptors [2,3].
AGEs are produced through the non-enzymatic glycation reactions and also by oxidation of proteins, lipids and nucleic acids. Hyperglycaemic condition in diabetes mellitus leads to their enhanced formation. Enhanced formation and accumulation of AGEs have been linked to increased risk for both macro- and micro-vascular complications associated with diabetes mellitus [4,5].
Advanced glycation is the non-enzymatic process whereby the carbonyl (aldehyde or ketone) of reducing sugars like glucose react nonenzymatically with lysine and N-terminal amino groups in different proteins, lipoproteins, and nucleic acids, that leads to the formation of early glycation products via the Maillard reaction. These go through further rearrangements leading to the formation of various reactive intermediate products including- dicarbonyls or oxoaldehydes- dicarbonyls react with amino groups of intracellular and extracellular proteins to form AGEs, a heterogeneous class of stable and irreversible covalent adducts. Pentosidine, argpyrimidine, many other AGEs have intrinsic florescence and hence tissue and plasma fluorescence may be used as markers to estimate AGE accumulation. Other AGEs such as Carboxymethyllysine (CML) and pyralline do not have properties of fluorescence [6].
AGEs are believed to modulate cellular processes by binding to specific cell surface receptors present on the surface of all cells relevant to processes of atherosclerosis triggering oxidative stress, inflammation and apoptosis [7,8].
In addition to endogenous AGEs, exogenous AGEs are produced by reactions between sugars and proteins in ingested foods which may be absorbed into the circulation. AGE content is high in cooked and processed foods, especially those rich in proteins, fat, and sugar. It is considered that dietary AGEs are similar to endogenous AGEs with regard to their pro-oxidant, pro-inflammatory, and signalling properties [9].
Elevated serum level of AGEs, RAGE and pentosidine have been reported in Tunisian patients with diabetic retinopathy [10]. The underlying mechanisms involving AGEs in the pathogenesis of diabetic vascular, microvascular complications have been elucidated [11]. Positive association of serum F-AGEs with diabetic vascular, microvascular complications have been reported [4,12]. However, the previous reports on AGE estimations differ from the present study in the type of AGE estimated [10], ethnicity of the patients studied [4,10,12], type of complication involved [10], assay method employed [10] and in the treatment of specimen prior to spectrofluorometric assay [12]. In one previous study, the same method and specimen treatment were used for F-AGE estimation as in the present study. However, in that report, the F-AGE values of diabetic patients with and without microvascular complications showed some overlapping and therefore, clear cut-off values were not established [4].
The present study was conducted to evaluate the potential of serum fluorescence levels of F-AGEs as screening tool to distinguish between type 2 diabetic patients with and without microvascular complications such as retinopathy and neuropathy.
Materials and Methods
The study design was cross-sectional. Ambulatory type 2 diabetic patients of both genders attending the Department of Medicine, Yenepoya Medical College Hospital, Mangalore, Karnataka, India between June 2016 and June 2017, were screened for the study. Written informed consent was taken from each patient. Ethical clearance was obtained from the Institutional Ethical Committee (YUEC 229/16/11/2015). Both admitted and outpatients were considered and 95 patients were selected.
Sample Size Calculation
Sample size=95, was calculated with the below formula:

Where p0=Population correlation coefficient=0.73, p1=Sample correlation coefficient=0.84, Z1-a/2=Desired confidence level, 1-ß=Power=80%.
Inclusion criteria: The patients in the age range of 39-60 years, with diabetes duration of more than 1 year and on treatment with oral hypoglycaemic drugs or on insulin, were included.
Exclusion criteria: Patients with renal failure, uncompensated heart, pulmonary diseases, cancer and alcoholism [4].
Details of relevant clinical examinations performed to detect microvascular complications were collected from medical records including data on fundus examination for retinopathy and touch, vibration sensation detection for neuropathy. Based on the findings, the diabetic patients were categorised into two groups as those without microvascular complications and those with microvascular complications (retinopathy or neuropathy or both).
Clinical Biochemical Measurements
Fasting blood sample was obtained from each patient with all aseptic precautions. Fasting blood glucose, glycated haemoglobin and total proteins were measured using automated methods. Serum fluorescent AGEs were estimated using spectrofluorometry method.
Estimation of Serum Fluorescent Advanced Glycation End Products (F-AGEs)
Blood samples were centrifuged within two hours of drawing blood at 3000 rpm for 10-15 minutes. Serum (100 μL) was deproteinised with 5% Tri Carboxylic Acid (TCA) (300 μL). Then, 200 μL of chloroform was added, vortexed for 60 seconds and centrifuged at 14,000 rpm. Respective supernatants were collected in separate tubes and placed in cuvette. Fluorescence intensity was read at 440 nm after excitation at 355 nm using Hitachi Spectrofluorometer. Results were expressed as arbitrary units per gram serum protein (AU/g protein) as described previously [4,12].
Fasting blood sugar and total proteins were estimated by automated methods using VITROS 5600 integrated dry chemistry system.
The D-10 Haemoglobin A1C instrumentation utilising ion-exchange High Performance Liquid Chromatography (HPLC) was used for estimation of glycated haemoglobin (HbA1c). Normal reference range for FBS is 70-110 mg/dL and HbA1c is 4.2-6.2% (Assessed in National Accreditation Board for Testing and Calibration Laboratories- accredited laboratory).
Statistical Analysis
The statistical tools that were used in the data analysis of the present study were independent t-test; chi-square test for gender comparison; and Pearson’s correlation for finding various correlations. SPSS version 22 statistical package was used for the analyses. The p-value of <0.05 indicated significant difference (S) between variables.
Results
Total number of 95 type 2 diabetes mellitus patients aged 39 to 60 years were selected. The mean age of patients was 55.1±5.3 years. Gender distribution and gender percentages in the study population are given in [Table/Fig-1]. Mean values of fasting blood glucose and glycated haemoglobin (HbA1c) are given in [Table/Fig-2].
Gender distribution in the study population.
| Gender | N % | p-value |
|---|
| Female | 4749.5% | 0.36 |
| Male | 4850.5% |
p-value<0.05 to be considered significant; chi-square analysis was performed
Fasting blood glucose and glycated haemoglobin values of diabetic patients.
| Parameter | Normal reference range | Mean±SD | Range |
|---|
| Fasting blood glucose (mg/dL) | 70-110 mg/dL | 140.5±34.2 | 104.0-310.0 |
| Glycated haemoglobin HbA1c (%) | 4.2-6.2% | 7.9±1.3 | 6.4-12.5 |
The diabetic patients were categorised into two groups as those with and without microvascular complications in the form of retinopathy and neuropathy. Twenty-six patients of the total 95 diabetic patients were found to have microvascular complications in the form of retinopathy and neuropathy. Demographic and biochemical characteristics of the two groups of diabetic patients with and without microvascular complications, are given in [Table/Fig-3].
Demographic, biochemical characteristics of diabetic patients with and without microvascular complications.
| Parameter | DM patients without microvascular complications (n=69) | DM patients with microvascular complications (n=26) | p-value |
|---|
| Gender | Female=37Male=32 | Female=10Male=16 | 0.187 |
| Age (years) Mean±SD | 54.0±5.6 | 58.1±2.8 | *<0.01 |
| Fasting blood glucose (mg/dL) Mean±SD | 135.2±34.8 | 154.7±28.4 | *<0.05 |
| Glycated hemoglobin (HbA1c) (%) Mean±SD | 7.4±0.9 | 9.1±1.4 | *<0.01 |
| Serum fluorescence of AGEs (AU/g protein) | 1.5±0.7 (Mean±SD)0.4-4.0 (Range) | 7.4±1.8 (Mean±SD)4.3-13.2 (Range) | *<0.01 |
*p-value of <0.05 indicates significant difference between the groups
AGE: Advanced glycation end products
The mean age varied significantly between diabetic patients with and without microvascular complications. Significant variations in fasting blood glucose and HbA1c values were also obtained between the two groups of diabetic patients. HbA1c variation was more significant than the variation in fasting blood glucose [Table/Fig-3].
Correlations of AGEs with HbA1c and fasting blood glucose levels in diabetic patients with microvascular complications were examined and results are shown in [Table/Fig-4,5], respectively.
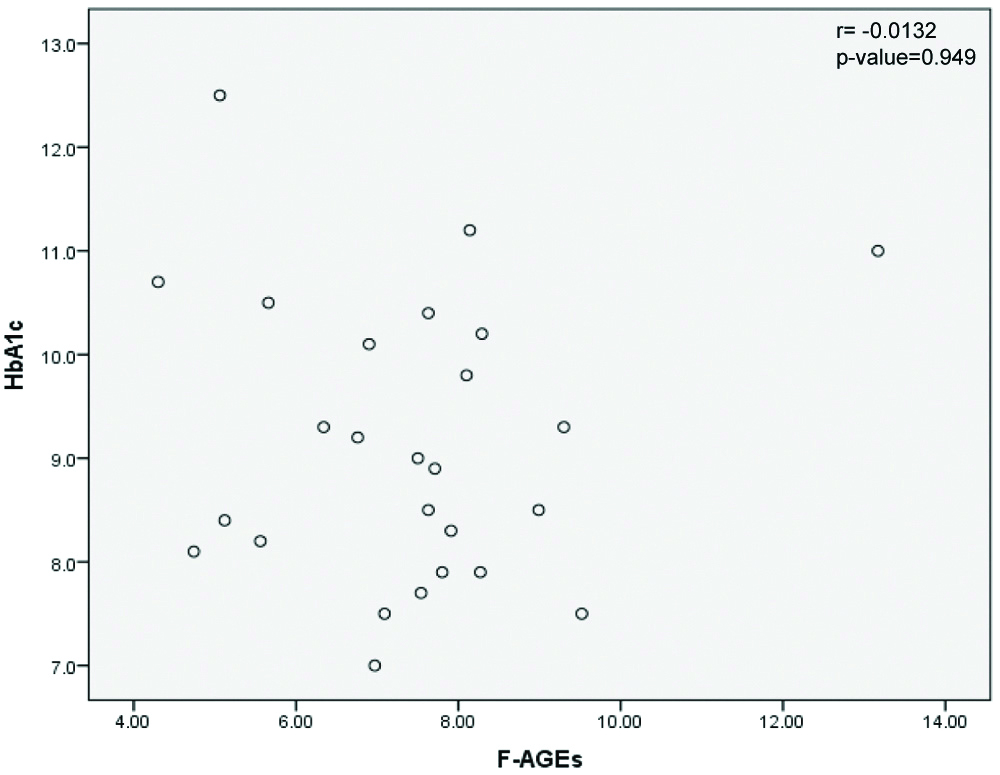
Correlation of FAGEs and HbA1c in diabetic patients with microvascular complications. (F-AGE levels in Arbitrary unit/g serum protein and HbA1c in %).
r is the Pearson’s Correlation; HbA1c: Glycated haemoglobin; F-AGEs: Fluorescent advanced glycation end products
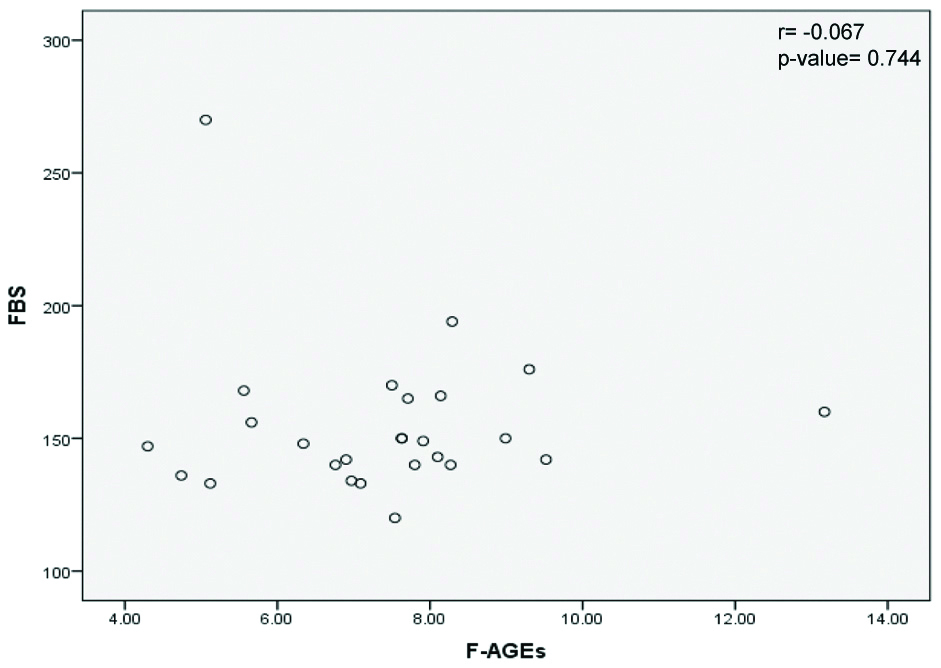
Correlation of F-AGEs and fasting blood glucose in diabetic patients with microvascular complications. (F-AGE levels in Arbitrary unit/g serum protein and FBS in mg/dL).
FBS: Fasting blood glucose; F-AGEs: Fluorescent advanced glycation end products
r=Pearson’s Correlation
Pearson’s correlation between the variables F-AGEs and HbA1c was weak, with r value of -0.0132 and p-value of 0.949 [Table/Fig-4].
Pearson’s correlation between the variables F-AGEs and FBS was weak, with r value of -0.067 and p-value of 0.744 which is not significant [Table/Fig-5].
Discussion
Serum AGEs have been implicated in diabetic complications. In the present study also, it was observed that serum F-AGE was higher in patients who had microvascular complications in the form of retinopathy and neuropathy. It was possible to categorise serum F-AGEs levels in these patients into two ranges. In the present study, a lower F-AGEs range of 0.4 to 4.0 AU/g was found in those diabetic patients who did not have any microvascular complications and a higher range of F-AGEs levels between 4.3 and 13.2 AU/g protein, was present in diabetic patients with microvascular complications. The differences in serum F-AGEs levels between the two ranges were highly significant. There was no overlap in the F-AGE values of the patients with and without complications.
It is interesting that the F-AGE values obtained in this study are very similar to those reported by Maza MP et al., which used the same method for estimation of F-AGEs as in the present study [4]. However, in their report there was overlap between the F-AGE values of diabetic patients with and without complications. There are no other previous reports in literature in which clear cut F-AGE ranges were obtained between diabetic patients with and without microvascular complications using the simple spectrofluorometric method as in the present study.
Previous studies by Coughlan MT et al., Tan ALY et al., Nowotny K et al., and Singh VP et al., have explained the underlying mechanisms involving AGEs in different types of diabetic microvascular complications [5-8]. Coughlan MT et al., reported positive association between urine AGEs levels and diabetic nephropathy [5] unlike the present study which measured serum AGE levels. Kerkeni M et al., reported significantly elevated serum AGEs levels in Tunisian patients with diabetic retinopathy using ELISA method [10] unlike the present study involving South Indian patients which used spectrofluorometric method.
Glyceraldehyde-derived AGEs (Glycer-AGEs), the predominant components of Toxic AGEs (TAGE) have been demonstrated to play important role in the pathogenesis of angiopathy in diabetic patients [11]. Interaction of TAGE with the Receptor for AGEs (RAGE) is reported to alter intracellular signalling, gene expression, release of pro-inflammatory molecules eliciting oxidative stress generation in different cell types, contributing to pathological changes observed in diabetic vascular complications [11,13]. Diabetic vascular complications are leading causes of end-stage renal failure, acquired blindness, a variety of neuropathies, cardiovascular disease and may be involved in the morbidity and high mortality rates suffered by diabetic patients. The underlying mechanisms involve AGE, RAGE and ROS in diabetic nephropathy [6]. TAGE formation inhibition, TAGE-RAGE interaction blockade and RAGE expression suppression are promising therapeutic targets against diabetic vascular complications [11].
F-AGEs and their soluble receptor, sRAGE have been proposed as new plasma biomarkers for risk stratification of acute coronary syndrome and F-AGEs were significantly associated with long-term prognosis [14].
In both the present study and the study of Maza MP et al., glycated haemoglobin and fasting blood glucose levels were significantly higher in diabetic patients with microvascular complications. However, in the present study as well as the study of Maza MP et al., serum F-AGE and glycated haemoglobin levels in patients with microvascular complications did not correlate [4]. That could be because in addition to endogenous AGEs, exogenous AGEs produced by reactions between sugars and proteins in ingested foods are absorbed into circulation. AGE content is high in cooked and processed foods, especially those rich in proteins, fat, and sugar. Dietary AGEs are considered to be similar to endogenous AGEs with regard to their pro-oxidant, pro-inflammatory, and signalling properties [9,15].
Since most AGEs have a characteristic fluorescence, detection through spectrofluorometric estimation in serum is a widely available assay method, although less specific. Other methods such as ELISA, HPLC have been employed for estimation of AGEs in other reported studies by Ashraf JM et al., and Munch G et al., [16,17]. Immunochemical assays have been used for detection of both F-AGEs like pentosidine, argpyrimidine and non-fluorescent AGEs like CML [15]. The study of Maza MP et al., which also measured non-fluorescent AGEs such as CML using ELISA, reported significant association between CML concentrations and diabetic retinopathy too [4]. A standardised approach to quantify all varieties of AGEs simultaneously remains unestablished because of the vast heterogeneity of the AGEs.
The spectrofluorometric estimation method used in the present study, is relatively simple to perform, less laborious and suitable for easy screening purpose in primary care setting, compared to other methods. It can distinguish between diabetic patient with and without microvascular complications as demonstrated in the present, as well as in other reported studies. Furthermore, use of the portable spectrofluorometer, may facilitate point-of-care testing of diabetic patients for serum F-AGEs.
Limitation(s)
Significant variation was present between the mean age of diabetic patients with and without microvascular complications, which may be a confounding factor. The mean diabetes duration of patients was not calculated in the present study.
Conclusion(s)
Measurement of serum fluorescence of AGEs using the simple spectrofluorometric method has the potential to become a useful, reliable, screening test to detect diabetic patients with hyperglycaemia induced microvascular complications. Risk stratification for vascular complications and monitoring response to therapy are the other potential outcomes of measuring serum fluorescent AGEs in diabetic patients.
p-value<0.05 to be considered significant; chi-square analysis was performed
*p-value of <0.05 indicates significant difference between the groups
AGE: Advanced glycation end products
[1]. Ozougwu JC, Obimba KC, Belonwu CD, Unakalamba CB, The pathogenesis and pathophysiology of type 1 and type 2 diabetes mellitusJ Physiol Pathophysiol 2013 4(4):46-57.10.5897/JPAP2013.0001 [Google Scholar] [CrossRef]
[2]. Katakami N, Mechanism of development of atherosclerosis and cardiovascular disease in diabetes mellitusJ Atheroscler Thromb 2018 25(1):27-39.10.5551/jat.RV1701428966336 [Google Scholar] [CrossRef] [PubMed]
[3]. Hegab Z, Gibbons S, Neyses L, Mamas AM, Role of advanced glycation end products in cardiovascular diseaseWorld J Cardiol 2012 4(4):90-102.10.4330/wjc.v4.i4.9022558488 [Google Scholar] [CrossRef] [PubMed]
[4]. Maza MP, Garrido F, Escalante N, Leiva L, Barrera G, Schnitzler S, Fluorescent advanced glycation end-products (ages) detected by spectro-photofluorimetry, as a screening tool to detect diabetic micro vascular complicationsJ Diabetes Mellitus 2012 2(2):221-26.10.4236/jdm.2012.22035 [Google Scholar] [CrossRef]
[5]. Coughlan MT, Patel SK, Jerums G, Penfold SA, Nguyen TV, Sourris KC, Advanced glycation urinary protein-bound biomarkers and severity of diabetic nephropathy in manAm J Nephrol 2011 34(4):347-55.10.1159/00033106421876347 [Google Scholar] [CrossRef] [PubMed]
[6]. Tan ALY, Forbes JM, Cooper ME, AGE, RAGE and ROS in diabetic nephropathySemin Nephrol 2007 27(2):130-43.10.1016/j.semnephrol.2007.01.00617418682 [Google Scholar] [CrossRef] [PubMed]
[7]. Nowotny K, Jung T, Hohn A, Weber D, Grune T, Advanced glycation end products and oxidative stress in type 2 diabetes mellitusBiomolecules 2015 5(1):194-222.10.3390/biom501019425786107 [Google Scholar] [CrossRef] [PubMed]
[8]. Singh VP, Bali A, Singh N, Jaggi AS, Advanced glycation end products and diabetic complicationsKorean J Physiol Pharmacol 2014 18(1):01-14.10.4196/kjpp.2014.18.1.124634591 [Google Scholar] [CrossRef] [PubMed]
[9]. Uribarri J, Cai W, Peppa M, Goodman S, Ferrucci L, Striker G, Circulating glycotoxins and dietary advanced glycation end products: Two links to inflammatory response, oxidative stress, and agingJ Gerontol A Biol Sci Med Sci 2007 62(4):427-33.10.1093/gerona/62.4.42717452738 [Google Scholar] [CrossRef] [PubMed]
[10]. Kerkeni M, Saidi A, Bouzidi H, Yahya SB, Hammami M, Elevated serum level of AGEs, RAGE and pentosidine in Tunisian patients with severity of diabetic retinopathyMicrovasc Res 2012 84(3):378-83.10.1016/j.mvr.2012.07.00622835520 [Google Scholar] [CrossRef] [PubMed]
[11]. Takeuchi M, Takino J, Yamagishi S, Involvement of the toxic AGEs (TAGE)-RAGE system in the pathogenesis of diabetic vascular complications: A novel therapeutic strategyCurr Drug Targets 2010 11(11):1468-82.10.2174/138945011100901146820583971 [Google Scholar] [CrossRef] [PubMed]
[12]. Guerin-Dubourg A, Cournot M, Planesse C, Debussche X, Meilhac O, Rondeau P, Association between fluorescent advanced glycation end-products and vascular complications in type 2 diabetic patientsBiomed Res Int 2017 2017:798918010.1155/2017/798918029362717 [Google Scholar] [CrossRef] [PubMed]
[13]. Folli F, Corradi D, Fanti P, Davalli A, Paez A, Giaccari A, The role of oxidative stress in the pathogenesis of type 2 diabetes mellitus micro- and macro vascular complications: Avenues for a mechanistic-based therapeutic approachCurr Diabetes Rev 2011 7(5):313-24.10.2174/15733991179741558521838680 [Google Scholar] [CrossRef] [PubMed]
[14]. Raposeiras-Roubín S, Rodiño-Janeiro BK, Paradela-Dobarro B, Grigorian-Shamagian L, García-Acuña JM, Aguiar-Souto P, Fluorescent advanced glycation end products and their soluble receptor: The birth of new plasmatic biomarkers for risk stratification of acute coronary syndromePLoS One 2013 8(9)10.1371/journal.pone.007430224058542 [Google Scholar] [CrossRef] [PubMed]
[15]. Aragno M, Mastrocola R, Dietary sugars and endogenous formation of advanced glycation end products: Emerging mechanisms of diseaseNutrients 2017 9(4):38510.3390/nu904038528420091 [Google Scholar] [CrossRef] [PubMed]
[16]. Ashraf JM, Ahmad S, Choi I, Ahmad N, Farhan M, Tatyana G, Recent advances in detection of AGEs: Immunochemical, bioanalytical and biochemical approachesIUBMB Life 2015 67(12):897-913.10.1002/iub.145026597014 [Google Scholar] [CrossRef] [PubMed]
[17]. Munch G, Keis R, Wessels A, Riederer P, Bahner U, Heidland A, Determination of advanced glycation end products in serum by fluorescence spectroscopy and competitive ELISAEur J Clin Chem Clin Biochem 1997 35(9):669-77.10.1515/cclm.1997.35.9.6699352229 [Google Scholar] [CrossRef] [PubMed]