Physical inactivity is a modifiable risk factor for a wide variety of non-communicable diseases like Diabetes Mellitus (DM), cancer (colon and breast), obesity, hypertension, depression, etc., [1]. It is projected that by the year 2020, these diseases will contribute to 73% of deaths and 60% of the global disease burden [2]. Physical activity involves a pivotal role in the prevention of these non-communicable diseases [2]. According to World Health Organisation (WHO) recommendation, adults aged 18-64 years should perform at least 150 minutes of moderate-intensity aerobic physical activity or at least 75 minutes of vigorous-intensity aerobic physical activity throughout the week or an equivalent combination of moderate- and vigorous-intensity activity [3]. But as a matter of concern, the global picture reflects that 1 in 4 adults are not sufficiently active [4]. There is expanding predisposition towards a sedentary lifestyle, especially among young individuals attending the college [5]. Inspite of the fact that the medical students have a greater awareness about a healthy lifestyle; their academic stress to perform well may poorly affect their pattern of physical activity and thus, compromise their overall health [5]. It is assumed that the students who are themselves not following a healthy lifestyle will eventually fail to promote the same for their patients [5].
Hence, the aim of the current study was to assess the level of physical activity by evaluating the MET score so as to measure the intensity of physical activities performed by the participants.
Materials and Methods
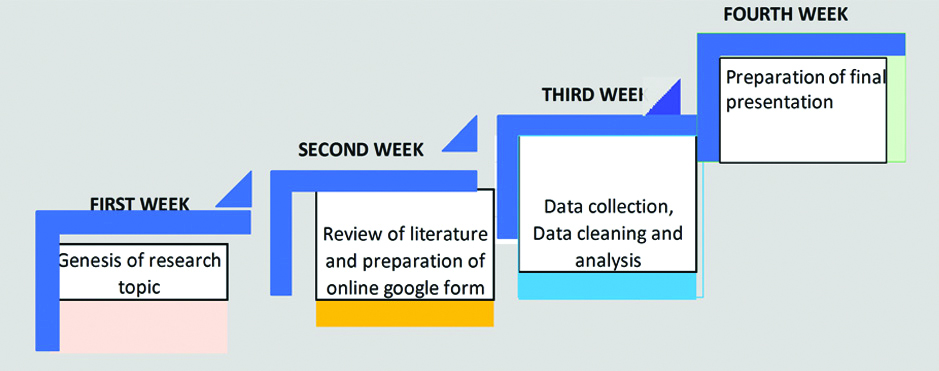
The current study was done under the short research project included in the curriculum of MBBS admission batch of year 2017 at All India Institute of Medical Sciences, Patna, Bihar, India [Table/Fig-1].
Plan of action for the research project.
This was a cross-sectional study conducted among the undergraduate students, studying in different medical colleges across Bihar, India. Students from 11 medical colleges out of total 13 Government and Private Medical Colleges participated in the study. Every year in the state, approximately 1000 students are admitted in the MBBS course. The study was conducted during September 2019 for a period of one month.
Sample Size
In the absence of any prior study in the current study area, prevalence of physical activity among the undergraduate medical students was assumed to be 50%. Further, using single proportion formula; taking 3% absolute precision and 95% confidence, the optimal sample size was calculated [6]. The sample size thus calculated was 1068. However, a higher number of responses i.e., 1200 were collected during the study period. Snowball cum convenience sampling was done for the recruitment of participants.
An Online Google Form was created using a short version of the IPAQ. IPAQ is a prevalidated questionnaire which is available in public domain, open access and hence no permission was required to use it [7]. In addition to it, questions regarding demographic profile, self-reported weight and height, availability of gym in the campus, participants following a regular routine of physical exercise, reason for not doing physical exercise, residence of participants, and mode of transportation used to reach the college were also included.
Data Collection Method
An invite to fill the Google form was sent to the representatives in each college. The Google form link was also advertised on social media platforms like WhatsApp and Facebook. The participants were asked to disseminate the Google form link further to their contacts, after filling the form themselves. Students who were willing to participate in the study and gave consent; which was mentioned in the Google form were included in the study and whereas those who had any physical impairment or disability, preventing them from engaging in physical activities; were excluded from the study. BMI was calculated using the formula, BMI=Weight (Kg)/Height (m2) and accordingly, participants were classified into underweight, normal weight, overweight/obesity using the WHO cut-off points; <18.50, 18.50-24.99 and >25 kg/m2, respectively [8]. The short version of IPAQ provides the estimate of time spent on 3 domains of physical activity (leisure, domestic and transport) [9], done in the last seven days; which is used to calculate the MET score as mention below [10]:
MET for Walking=3.3 × walking minutes × days
MET for Moderate intensity activities=4.0 × moderate activity minutes × days
MET for Vigorous intensity activities=8.0 × vigorous activity minutes × days
Total MET Score=Walking MET+ Moderate Activity MET+ Vigorous Activity MET.
After evaluating total MET score, the participants were divided into three categories as follows [10]:
Category 1 (Low): <600 MET-minutes/week
Category 2 (Moderate): 600 to <3000 MET-minutes/week
Category 3 (High): ≥3000 MET-minutes/week
Statistical Analysis
The collected data was coded in Excel and analysed using Stata (Version 13) software. Results were presented as frequencies, mean and standard deviation. Chi-square test was applied to test for significant association at 0.05 level of significance. The odds ratio with a 95% confidence interval was calculated to quantify the association. To identify the predictors of physical activity, multiple logistic regression analysis of the data was done. For applying logistic regression, the outcome variable was grouped into two categories i.e., Low level of physical activity=Insufficient physical activity status, moderate and high level of physical activity=sufficient physical activity status.
Results
A total of 1200 students participated in the study. Among these, 64.3% were males and 35.7% were females. The mean age was 21±2.2 (16-30) years. More than half of the participants (57.6%) were aged <21 years. The majority of participants (67.7%) had normal weight followed by overweight/obese (22.8%). The normal BMI was equally prevalent among both male and female students; 67.4% and 68.2%, respectively. Whereas underweight was more prevalent among females (13.8%) compared to males (7.1%). On the other hand, the proportion of overweight/obese was more in males (25.5%) as compared to females (18%) and this BMI pattern among both the sexes was statistically significant (p-value <0.001) [Table/Fig-2].
Distribution of age and BMI according to gender of the participants.
| Characteristics | Total sample N (%) | Gender N (%) | p-value (Chi-square) |
|---|
| Male | Female |
|---|
| Total | 1200 (100.0) | 772 (64.3) | 428 (35.7) |
|---|
| Age group (years) |
| <21 | 691 (57.6) | 415 (53.8) | 276 (64.5) | <0.001** |
| >21 | 509 (42.4) | 357 (46.2) | 152 (35.5) |
| BMI (kg/m2) |
| Underweight | 114 (9.5) | 55 (7.1) | 59 (13.8) | <0.001** |
| Normal weight | 812 (67.7) | 520 (67.4) | 292 (68.2) |
| Overweight/Obese | 274 (22.8) | 197 (25.5) | 77 (18) |
**p-value is highly significant
Approximately, half of the participants (54.4%) reported availability of gym in their campus and only 26.7% of participants were following regular routine of physical exercise [Table/Fig-3].
Distribution of participants according to general characteristics.
| Characteristics | Total sample N (%) |
|---|
| Total | 1200 (100) |
|---|
| Availability of gym/sports facility |
| Yes | 653 (54.4) |
| No | 547 (45.6) |
| Following a regular routine of physical exercise |
| Yes | 320 (26.7) |
| No | 880 (73.3) |
According to [Table/Fig-4], majority of the participants among both males (33.5%) and females (37.4%) stated lack of time followed by feeling lazy (28.1%, 31.3%), academic stress (22.9%, 20.5%) and only (15.5%, 10.8%), for males and females respectively, did not feel any need to exercise.
Reasons for not doing exercise according to gender (N=880).
| Reasons for not doing exercise | Male | Female | p-value (pearson’s chi) |
|---|
| Academic stress | 125 (22.9%) | 68 (20.5%) | 0.141 (5.46) |
| Do not feel the need to do exercise | 85 (15.5%) | 36 (10.8%) |
| Feel lazy | 154 (28.1%) | 104 (31.3%) |
| Lack of time | 184 (33.5%) | 124 (37.4%) |
| Total | 548 (100%) | 332 (100%) |
The cross-tabulation of residence of participants by mode of transportation shows that maximum students under the study were residing in hostel (89.4%); who were reaching college mainly by walking (74.8%), {OR=17.5 (12.9-23.5)}. Whereas, majority of day scholar students were reaching college by using vehicle (63%) {3.3 (2.6-4.3)} p<0.001 [Table/Fig-5].
Residence of participants according to mode of transportation used to reach college (N=1200).
| Mode of transportation | Residence | OR (95% CI) | p-value (chi square) |
|---|
| Hosteler n (%) | Day scholar n (%) |
|---|
| Walking | 803 (74.8) | 46 (36.2) | 17.5 (12.9-23.5) | <0.001** |
| Automobile vehicle* | 267 (24.9) | 80 (63) | 3.3 (2.6-4.3) |
| Cycle | 3 (0.3) | 1 (0.8) | 3 (0.3-28.8) |
| Total | 1073 (89.4) | 127 (10.6) | |
*Automobile vehicles include motor bikes, scooter, car etc.,; **p-value is highly significant
[Table/Fig-6] presents the mean values of minutes per day and days per week spent on physical activity and the mean value of the calculated total MET Score.
Distribution of participants according to physical activity levels (N=1200).
| Physical activity | Minutes spent on physical activity per day Mean (SD) | Mean number of days/week |
|---|
| Vigorous | 52.4 (137.5) | 0.98 |
| Moderate | 103.4 (153.4) | 2.8 |
| Walking | 400.9 (233.5) | 5 |
| Total MET | 1680.5 (1653.1) | |
| Level of physical activity | N (%) | Mean MET score (SD) |
| Low | 378 (32) | 265.9 (187.5) |
| Moderate | 630 (52) | 1603.5 (668.6) |
| High | 192 (16) | 4686.5 (1590.1) |
Furthermore, on the basis of total MET score; approximately half of the participants (52%) were doing moderate physical activity followed by low physical activity (32%) and only 16% were doing high physical activity. Accordingly, the majority of participants i.e. 68% were doing sufficient physical activity whereas only 32% of the participants had insufficient physical activity status.
[Table/Fig-7] predicts an increased level of physical activity is significantly associated with a lower risk of overweight/obesity (p<0.001).
Distribution of level of physical activity of participants according to BMI.
| Level of physical activity | Under/Normal weight | Overweight/Obese | ODDS (95% CI) | p-value (chi-square) |
|---|
| Low | 255 (27.5%) | 123 (44.8%) | 0.48 (0.38-0.59) | <0.001** |
| Moderate | 508 (54.9%) | 122 (44.6%) | 0.24 (0.19-0.29) |
| High | 163 (17.6%) | 29 (10.6%) | 0.17 (0.11-0.26) |
**p-value is highly significant
On univariate analysis, participants having normal BMI, age <21 years, having availability of gym in the campus and following a regular routine of physical exercise were significantly associated with sufficient physical activity status [Table/Fig-8].
Univariate and Multivariate logistic regression analysis for sufficient physical activity among medical undergraduate students.
| Characteristics | Coefficient | Crude OR | Adjusted ORa |
|---|
| BMI | | OR (95% CI) | AOR (95% CI) |
| Underweight | 0.6938293 | 2.35 (1.58-3.51)*** | 2.0 (1.22-3.28) |
| Normal weight | 0.7245865 | 2.67 (2.29-3.12)*** | 2.06 (1.53-2.79)*** |
| Overweight/Obese | _ | 1.22 (0.97-1.56)*** | 1.00 |
| Age |
| <21 years | 0.2932535 | 2.49 (2.11-2.93)* | 1.34 (1.03-1.74)** |
| >21 years | _ | 1.83 (1.52-2.19)* | 1.00 |
| Gym/Outdoor sports facility in the campus |
| Yes | 0.4435916 | 2.67 (2.25-3.17)*** | 1.56 (1.2-2.02)* |
| No | _ | 1.73 (1.46-2.06)*** | 1.00 |
| Gender |
| Male | _ | 2.11 (1.82-2.46) | 1.00 |
| Female | 0.1041867 | 2.29 (1.87-2.82) | 1.1 (0.84-1.46) |
| Following a regular routine of physical exercise |
| Yes | _ | 9.32 (6.44- 13.5)*** | 6.1 (4.09-9.11)*** |
| No | 1.809365 | 1.54 (1.34- 1.76)*** | 1.00 |
| Constant | -3.196064 | | 0.04 (0.01-0.09)*** |
Adjusted ORa=adjusted for all other variables shown in the table
Statistically significant=*p<0.01; **p<0.05; ***p<0.001
On multivariate analysis, normal weight participants were twice more likely to be physically active than overweight/obese participants {AOR=2.06, 95% CI=1.53-2.79}. The odds of being physically active was 1.3, 1.5 and 6.1 times more in participants aged <21 years or having an availability of gym in the campus or following a regular routine of physical exercise respectively than their counterparts. However, on both univariate and multivariate analyses, no significant difference of physical activity was found among male and female participants.
Discussion
Physical inactivity is the fourth most common risk factor adding to global mortality [11]. It is a well-acknowledged fact that integrating routine of physical exercise in daily life, can provide preventive and therapeutic benefits of health [12]. Thus, this study focused on physical activity pattern among medical undergraduate students of Bihar, India. A positive finding revealed by present study was that approximately 67.7% had normal BMI. This was in consonance with the finding reported by Rao CR et al., from Manipal (70%) [12]. However the proportion of overweight/obese participants in present study was 22.8%, similar to Rao CR et al., (24%) and in contrast to Vibhute NA et al., from western Maharashtra who found the prevalence of overweight/obese as low as 8% [12,13]. Regarding regular routine of physical exercise, only 26.7% was found in present study which was almost half when compared to the findings of a study by Salman A and Hamadeh RR (54.3%), at Kingdom of Bahrain [14]. In present study, both male and female participants stated a lack of time and feeling lazy as the most common reasons for not doing regular exercise. Similarly, “no time” and “effect on studies” were the most common hindering factors reported by Kumar HN et al., [5].
Another finding in present study was that majority of participants were having sufficient physical activity status (68%). It may be partially due to the fact that maximum students in present study were hostellers and used to reach college by walking contributing to high walking MET alternative to the finding reported by Thapa K et al., where the use of motorcycle or four wheeler vehicle was more for commuting [15]. Besides this, the high prevalence noted may be due to over reporting of physical activity as present study was based on self-reports. In agreement with present finding, Ashok P et al., from Maharashtra reported 60% of students had sufficient physical fitness level in their study [16]. However, Padmapriya K et al., from Bangalore reported a much higher prevalence of 84.5% among young students [17]. Alternatively, other studies i.e., Hadimani CP et al., and Wattanapisit A et al., reported a low prevalence of physical activity among participants [18,19]. The current study also identified a significant inverse association between physical activity level and the risk of overweight/obese. This was in line with Jekal Y et al., and Hao W et al., who found that the participants with the lowest level of physical fitness were more likely to have high BMI [20,21].
After adjusting for potential confounders, it was observed that BMI, age, availability of gym in the campus and following a regular routine of exercise were independent predictors of physical activity among participants. Studies suggest that physical inactivity and weight gain form an indeterminate vicious cycle where decreased physical activity leads to weight gain, at the same time obese individuals tend to spend less energy in physical activity than the normal-weight individuals [22,23]. Present study also found that the participants belonging to the age group >21 years were less physically active than those belonging to <21 years age group. This was in line with the finding from Rajappan R et al., who noted highest physical inactivity among students aged 22-25 years [24]. Several other studies have documented a decline in physical activity with advancing age [25,26]. The availability of gym facility in the campus was also found to be an important predictor for physical activity. Previous studies have also documented the availability of exercise facility in the campus is associated with high physical activity [27,28].
Limitation(s)
The convenient sampling technique used in the study may limit the generalisation of results to all the medical students. Furthermore, the possibility of response bias inherited in self-reported data cannot be ruled out.
Conclusion(s)
In present study, although majority were sufficiently (68%) physically active; with most participants performing moderate level of physical activity. Still, the low physical activity level was noted among the overweight/obese participants is a matter of concern, which may indicate their ignorance and low priority towards health promoting activities. Furthermore, the comprehensive medical training of students might deteriorate their physical activity level. Thus, these study findings reflect the need to incorporate the physical education electives in the curriculum; with specific underlining and encouragement for overweight students.
**p-value is highly significant
*Automobile vehicles include motor bikes, scooter, car etc.,; **p-value is highly significant
**p-value is highly significant
Adjusted ORa=adjusted for all other variables shown in the table
Statistically significant=*p<0.01; **p<0.05; ***p<0.001