The Type 2 Diabetes Mellitus (T2DM) is very multifaceted metabolic disease, characterised by increased blood glucose level, resistance to insulin, impaired secretion of insulin due to defect in pancreatic beta cell and elevated hepatic glucose secretion. The actual reason of progression of T2DM and its development have not been fully analysed yet. Evidences suggested that several genetic and environmental factors are involved. Although the genetic contribution to T2DM has been recognised, large-scale Genome-Wide Association Studies (GWAS) confirmed 56 established susceptible loci in human [1-3].
Materials and Methods
Study Design and Duration
The current study was a case-control study in which 200 samples, including 100 T2DM patients and 100 control subjects were included. All the subjects were analysed for a period of two years. i.e. December 2017 to July 2019.
The study has been conducted only after the due clearance and approval from the Ethics committee of GKV (vide Proposal No. 14/08/2015/GKV/IEC/2015).
Inclusion and Exclusion criteria: Samples of primary cases of acute nature of T2DM were included and samples of chronic cases of T2DM were excluded in this study. Only T2DM samples was collected and mixed cases samples or type 1 diabetes mellitus samples were excluded. The samples were selected between the age of 18-50 years for both male and female. Samples below 18 years of age and above 50 years of age were excluded from this study.
Patient’s Selection and Blood Sample Collection
Total 200 study subjects were included in present study. Out of 200 study subjects, 100 were T2DM and 100 healthy subjects. Three mL of blood sample were drawn in EDTA vials only after the informed consent being obtained from patients and healthy subjects. In present study formula used for calculating the sample size is given below and adjusted the power accordingly.
N=Z2 P(1-P)/d2
N is the sample size,
Z is the value from the standard normal distribution reflecting the confidence level that will be used (Z=1.96 for 95%CI)
P is expected proportion in population based on previous studies or pilot studies.
Power is 80%
d is precision (corresponding to effect size)
Calculated sample size came out to be 150
All the samples were stored in -80°C for further processing.
DNA Extraction, RNA Extraction and cDNA Synthesis
Three mL of blood samples were processed by RBCs lysis buffer to collect the WBCs and stored in phosphate buffer and few parts were processed for DNA extraction by salting out method. RNA was extracted by Trizol reagent according to the manufacturer’s protocol (AMRESCO, USA) from T2DM cases as well as from healthy control samples stored in phosphate buffer at -80°C. Quality of total RNA was analysed by Nanodrop and cDNA synthesis which was done by using 100 ng total RNA following manufacturer’s protocol (Verso, Thermo Scientific, USA). Briefly, 100 ng of total RNA, 5X cDNA synthesis buffer, dNTPs (5 mM each), RT enhancer, Verso enzyme mix and random hexamers (400 ng/μL) in the total volume of 20 μL incubated for 60 minutes at 42°C, and after synthesis cDNA was stored at -20°C for expression study.
Genotyping of GCK Gene
Extracted DNA was used to study the GCK -30G/A promoter polymorphism using Allele specific PCR method. The primer sequence for wild type forward sequence was, FW: 5’-ACAACCACAGGCCCTCTCAGGAG-3’, forward mutant sequence was FM: 5’-ACAACCACAGGCCCTCTCAGGAA-3’ and common reverse for both was CR: 5’-TTTGAGTAATTAGGCTGCAG-3’. After protocol standardization, the programme was set for amplification at 94°C for 10 minutes, denaturation at 94°C for 40 seconds, annealing at 62°C for 40 seconds, extension at 72°C for 40 seconds for 40 cycle, final extension for 5 minutes at 72°C and hold was 4°C for 10 minutes, respectively. After amplification, agarose gel electrophoresis was done to visualise the 155 bp band of amplified product under UV light.
mRNA Expression of GCK Gene
Quantitative real time PCR was performed by using Sybrgreen mastermix, cDNA was synthesised from 100 ng of total RNA. The primer sequences for GCK mRNA expression were as: forward primer 5’-ACCAAGCGGTATCAGCATGTG-3’; reverse primer 5’-TGGACTTCTCTGTGATTGGCA-3’ and internal control GAPDH forward primer 5’-TGTGGGCATCAATGGATTTGG-3’ and reverse primer 5’-ACACCATGTATTCCGGGTCAAT-3’. The parameters for qRT-PCR assay were as follows: 95°C for 5 minutes, 40 cycles of 95°C for 30 seconds, 60°C for 30 seconds, 72°C for 30 seconds and hold temperature on 4°C. QRT-PCR was performed in triplicate with Applied Biosystems 7500 PCR System (Applied Biosystems, USA).
Statistical Analysis
All the data recorded in excel and Statistical Package for the Social Sciences (SPSS) 19, graph pad prism were used to analyse the data. Chi-square and Fisher’s-exact test were used to compare the genotypes among the groups for qualitative data. Hardy-Weinberg equation was used to calculate the allele frequency among T2DM cases and healthy controls. Mann-Whitney U test and Kruskal-Wallis test were used to compare the group for statistical significance in quantitative data. The p-value <0.05 were taken as statistically significant.
Results
Demographic Characteristic of T2DM Patients and Healthy Controls
Patients in age group ≤50 years were 37 and >50 years were 63, while healthy controls in age group ≤50 years were 35 and >50 years were 65. Among T2DM cases, (74 males, 26 females) while in healthy controls (75 males and 25 females). More details are depicted in [Table/Fig-1].
Demographic characteristics of T2DM patients and healthy controls.
| Variables | T2DM cases n (%) | Healthy controls n (%) |
|---|
| Age (Years) |
| ≤50 years | 37 (37) | 35 (35) |
| >50 years | 63 (63) | 65 (65) |
| Gender |
| Males | 74 (74) | 75 (75) |
| Females | 26 (26) | 25 (25) |
| Smoking status |
| Yes | 69 (69) | 65 (65) |
| No | 31 (31) | 35 (35) |
| Alcoholism |
| Yes | 53 (53) | 55 (55) |
| No | 47 (47) | 45 (45) |
| Hypertension |
| Yes | 27 (27) | 20 (20) |
| No | 73 (73) | 80 (80) |
Biochemical Parameters among T2DM Cases and Healthy Controls
Several parameters such as fasting sugar, serum uric acid, LDL, HDL, TG, Cholesterol, hs-CRP were analysed among T2DM cases and healthy controls and differences among them were found to be significantly associated (p<0.0001, [Table/Fig-2]). All the biochemical parameters were increased whereas HDL was decreased in T2DM cases.
Comparison of biochemical parameters between Type 2 Diabetes Mellitus (T2DM) and healthy controls.
| Variables | T2DM cases (Mean±SD) | Healthy controls (Mean±SD) | p-value |
|---|
| Fasting sugar | 156.4±49.28 | 87.92±9.26 | <0.0001 |
| Serum uric acid | 5.71±2.11 | 4.20±0.74 | <0.0001 |
| LDL | 224.4±73.76 | 87.28±36.83 | <0.0001 |
| HDL | 30.39±6.49 | 39.50±9.06 | <0.0001 |
| TG | 411.3±100.4 | 148.4±59.74 | <0.0001 |
| Cholesterol | 311.3±44.43 | 153.9±46.47 | <0.0001 |
| hs-CRP | 6.55±1.85 | 2.12±1.85 | <0.0001 |
LDL: Low density lipoprotein; HDL: High density lipoprotein; TG-Triglyceride; hs-CRP: high-sensitivity C-reactive protein
Association of Risk Factors among T2DM Cases
All the biochemical parameters among T2DM cases were analysed concerning smoking, alcoholism, and hypertension [Table/Fig-3]. It was observed that patients who were smoking were found to be associated with increased fasting sugar (p=0.001), postprandial sugar (p<0.0001), HbA1c (p=0.003), blood urea (p=0.01), cholesterol (p=0.02) compared to those who were not smokers. T2DM patients who were alcoholic showed increased LDL (p=0.006) and cholesterol (p=0.01) compared to non-alcoholic T2DM patients and differences among them were found to be significantly associated. T2DM cases who were reported hypertensive showed increased hs-CRP (p=0.02) and cholesterol (p=0.02) compared to non-hypertensive T2DM cases and differences among them were found to be significantly associated.
Association of risk factors with biochemical parameters among T2DM cases.
| Variables | Smoking | p-value |
|---|
| Yes | No |
|---|
| Fasting sugar (mg/dL) | 167.5±52.25 | 134.8±23.60 | 0.001 |
| Post prandial sugar (mg/dL) | 235.4±65.7 | 172.3±19.53 | <0.0001 |
| HbA1c (%) | 8.71±1.71 | 7.75±0.78 | 0.003 |
| Blood urea (mg/dL) | 16.62±6.20 | 14.6±4.60 | 0.01 |
| Creatinine (μmol/L) | 1.03±0.41 | 1.16±0.45 | 0.05 |
| Serum uric acid (mg/dL) | 5.82±2.39 | 5.46±1.28 | 0.75 |
| Albumin (g/dL) | 4.52±1.20 | 4.44±1.38 | 0.45 |
| Globulin (g/dL) | 3.13±0.98 | 3.36±0.89 | 0.25 |
| Total protein (g/dL) | 7.64±1.31 | 7.82±1.58 | 0.56 |
| hs-CRP (mg/L) | 6.69±1.79 | 6.22±1.95 | 0.24 |
| LDL (mg/dL) | 229.3±72.03 | 213.5±77.57 | 0.37 |
| HDL (mg/dL) | 29.80±6.86 | 31.71±5.43 | 0.25 |
| TG (mg/dL) | 409.2±91.11 | 416.0±120.1 | 0.94 |
| Cholesterol (mg/dL) | 318.6±40.76 | 294.8±48.42 | 0.02 |
| Variables | Alcoholism | p-value |
| Yes | No |
| Fasting glucose (mg/dL) | 159.6±49.67 | 154.9±45.77 | 0.62 |
| Post prandial glucose (mg/dL) | 219.3±61.51 | 211.9±64.11 | 0.56 |
| HbA1c (%) | 8.26±1.50 | 8.59±1.59 | 0.29 |
| Blood urea (mg/dL) | 15.81±6.72 | 15.85±4.72 | 0.97 |
| Creatinine (μmol/L) | 1.08±0.50 | 1.06±0.32 | 0.73 |
| Serum uric acid (mg/dL) | 5.61±2.14 | 5.82±2.09 | 0.45 |
| Albumin (g/dL) | 4.38±1.23 | 4.63±1.27 | 0.46 |
| Globulin (g/dL) | 3.28±1.06 | 3.10±0.81 | 0.98 |
| Total protein (g/dL) | 7.68±1.21 | 7.72±1.58 | 0.98 |
| hs-CRP (mg/L) | 6.48±2.01 | 6.62±1.66 | 0.51 |
| LDL (mg/L) | 246.3±74.84 | 205.0±67.73 | 0.006 |
| HDL (mg/dL) | 29.72±6.97 | 31.15±5.88 | 0.34 |
| TG (mg/dL) | 425.8±93.24 | 407.3±107.1 | 0.57 |
| Cholesterol (mg/dL) | 321.2±39.47 | 301.0±47.39 | 0.01 |
| Variables | Hypertension | p-value |
| Yes | No |
| Fasting glucose (mg/dL) | 163.6±47.07 | 155.1±48.03 | 0.42 |
| Post prandial glucose (mg/dL) | 230.1±56.84 | 210.5±64.39 | 0.16 |
| HbA1c (%) | 8.44±1.77 | 8.40±1.46 | 0.91 |
| Blood urea (mg/dL) | 15.11±4.64 | 16.10±6.25 | 0.60 |
| Creatinine (μmol/L) | 1.02±0.45 | 1.09±0.42 | 0.27 |
| Serum uric acid (mg/dL) | 6.11±2.59 | 5.56±1.90 | 0.47 |
| Albumin (g/dL) | 4.41±1.32 | 4.53±1.23 | 0.69 |
| Globulin (g/dL) | 3.30±1.08 | 3.16±0.90 | 0.93 |
| Total protein (g/dL) | 7.73±1.39 | 7.69±1.40 | 0.97 |
| hs-CRP (mg/L) | 7.18±2.18 | 6.31±1.66 | 0.02 |
| LDL (mg/L) | 228.1±73.35 | 214.5±75.35 | 0.16 |
| HDL (mg/L) | 31.03±5.36 | 28.67±8.74 | 0.41 |
| TG (mg/L) | 416.3±104.5 | 397.7±88.62 | 0.53 |
| Cholesterol (mg/L) | 329.3±31 | 304.6±46.91 | 0.02 |
GCK -30G/A Genotype Distribution among T2DM Cases and Healthy Controls
Significant differences were observed in distribution of GCK -30G/A genotypes among T2DM cases and healthy controls (p<0.0001). In T2DM cases homozygous GG, heterozygous GA, mutant homozygous AA was (42%), (49%), (9%), respectively, while in healthy controls it was (80%), (20%) and (0%), respectively. Risk allele A among T2DM cases was 0.34 while in healthy controls it was 0.10. However, G allele in T2DM was 0.67 while in healthy controls it was 0.90 [Table/Fig-4].
Distribution of GCK genotypes among T2DM cases and healthy controls.
| Variables | GG (%) | GA (%) | AA (%) | p-value | G allele | A allele |
|---|
| T2DM cases | 42 (42%) | 49 (49%) | 9 (9%) | <0.0001 | 0.67 | 0.34 |
| Healthy controls | 80 (80%) | 20 (20%) | 00 (0) | 0.90 | 0.10 |
GCK -30G/A Genotype and Risk among T2DM Cases
Odds ratio was calculated and observed that the heterozygous GA genotype had 4.66 odds ratio while odds ratio for mutant AA genotype was 35.98 in reference to wild type genotype [Table/Fig-5].
Risk association of GCK -30G/A genotype among T2DM cases.
| Genotypes | T2DM cases | Healthy controls | Odds ratio |
|---|
| GG | 42 (42%) | 80 (80%) | Ref |
| GA | 49 (49%) | 20 (20%) | 4.66 (2.46-8.85) |
| AA | 9 (9%) | 0 (0%) | 35.98 (2.04-633.4) |
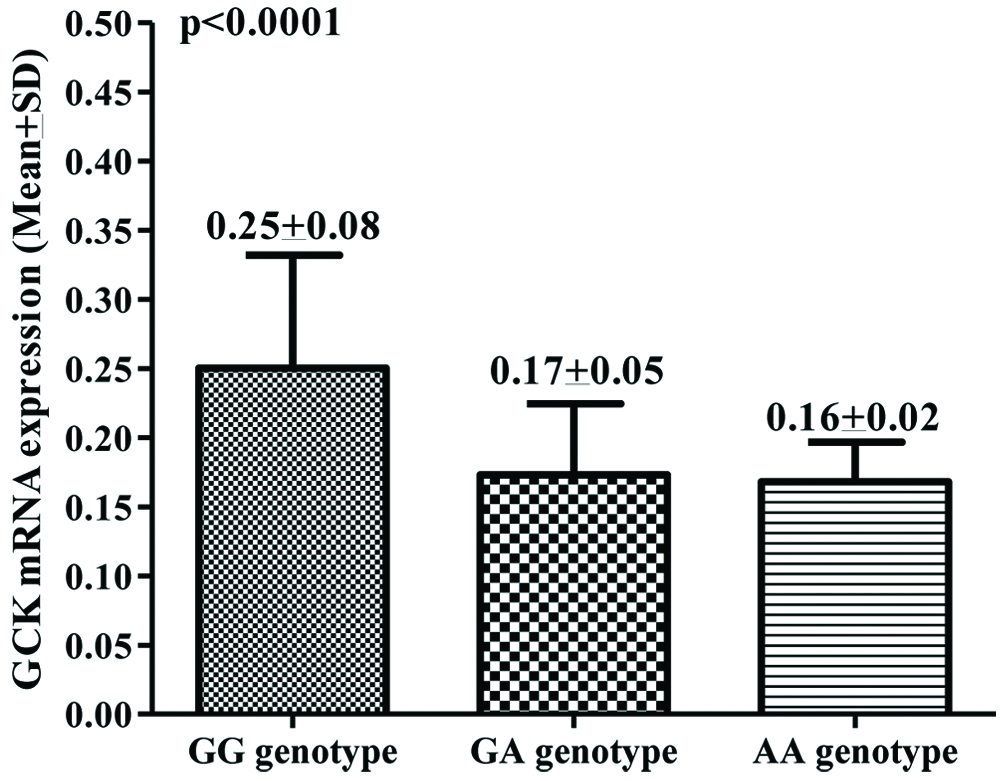
Association of GCK mRNA Expression with -30G/A Genotypes
In T2DM cases, overall 0.20 (Mean±SD, 0.20±0.07) mean fold change increased expression was observed compared to healthy controls. However, significant difference was observed in expression pattern with respect to genotypes. GCK genotype patients with homozygous GG showed 0.25 mean fold decreased GCK mRNA expression while heterozygous GA and mutant AA genotype showed more than 0.17 and 0.16 mean fold decreased GCK mRNA, respectively and differences among them were found to be significant (p<0.0001, [Table/Fig-6]).
GCK mRNA expression among homozygous, heterozygous and mutant.
Discussion
Glucokinase (GCK) on the control of systemic blood glucose homeostasis that is summarised as the GCK glucose sensor paradigm. In pancreatic beta-cells, GCK serves as a sensor of blood glucose that regulates insulin secretion. In the liver, GCK controls the glucose disposal that promotes glycogen and triglyceride synthesis [16]. Many activating and inactivating GCK mutants have been characterised in patients [17]. Several studies have identified environmental factors, including physical inactivity and caloric excess, which contribute to the pathogenesis of type 2 diabetes and the metabolic syndrome [18]. Likewise, there is much evidence to demonstrate that genetics plays an important role in these diseases [19,20].
Authors found an association of GCK promoter polymorphism which was linked with T2DM. Distributions of biochemical parameters were also significantly different between T2DM cases and association of risk factor were also found to be associated with biochemical parameters among T2DM. A significant difference was found in GCK-30G/A genotype and allele frequency distribution among T2DM cases and healthy controls. Risk allele A was higher in T2DM cases as compared to healthy controls. Odds ratio also showed that risk was associated with heterozygous GA and mutant AA genotypes among T2DM cases. With respect to genotype, decreased GCK mRNA expression was found in T2DM cases and significant difference was observed among genotypes in T2DM cases.
Inactivation of mutations in GCK causes neonatal diabetes mellitus and MODY [21, 22]. Genetic variant rs1799884 in the β-cells specific promoters of GCK in pancreas has linked with increased risk of T2DM, hyperglycemia and reduced function of β-cells [23,24]. It has been said that GCK -30G/A has been conclusively associated with fasting glucose in European population [25]. GCK-30G/A polymorphism of GCK influences susceptibility to phenotypes of impaired glucose regulation. Recent studies support the influence of genetic and environmental factors on T2DM susceptibility. A twin study on Danish population observed the significant high heritability for reduced glucose tolerance in T2DM patients [26]. Muller YL et al., and Rosta K et al., reported that several SNP’s in GCK gene are linked with reduced regulation of glucose and increased risk of T2DM [11,12].
Several studies reported that activity of GCK decreases in T2DM [27,28]. GCK gene mutation causes MODY. Therefore, post-transcriptional or transcriptional effects causes reduction in activity of GCK. Under normal conditions, Fork head box O (FOXO) is inactivated by insulin, through AKT mediated phosphorylation and nuclear exclusion. Hence, common reason for extreme production of glucose during diabetes mellitus is improper hepatic FOXO process activation, because of insulin resistance. Suppressing GCK and promoting G6PC are two important characteristics of production of glucose by FOXO pathway [29,30].
Present study is significant in unmasking the underlying role of GCK gene which plays an important role in T2DM. This gene showed a strong association with T2DM. So, further studies to find the association of GCK gene and its effects can be performed in other populations. More studies with more clinicopathological and anthropogenic parameters in different ethnic populations can provide the preventive measures for T2DM patients.
Limitation(s)
There are few limitations of present study. Firstly, the sample size of the present study was small. Hence, this study need to confirm on larger sample size. Secondly, it cannot be excluded that the variation in a variety of diet and medications may have affected present study findings.
Conclusion(s)
Present study concluded that risk was found to be associated with the GCK gene -30G/A nucleotide alteration. Decreased GCK mRNA expression was observed and associated with -30G/A genotypes which may be responsible for the worsening of the disease.