Caesarean section delivery is a common operative procedure in obstetrics. The overall rate of caesarean section delivery in 2015-16 is around 17.2% in India, increased from 8.5% in 2005-06 [1,2]. One survey performed among pregnant women has clearly shown that pain during and after caesarean delivery is of greatest concern in the parturient [3]. Caesarean sections are unique from other major laparotomies since mothers are expected to recover rapidly and to look after for their new-borns within a few hours following operation. Therefore, women after caesarean delivery are less willing to feel drowsy or get restricted by devices that do not allow them to attend their babies freely [4].
At present, majority of caesarean deliveries are performed under neuraxial anaesthesia instead of general anaesthesia [5]. Use of regional anaesthesia avoids the risks of maternal aspiration and difficult airway associated with general anaesthesia. The exposure of anaesthetics to neonate is minimal along with benefit of awake mother. Neuraxial block allows placement of neuraxial opioids or other adjuvants to prolong postoperative analgesia. In addition, blood loss is also reduced under regional anaesthesia [6]. A variety of medications including vasoconstrictors, opioids, α2 adrenergic agonists and acetylcholine esterase inhibitors, have been added to spinal medications to potentiate analgesia while reducing the required dose of local anaesthetics [7]. Clonidine, an α2 adrenergic agonists can also be added to local anaesthetics in order to enhance pain relief, prolong sensory block and motor block with spinal anaesthesia [8,9].
Clonidine may decrease acute hyperalgesia and possibly the development of chronic persistent pain after caesarean delivery [10]. However, there are incidences of maternal hypotension, sedation and foetal acidosis [8,11].
Morphine is a common and effective strategy for providing post-caesarean delivery analgesia and is often seen as the “gold standard” treatment. Although, a more than five-fold increase in the dose of intrathecal morphine, analgesia remained largely unchanged due to its ceiling effect. It’s known adverse effects when delivered by neuraxial route like severe pruritus, nausea, vomiting and rarely oral herpes, respiratory depression is well evident [4]. Considering these merits and demerits of the study drugs as found in the previous literature, it was essential to further assess their therapeutic role in such specific clinical condition.
Achieving high quality post-caesarean analgesia of consistently prolonged duration is an attractive goal, provided the drug used has acceptable side effects as the parturient need to take care of her baby at the earliest. So, this study was aimed primarily to evaluate the role and compare the efficacy of intrathecal morphine and clonidine as adjuvant for post-caesarean analgesia and secondarily to compare the adverse effects, if any, in both the study group.
Materials and Methods
After obtaining approval from the Institutional Ethics Committee (VIMS/015/09 dt 21.12.10) and obtaining written informed consent from ninety parturients, this randomised, double blinded study was conducted in the Department of Gynaecology and Obstetrics of Vivekananda Institute of Medical Science, Kolkata during March to November 2011 for a total period of nine months.
Inclusion criteria: Parturient aged 20 to 35 years planned for caesarean section with ASA I and II, preoperative Hb% level ≥11 gm%, willing to participate were included in the study.
Exclusion criteria: Those with ASA III and above, patients predicted for difficult intubation and known allergy to study drugs were excluded.
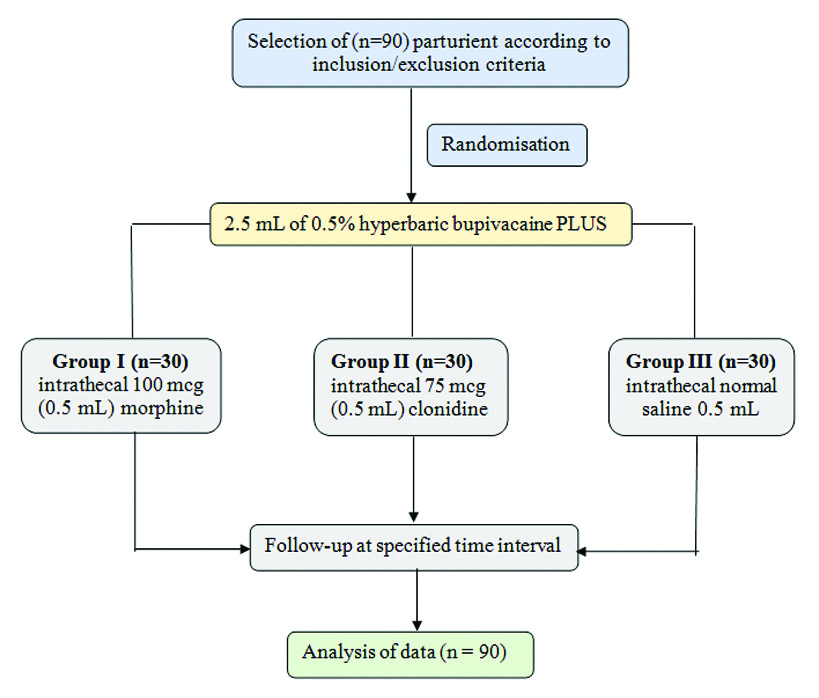
With 5% margin of error and a 95% confidence interval considering a sample proportion of 50% and expecting a 10% dropout the sample size was calculated around n=90. The selected parturient were further randomised using computer generated random number (Random.org®) into three groups; Group I (n=30) received intrathecal 100 mcg (0.5 mL) morphine, group II (n=30) received 75 mcg (0.5 mL) clonidine and group III (n=30) received normal saline 0.5 mL along with 2.5 mL of 0.5% hyperbaric bupivacaine [12]. Both study participants and the anaesthetist assessing the level of analgesia in the parturient were blinded. Administration of study drugs and other anaesthetic agents were done by separate anaesthetist who didn’t participate in the analysis of the outcome of the study [Table/Fig-1].
Flow chart of study design.
In the operating room, an intravenous cannula (18G) was inserted and patient was preloaded with balanced salt solution (10 mL/kg). Pulse rate, Non-Invasive Blood Pressure (NIBP), respiratory rate, Saturation of Peripheral Oxygen (SpO2) were recorded before spinal anaesthesia. Anaesthesia was initiated in the sitting position using a 25-gauge pencil point spinal needle (Whitacre) inserted at L3-L4 or L4-L5 interspace. The study drug was administered intrathecally and the patient was immediately placed to supine position with left lateral tilt. Level of analgesia attained was assessed before beginning of surgery. Time of onset of analgesia (sensory block) was assessed by pinprick method [13]. Onset of motor block was assessed by straight leg raising test while patient lying supine and the degree of motor block was assessed using the modified Bromage scale [14] where 0 indicates full flexion of knee and feet thus no motor blockade and a score of 3 indicates patient unable to move legs or feet thus complete motor blockade.
Following confirmation of spinal block by loss of sensation to pinprick up to T4 level in both groups, inability to move legs or feet, surgery was initiated. All patients received supplementary oxygen through nasal cannula (3 litre/min). Hypotension (if any) was managed with additional fluid and injection phenylephrine 50 μg intravenously as and when required. Bradycardia was treated with intravenously injection atropine 0.6 mg IV. Patient’s pulse rate, NIBP, respiratory rate, SpO2, ECG was monitored throughout the procedure and postoperatively till 24 hours. Occurrence of side effects like nausea, vomiting, pruritus, sedation, urinary retention, respiratory depression (respiratory rate <10/min.) was observed and recorded. Neonatal outcome was assessed by APGAR Score at 1 minute and 5 minutes by a paediatrician. Postoperative analgesia level was assessed by using Visual Analog Scale (VAS) [15] where a score of 0 indicates “no pain” and a score of 10 indicates “worst imaginable pain” at 2-hour interval for 12 hours and 4 hour interval for 24 hours and the reading was graded. Rescue medicine as analgesic for pain relief in postoperative period was provided with injection diclofenac sodium 75 mg intramuscularly when the VAS score was >4 and the time of administration was recorded. Duration of pain relief was considered from onset of subarachnoid block to time of administration of first dose of rescue analgesia. Total dose of rescue analgesic required in 24 hours was also recorded.
Statistical Analysis
After completion of the study, the data were checked for any error. All data obtained from morphine group (Group I), clonidine group (group II) and control group (Group III) were presented as mean±standard deviation. Statistical analysis was done using Analysis of Variance (for continuous variables like Blood Pressure, heart rate, etc.,) and chi-square test (for discrete variables like VAS score, side effects, etc.,) using statistical software SPSS 16.0. The p-value <0.05 was considered statistically significant.
Results
The study participants, total (n=90) in all the three groups were comparable with respect to their demographic profile, baseline haemodynamic parameter and duration of surgery were statistically insignificant [Table/Fig-2]. All the participants were analysed at the end of the study without any case of lost to follow-up.
Demographic profile and baseline parameters of the all the study participants.
| Demographic profile | Group I (n=30) (mean±SD) | Group II (n=30) (mean±SD) | Group III (n=30) (mean±SD) | p-value |
|---|
| I and II | I and III | II and III |
|---|
| Age (year) | 28.37±3.72 | 28.3±4.02 | 28.57±2.65 | 0.947 | 0.811 | 0.763 |
| Weight (kg) | 71.67±5.66 | 72.9±5.92 | 71.13±4.7 | 0.413 | 0.693 | 0.205 |
| Height (cm) | 156.1±4.25 | 156.6±4.62 | 156.77±3.71 | 0.664 | 0.520 | 0.878 |
| Gestational age (week) | 38.57±1.14 | 38.6±1.04 | 38.7±1.44 | 0.906 | 0.692 | 0.759 |
| SBP(mm of Hg) | 116.34±4.67 | 118.77±3.68 | 114.80±4.12 | 0.278 | 0.315 | 0.296 |
| DBP(mm of Hg) | 72±2.45 | 74±8.41 | 74±6.26 | 0.984 | 0.812 | 0.793 |
| Pulse rate | 84±7.90 | 82±6.78 | 86±8.21 | 0.743 | 0.589 | 0.681 |
| Respiratory Rate (per min) | 16±1.27 | 18±1.50 | 18±3.45 | 0.208 | 0.261 | 0.298 |
| SpO2 (%) | 98±3.33 | 99±4.92 | 98±6.54 | 0.357 | 0.290 | 0.452 |
| Duration of surgery (mins) | 38.3±6.29 | 40±5.78 | 37±7.99 | 0.899 | 0.941 | 0.944 |
All values are expressed as mean±standard deviation. p-values are calculated using Analysis of Variance (ANOVA) test; p-value <0.05 was considered statistically significant
In [Table/Fig-3] intraoperative variation in Mean Arterial Blood Pressure (MABP) was compared among all the three groups at 1-minute interval for 5 minutes, 5-minute interval for 15 minutes and 15-minute interval for 60 minutes. All the three groups showed a gradual fall in MABP with maximum fall at 5 minutes. Then there was a gradual rise with time and approached the base line after 60 minutes. A maximum fall in MABP was noticed in group II patients i.e., clonidine. A very significant change (p-value <0.001) was observed when clonidine was compared with placebo as well as with morphine group after 10 minutes to 60 minutes of post spinal anaesthesia. Morphine showed least variation across entire follow-up and thus found to be statistically insignificant.
Intraoperative Changes in Mean Arterial Pressure (MABP) of the study participants.
| Time interval after spinal block (minute/s) | Group I (n=30)MABP(mm/Hg) | Group II (n=30) MABP (mm/Hg) | Group III (n=30) MABP (mm/Hg) | p-value |
|---|
| I and II | I and III | II and III |
|---|
| 1 | 94.9±12.22 | 95.1±6.66 | 94.9±6.13 | 0.938 | 1.000 | 0.904 |
| 2 | 88.5±12.71 | 90.3±5.61 | 90.6±6 | 0.481 | 0.416 | 0.842 |
| 3 | 84.5±8.28 | 85.2±4.96 | 87.7±6.47 | 0.693 | 0.101 | 0.098 |
| 4 | 84.3±6.07 | 81.8±5.14 | 85.87±6.15 | 0.091 | 0.325 | 0.007 |
| 5 | 83.1±5.07 | 78.8±5.79 | 83.53±5.97 | 0.003 | 0.763 | 0.003 |
| 10 | 87.7±4.98 | 82.1±5.47 | 87.7±4.94 | <0.001 | 1.000 | <0.001 |
| 15 | 89.6±5.56 | 83.77±3.56 | 89.8±3.27 | <0.001 | 0.866 | <0.001 |
| 30 | 90±6.09 | 84.13±4.3 | 89.9±4.95 | <0.001 | 0.945 | <0.001 |
| 45 | 90.5±5.61 | 85.1±5.05 | 90.7±3.24 | <0.001 | 0.866 | <0.001 |
| 60 | 91.17±4.27 | 85.5±4.8 | 91.7±3.61 | <0.001 | 0.603 | <0.001 |
All values are expressed as mean±standard deviation. p-values calculated using analysis of variance (ANOVA) test; p-value <0.05 was considered statistically significant; p-value <0.001 was considered highly significant.
[Table/Fig-4] shows the time of onset of sensory and motor blockade achieved after spinal anaesthesia. The time taken for onset of sensory and motor block was maximum in morphine group. This slow onset was probably due to the low lipid solubility of morphine. But in placebo and clonidine group the time taken for onset of sensory and motor block was similar. Differences between the onset time of sensory and motor block in placebo vs. morphine and clonidine vs. morphine group were very highly significant (p<0.001).
Comparison of onset of sensory and motor block and duration of motor block among the study participants.
| Time (minutes) | Group I (n=30)(mean±SD)(minutes) | Group II (n=30) (mean±SD) (minutes) | Group III (n=30) (mean±SD)(minutes) | p-value |
|---|
| I and II | I and III | II and III |
|---|
| Onset of sensory block | 2.47±0.73 | 1.5±0.51 | 1.5±0.51 | <0.001 | <0.001 | 1.000 |
| Onset of motor block | 4.57±0.63 | 3.5±0.51 | 3.6±0.5 | <0.001 | <0.001 | 0.445 |
| Duration of motor block | 240±47.27 | 205±42.49 | 170±35.53 | 0.004 | <0.001 | 0.001 |
All values are expressed as mean±standard deviation. p-values calculated using analysis of variance (ANOVA) test; p-value <0.05 was considered statistically significant, p-value <0.001 was considered highly significant.
[Table/Fig-5] depicts the time of first rescue analgesic and total dose required in 24 hours in all the three study groups. Here, it was observed that the first requirement of postoperative analgesia was in placebo group after 4.6 hours followed by 7 hours in the clonidine group and 14 hours in the morphine group, respectively. The differences in time for first rescue analgesic were very highly significant between three groups (p<0.001). Total dose of analgesic required during first 24 hours was maximum in placebo group and minimum in morphine group. The differences in total dose of rescue analgesic requirement in 24 hours in all three groups were also highly significant (p<0.001).
Comparison between 1st time of rescue analgesic administration and total dose required in 1st 24 hours postoperative period among the study participants.
| Parametres | Group I (n=30)(mean±SD) | Group II (n=30) (mean±SD) | Group III (n=30) | p-value |
|---|
| I and II | I and III | II and III |
|---|
| 1st time (hours) rescue analgesic administration | 14±7.33 | 7±1.02 | 4.6±0.93 | <0.001 | <0.001 | <0.001 |
| Total dose (mg) in 1st 24-hour in postoperative period | 75±48.25 | 112.5±38.14 | 202.5±34.96 | 0.001 | <0.001 | <0.001 |
All values are expressed as mean±standard deviation. p-values calculated using analysis of variance (ANOVA) test; p-value <0.05 to be considered statistically significant, p-value <0.001 was considered highly significant.
The VAS score of patients in morphine (Gr I) and clonidine group (Gr II) were 0, respectively following 2 hours after operation [Table/Fig-6]. But in placebo group (Gr III), only 3 patients had score of 0, 6 patients had scores of 1, 12 patients had scores of 2, 6 patients had scores of 3 and 3 patients had scores of 4, respectively. Thus at 2 hours postoperative period, the VAS scores in morphine and clonidine group were statistically highly significant (p<0.001) as compared to placebo.
Visual Analog Scale (VAS) score of study participants of different group at 2 hours after operation.
| VAS score at 2 hours | Study groups | Total | p-value |
|---|
| Group I | Group II | Group III | I and II | I and III | II and III |
|---|
| 0 | 30 (100%) | 30 (100%) | 3 (10%) | 63 (70%) | NA | <0.001 | <0.001 |
| 1 | 0 (0%) | 0 (0%) | 6 (20%) | 6 (7%) |
| 2 | 0 (0%) | 0 (0%) | 12 (40%) | 12 (13%) |
| 3 | 0 (0%) | 0 (0%) | 6 (20%) | 6 (7%) |
| 4 | 0 (0%) | 0 (0%) | 3 (10%) | 3 (3%) |
| 5-10 | 0 (0%) | 0 (0%) | 0 (0%) | 0 (0%) |
| Total | 30 (100%) | 30 (100%) | 30 (100%) | 90 (100%) | |
p-values are calculated using chi-square test; p-value<0.001 as highly significant
After 8 hours in postoperative stage the VAS score of majorities of patients of morphine Group (I) was found to have a score of 2 or less [Table/Fig-7] whereas; only 50% of the patients of clonidine (Gr II) had a score of 3 or less at the same time. The findings were statistically highly significant (p<0.001) between the two group when compared. The patients of morphine (Gr I) and clonidine (Gr II) also had a significant difference (p<0.001) in VAS score when compared with placebo (Gr III).
Visual Analog Scale (VAS) score of study participants of different group at 8 hours after operation.
| VAS score at 8 hours | Study groups | Total | p-value |
|---|
| Group I | Group II | Group III | I and II | I and III | II and III |
|---|
| 0 | 9 (30%) | 0 (0%) | 0 (0%) | 9 (10%) | <0.001 | <0.001 | <0.001 |
| 1 | 18 (60%) | 3 (10%) | 3 (10%) | 24 (27%) |
| 2 | 3 (10%) | 9 (30%) | 10 (33.33%) | 22 (24.46%) |
| 3 | 0 (0%) | 3 (10%) | 10 (33.33%) | 13 (14.48%) |
| 4 | 0 (0%) | 0 (0%) | 4 (13.38%) | 4 (4.06%) |
| 5 | 0 (0%) | 6 (20%) | 2 (6.66%) | 8 (8.88%) |
| 6 | 0 (0%) | 9 (30%) | 1 (3.33%) | 10 (11.12%) |
| 7-10 | 0 (0%) | 0 (0%) | 0 (0%) | 0 (0%) |
| Total | 30 (100%) | 30 (100%) | 30 (100%) | 90 (100%) | |
p-values are calculated using chi-square test; p-value<0.001 was considered as highly significant
At the end of 1st postoperative day i.e., 24 hours the VAS score of morphine group(I) was found to be statistically significant (p=0.002 and <0.001 respectively) when compared to clonidine (Gr II) as well as placebo (Gr III). But the VAS score of clonidine (Gr II) was insignificant when compared to placebo (Gr III) [Table/Fig-8].
Visual Analog Scale (VAS) score of study participants of different group at 24 hours after operation.
| VAS score at 24 hours | Study groups | Total | p-value |
|---|
| Group I | Group II | Group III | I and II | I and III | II and III |
|---|
| 1 | 6 (20%) | 3 (10%) | 0 (0%) | 9 (10%) | 0.002 | <0.001 | 0.209 |
| 2 | 3 (10%) | 9 (30%) | 6 (20%) | 18 (20%) |
| 3 | 12 (40%) | 6 (20%) | 9 (30%) | 27 (30%) |
| 4 | 3 (10%) | 12 (40%) | 15 (50%) | 30 (33%) |
| 5 | 6 (20%) | 0 (0%) | 0 (0%) | 6 (7%) |
| 6-10 | 0 (0%) | 0 (0%) | 0 (0%) | 0 (0%) |
| Total | 30 (100%) | 30 (100%) | 30 (100%) | 90 (100%) | |
p-values are calculated using chi-square test; p-value <0.05 to be considered statistically significant, p-value <0.001 was considered highly significant.
The APGAR (Appearance, Pulse, Grimace, Activity, and Respiration) score of the neonates of all the three groups were assessed at 1 and 5 minutes [Table/Fig-9] which was found to be statistically insignificant (p≥0.05). There were no respiratory depression or adverse neonatal outcome in any group. Hypotension, bradycardia and sedation (p=0.028) were more in clonidine group whereas pruritus and vomiting are more in morphine group but statistically insignificant (p=0.512).
APGAR (Appearance, Pulse, Grimace, Activity, and Respiration) score of neonates at different time interval in the study groups.
| APGAR score (min) | Group I (mean±SD) | Group II (mean±SD) | Group III (mean±SD) | p-value |
|---|
| I and II | I and III | II and III |
|---|
| 1 | 8.47±0.97 | 8.4±0.77 | 8.43±0.77 | 0.77 | 0.884 | 0.858 |
| 5 | 9.37±0.67 | 9.73±1.86 | 9.4±0.5 | 0.313 | 0.827 | 0.346 |
Discussion
The present study was conducted to evaluate the analgesic efficacy of intrathecal morphine and clonidine as an adjuvant to bupivacaine given intrathecally for post-caesarean pain relief. A double-blind randomised model was chosen to preclude selection or observer bias. In this study the patients in the placebo, clonidine and morphine groups were matched for age, body weight, height and gestational age.
Abboud TK et al., evaluated analgesic efficacy of morphine added to bupivacaine for post-caesarean pain relief and found 0.1 mg morphine had excellent analgesia with minimal to no side effect in comparison to 0.25 mg morphine which is comparable with the present study [16]. Kirson EL et al., also compared between 0.1 and 0.2 mg intrathecal morphine along with bupivacaine and found more nausea and vomiting with 0.2 mg though both were effective in reducing postoperative pain in patients undergoing transurethral resection of prostate unlike this study [17]. Similar findings were also evident in a study by Milner AR et al., for post-caesarean analgesia [18]. Tuijl IV et al., and Fogarty DJ et al., concluded from the studies that addition of 75 μgm clonidine to hyperbaric bupivacaine prolongs spinal anaesthesia after caesarean section and improves analgesia without clinically relevant side effects which has a similarity with this study [19,20].
In the present study, it was observed that the time of first rescue analgesic i.e., injection diclofenac sodium was required in maximum amount and earliest postoperative time in normal saline group followed by clonidine and then the morphine group which reflects the effectiveness of morphine as a better analgesic over the other groups when administered intrathecally.
Fogarty DJ et al., in their study showed that both intrathecal clonidine and morphine prolonged the time of first rescue analgesic compared with saline [20]. Total analgesic consumption on the first night after total hip replacement was significantly less in morphine group than placebo and clonidine group which was also observed in the present study.
In this study, pain after elective caesarean section (measured by VAS pain score) was significantly lower after intrathecal morphine (100 μgm) compared with clonidine (75 μgm) at 2 hours, 8 hours and 24 hours’ time interval in the 1st postoperative day. The analysis of the APGAR sore of the foetus in all the study group revealed no statistically significant adverse effects on them due to the study drugs.
Limitation(s)
The present study was conducted in a small cohort of 90 parturient in a single centre within a short interval of time in post caesarean cases only. Effect of the study drugs in other major elective operations were not considered and analysed. Scope of further exploration is open to attain external validity, accurate and acceptable results by incorporating various surgical procedures in the study to substantiate the current findings.
Conclusion(s)
The study concludes that both low dose intrathecal morphine (100 μg) and clonidine (75 μg) are effective as an adjuvant to bupivacaine during spinal anaesthesia for post-caesarean analgesia, morphine being more efficient than clonidine. In addition, the haemodynamic stability is better preserved with morphine. Therefore, low dose intrathecal morphine as an adjunct to bupivacaine is superior to clonidine for postoperative analgesia in patients undergoing caesarean section delivery.
Authors Contribution
SG and SR helped with the Concept, design of study and literature search, experimental studies. AB and BBG helped with the Data acquisition, data analysis, statistical analysis. AB and SG worked with Manuscript preparation. DB and SS helped in Manuscript editing and manuscript review.
All values are expressed as mean±standard deviation. p-values are calculated using Analysis of Variance (ANOVA) test; p-value <0.05 was considered statistically significant
All values are expressed as mean±standard deviation. p-values calculated using analysis of variance (ANOVA) test; p-value <0.05 was considered statistically significant; p-value <0.001 was considered highly significant.
All values are expressed as mean±standard deviation. p-values calculated using analysis of variance (ANOVA) test; p-value <0.05 was considered statistically significant, p-value <0.001 was considered highly significant.
All values are expressed as mean±standard deviation. p-values calculated using analysis of variance (ANOVA) test; p-value <0.05 to be considered statistically significant, p-value <0.001 was considered highly significant.
p-values are calculated using chi-square test; p-value<0.001 as highly significant
p-values are calculated using chi-square test; p-value<0.001 was considered as highly significant
p-values are calculated using chi-square test; p-value <0.05 to be considered statistically significant, p-value <0.001 was considered highly significant.