Peritonitis is defined as inflammation of the peritoneum due to localised or generalised infections. Peritonitis is one of the most common infections and an important problem that a surgeon encounters. Despite the surgical treatment, intensive care treatment and advance in antibiotic therapy and a good understanding of the patho-physiology, the mortality rates of perforation peritonitis are still high ranging from 5.6%-56% [1-4]. Hence, early prognostic evaluation of abdominal sepsis is preferred to select high-risk patients for more aggressive therapeutic procedures and to classify the severity of the disease.
Treatment of peritonitis is primarily surgical and early intervention is always preferred [1,5]. Different scoring systems have been used to predict the outcome of patients with peritonitis. These scores can be a good tool to predict the prioritisation of treatment and care of patients and also help to predict the prognostic factors that affect morbidity and mortality in patients with peritonitis. Many scores have been developed and studied over years which include MPI, APACHE II score, POSSUM (Physiological and Operative Severity Score for the enumeration of Mortality and Morbidity) [6-8], Sequential Organ Failure Assessment (SOFA) [9,10] and more.
As the available literature was not clearly in favour of one score (though APACHE was favoured by many), authors wanted to assess the ability of MPI and APACHE II score to predict outcome in the population. MPI is simple and easy. If MPI could be proven to be as good as APACHE II score, then this could be of good use in rural hospitals (secondary hospitals associated with our centre) lacking facilities for blood gas and other investigations required to use complex scoring systems like APACHE II score.
Hence, the aim of the present study was to evaluate the ability of MPI and APACHE II score in predicting outcome in patients with peritonitis.
Materials and Methods
This prospective observational study was conducted in the Department of General Surgery at Christian Medical College and Hospital, Vellore, Tamil Nadu, India, over a period of two years from September 2014 to August 2016. Ethical clearance was obtained from the Institutional Research Board with study number 9049. Sample size calculation was done based on the sensitivity of MPI score, as in earlier studies, which was found to be about 90% [12,13,18]. With a precision of 15% and 95% desired confidence interval, the number of deaths to be studied was found to be 15. In order to study 15 deaths, with incidence of mortality being 20% in patients with peritonitis, so, sample size of 75 patients were required. So, finally Author included 78 patients in the study. All patients more than 16 years of age with secondary peritonitis were included in the study. Patients with peritonitis secondary to trauma, pancreatitis, spontaneous bacterial peritonitis or primary peritonitis were excluded from the study.
A total of 78 patients were recruited. All patients had routine preoperative blood work up done and arterial blood gas was also done. Chest X-ray erect, abdominal X-rays erect and supine were done in all cases. All patients were resuscitated with intravenous fluids and were empirically started on broad spectrum antibiotics at presentation. Nasogastric tube decompression was also done and patients were diagnosed to be peritonitis if they had examination findings of tenderness with guarding or rigidity. All patients underwent emergency laparotomy and surgical procedure done was of the surgeon’s choice. All investigations and surgical procedures were carried out with proper informed and written consent as appropriately.
The patients were scored with two scoring systems at admission or within 24 hours. If blood parameters were tested more than once, the most deranged value was used for scoring. The two scores used were MPI and APACHE II score. MPI score used eight risk factors which were found to be significantly associated with prognosis in patients with peritonitis [3]. The maximum score was 47. The best cut-off points used in various studies included 21, 26 and 29 [19-21]. In present study, it was decided to find a new cut-off value for each score and use that to assess the outcome. This was done using Yuden index as described in the statistical analysis. APACHE II score had 2 parts. The first one dealt with acute physiology and the second with chronic health evaluation. It was primarily designed for Intensive Care Unit. It utilises 12 values and determines the outcome [11]. Patients were followed-up to discharge and the primary outcome assessed was in-hospital death or discharge. Secondary outcomes assessed included morbidity and risk factors for mortality in peritonitis. Morbidity was studied in terms of local and systemic complications. The local complications studied were wound infection, wound dehiscence, intra-abdominal collection, anastomotic leak and reoperation. The systemic complications studied were patients requiring dialysis for more than 48 hours postoperative, patients requiring mechanical ventilation for more than 48 hours postoperatively, patients with Glasgow Coma Scale (GCS) less than 8 despite withholding sedation for more than 48 hours, mean hospital stay and mean ICU stay.
Statistical Analysis
Data was entered in EPIDATA software. For continuous data, the descriptive statistics Mean±SD and for non-normally distributed interval data and ordinal data, median (IQR) was presented. Number of patients and percentage was presented for categorical data. The Chi-square test, Fisher’s-exact test (when expected count is less for cell) and Yates continuity correction (where the cell have zero count) was used to find association between two categorical variables. Mann-Whitny U test was performed to compare two groups-ICU stay and hospital stay. The best cut-off value for MPI and APACHE II for present study data was calculated using Yuden index. Receiver Operator Characteristic (ROC) analysis was performed for MPI and APACHE II score. The sensitivity, specificity and likelihood ratios were calculated. All tests were two-sided at α=0.05 level of significance. The Statistical Analysis Software (SAS) package (SAS® Institute Inc., USA, version 9.2) was used for statistical evaluation.
Results
Of the 78 patients studied, 59 (75.6%) were males and 19 (24.4%) were females (p=0.65) [Table/Fig-1]. The mean age was 48.45±16.67 years. The lowest age was 18 years and the oldest patient was 85-year-old. The minimum heart rate was found to be 68 beats/minute and maximum of 160/minute. The minimum and maximum duration of symptoms were 1 day and 14 days, respectively. The minimum and maximum systolic blood pressure was found to be 70 mm Hg and 200 mm Hg, respectively. The lowest leukocyte counts noted was 1100/cubic mm and highest counts were 82000/cubic mm. The lowest and highest creatinine values noted were 0.36 g/dL and 6.35 g/dL, respectively.
Patient characteristics vs Outcome.
| Patient characteristics | Outcome | Total N=78 N (%) | p-value |
|---|
| Non-survivors (n=10) N (%) | Survivors (n=68) N (%) |
|---|
| Sex† |
| Male | 7 (9%) | 52 (66.7%) | 59 (75.7%) | 0.651 |
| Female | 3 (3.8%) | 16 (20.5%) | 19 (24.3%) |
| Age (years)‡ |
| ≤48 | 0 (0%) | 36 (46.15%) | 36 (46.15%) | 0.002 |
| >48 | 10 (12.82%) | 32 (41.02%) | 42 (53.85%) |
| Diabetes† |
| Yes | 1 (1.3%) | 6 (7.7%) | 7 (9%) | 0.902 |
| No | 9 (11.5%) | 62 (79.5%) | 71 (91%) |
| Hypertension‡ |
| Yes | 0 (0%) | 8 (10.26%) | 8 (10.26%) | 0.252 |
| No | 10 (12.82%) | 60 (76.92%) | 70 (89.74%) |
| Duration of symptoms† |
| <2 days | 4 (5.1%) | 23 (29.4%) | 27 (34.6%) | 0.701 |
| ≥2 days | 6 (7.7%) | 45 (57.7%) | 51 (65.4%) |
| ASA score† |
| ASA 1 | 6 (7.6%) | 49 (62.8%) | 55 (70.5%) | 0.430 |
| ASA 2 | 4 (5.1%) | 19 (24.4%) | 23 (29.5%) |
| Heart rate (beats/minute) |
| ≤110 | 5 (6.4%) | 34 (43.5%) | 39 (50%) | 1.001 |
| >110 | 5 (6.4%) | 34 (43.5%) | 39 (50%) |
| Systolic BP (mmHg)† |
| ≥100 | 2 (2.5%) | 25 (32.05%) | 27 (34.6%) | 0.292 |
| <100 | 8 (10.3%) | 43 (55.12%) | 51 (65.4%) |
| Total counts (per cubic mm)† |
| 4000-12000 | 3 (3.8%) | 32 (41.02%) | 35 (44.9%) | 0.301 |
| <4000 & >12000 | 7 (9%) | 36 (46.15%) | 43 (55.1%) |
| Left shift† |
| Yes | 8 (10.3%) | 58 (74.4%) | 66 (84.7%) | 0.663 |
| No | 2 (2.5%) | 10 (12.8%) | 12 (15.3%) |
| Creatinine (g/dL)† |
| ≤1.3 | 4 (5.1%) | 53 (68%) | 57 (73.1%) | 0.012 |
| >1.3 | 6 (7.6%) | 15 (19.2%) | 21 (26.9%) |
p-value was obtained from the Chi-square test, †Fisher’s-exact test (when expected count was less for cell); ‡Yates continuity correction (where the cells have zero count); ASA-American society of anesthesiologist
Majority of the patients (47.4%) were found to have peritonitis secondary to duodenal perforation. The second commonest cause was due to small bowel perforation. Gall bladder perforation was the least common cause for peritonitis among the patients [Table/Fig-2].
Aetiology of perforation.
| Site of perforation | Number (percentage) |
|---|
| Duodenal and pre-pyloric perforation | 37 (47.4%) |
| Ileal (small bowel perforation) | 16 (20.5%) |
| Appendix | 14 (17.9%) |
| Colon | 6 (7.7%) |
| Stomach | 3 (3.9%) |
| Gall bladder | 2 (2.6%) |
The best cut-off values for MPI and APACHE II scores were calculated using Yuden index and were found to be 27 and 10 respectively. The area under the curve was found to be 0.78 and 0.66 for MPI and APACHE II scores, respectively [Table/Fig-3].
Receiver Operator Characteristic analysis (ROC) for MPI and APACHE II score.
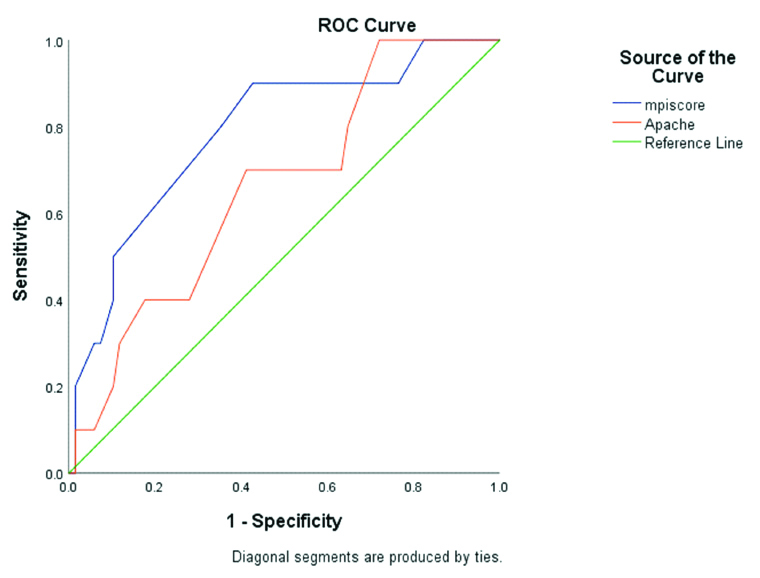
The over-all mortality in present study was 10 patients which was 13%. Among the 10 mortalities, nine patients (90%) had an MPI score of ≥27 (p-value=0.005). Out of the 10 non-survivors, four had an APACHE II score of ≥10 (p-value=0.435). The mean MPI and APACHE II scores among the non-survivors were found to be 32.5±4.8 and 10.6±3.6, respectively.
The sensitivity, specificity, positive predictive value, negative predictive value and accuracy rate with a cut-off of 10 for APACHE II, was found to be 40%, 78%, 21%, 89% and 67.5%, respectively. The sensitivity, specificity, positive predictive value, negative predictive values and accuracy rate for MPI score with a cut-off of 27, was found to be 90%, 57%, 23%, 97.5% and 61.5%, respectively.
MPI score≥27 was able to predict need for dialysis (p=0.035), need for mechanical ventilation (p=0.001) and median ICU stay (p=0.004). APACHE II ≥10 was unable to predict any morbidity factors that we studied [Table/Fig-4,5].
| MPI ≥27 N (%) | MPI <27 N (%) | p-value |
|---|
| Wound infection† | 7 (8.97%) | 9 (11.53%) | 0.651 |
| Wound dehiscence† | 3 (3.8%) | 2 (2.5%) | 0.602 |
| Re-operation† | 2 (2.5%) | 1 (1.3%) | 0.523 |
| Intra-abdominal collection† | 5 (6.4%) | 6 (7.6%) | 0.801 |
| Anastomotic leak | 0 (0%) | 1 (1.3%) | 0.320 |
| Dialysis | 4 (5.12%) | 0 (0%) | 0.035 |
| Mechanical ventilation >48 hours† | 25 (32.05%) | 11 (14.1%) | 0.001 |
| GCS <8 | 1 (1.3%) | 0 (0%) | 0.304 |
| ICU stay (days)‡†, Median (IQR) | 3 (0,7) | 0 (0,3) | 0.004 |
| Hospital stay (days)‡†, Median (IQR) | 8 (7,12) | 10 (7,13) | 0.306 |
p-value is obtained from the †Fischer’s-exact test (when expected count is less for cell) and Yates continuity correction (where the cells have zero count); ‡Values are presented as Median (IQR): Median (25th percentile, 75th percentile) and p-value is obtained from nonparametric Mann-Whitney U test
| APACHE ≥10 N (%) | APACHE <10 N (%) | p-value |
|---|
| Wound infection† | 5 (6.4%) | 11 (14.1%) | 0.862 |
| Wound dehiscence† | 1 (1.2%) | 4 (5.12%) | 0.602 |
| Re-operation† | 0 (0%) | 3 (3.8%) | 0.254 |
| Intra-abdominal collection† | 4 (5.12%) | 7 (8.97%) | 0.561 |
| Anastomotic leak | 0 (0%) | 1 (1.3%) | 0.515 |
| Dialysis | 2 (2.5%) | 2 (2.5%) | 0.353 |
| Mechanical ventilation >48 hours† | 13 (16.6%) | 23 (29.48%) | 0.235 |
| GCS <8† | 0 (0%) | 1 (1.3%) | 0.515 |
| ICU stay (days)‡†, Median (IQR) | 3 (0,8) | 0 (0,4) | 0.073 |
| Hospital stay (days)‡†, Median (IQR) | 8 (6,13) | 9 (7,12) | 0.673 |
Values are presented as number (percentage); P value is obtained from the †Fischer’s exact test (when expected count is less for cell) and Yates continuity correction (where the cells have zero count); ‡Values are presented as Median (IQR): Median (25th percentile, 75th percentile) and p-value is obtained from nonparametric Mann-Whitney U test
Discussion
Peritonitis is a common surgical emergency encountered. The mortality and morbidity in such patients have been studied to be high even up to 60%. The mortality rate in present study was found to be 13% which was comparable with most studies [2,22,23]. The outcome in such patients depends on several factors like age, duration of symptoms, co-morbidities and more [22,24,25]. This has been studied by many studies before and most of them concluded increasing age, longer duration of symptoms and organ failure to be significant risk factors to predict mortality. In present study, Authors found only age ≥48 years and serum creatinine ≥1.3 g/dL to be significant risk factors. Other factors such as co-morbidities, duration of symptoms, American Society of Anesthesiologists (ASA) score, tachycardia, hypotension, abnormal white cell counts, and left shift were not found to be independent risk factors in predicting mortality in peritonitis as compared to previous studies [22,24,25].
In present study, majority of patients were males (75.6%) compared to females (24.3%) as supported by other studies [15]. The aetiology of perforation in present study was commonly due to duodenal perforation as in previously described studies [26-28]. The mean MPI and APACHE II scores in non-survivors in present study were comparable to prior studies [16,29,30]. The sensitivity, specificity, positive and negative predictive values and accuracy rates of MPI and APACHE II as compared with other studies is described in [Table/Fig-6,7] [3,10,12,16,31-34]. We found comparable accuracy rates of MPI and APACHE II from previous studies [16,35].
Sensitivity, specificity, positive and negative predictive value and accuracy rate for MPI score [3,12,16,31-33].
| Study | Sensitivity | Specificity | Positive predictive value | Negative predictive value | Accuracy rate |
|---|
| Billing A et al., [12] | 76% | 58% | - | - | - |
| Valliant TAL et al., [31] | 87% | 88% | 93% | 94% | - |
| Linder MM et al., [3] | 88% | 90% | 87% | 90% | - |
| Dani DT et al., [32] | 90.6% | 91.7% | 67.44% | 98.12% | - |
| Ojuka A et al., [33] | 84.2% | 90.7% | 75.9% | 94.2% | - |
| Kumar P et al., [16] | 100% | 91% | 69% | 100% | 69% |
| Present study | 90% | 57% | 23% | 97.5% | 61.5% |
Sensitivity, specificity, positive and negative predictive value and accuracy rate for APACHE II score [10,16,34].
| Study | Sensitivity | Specificity | Positive predictive value | Negative predictive value | Accuracy rate |
|---|
| Dino H et al., [10] | 82.5% | 55.2% | 54.7% | 82.8% | 66% |
| Headly J et al., [34] | 54% | 87% | - | - | - |
| Kumar P et al., [16] | 85% | 100% | 100% | 96% | 83.3% |
| Present study | 40% | 78% | 21% | 89% | 67.5% |
MPI was found to be more sensitive than APACHE II in present study, though studies prior studies showed better APACHE II sensitivity [14,17]. Many authors have reported APACHE II to have better prognostic power for outcome prediction than MPI as it includes physiological variables [4,11,14]. In present study, the accuracy rate of APACHE II (67.5%) was higher than that of MPI (61.5%), as described in Dino H et al., [10]. In present study, it was inferred that MPI have better sensitivity; however the specificity and accuracy rates were better with APACHE II score. MPI on the other hand, was able to predict need for dialysis mechanical ventilation and prolonged ICU stay. This partly correlated with a study done previously by Gupta N et al., though the study also showed APACHE II to be good predictor of some complications such as need for ventilator stay and longer hospital stay [36]. In present study, they also found both the scores to be poor predictors of complications like wound infection and anastomotic leak. Adesunkanmi ARK et al., in 69 patients with peritonitis, did not find any significantly higher APACHE II scores in those patients who survived with postoperative complications and had long duration of hospital stay [37]. Similarly, in present study APACHE II was not a good predictor of morbidity.
Limitation(s)
The small sample size is a limitation to present study results. Though Authors aimed to find at least 15 deaths in studying the sample size, we were able to study only 10 deaths. This could contribute to our result of showing the two scores to be not very accurate (both had <70% accuracy rate). It would be prudent to study a larger population and assess the scoring systems.
Conclusion(s)
Mannheim Peritonitis Index (MPI) is a simple tool as compared to APACHE II which requires laboratory investigations including blood gas analysis. MPI also takes into consideration the aetiology of peritonitis and the nature of contamination unlike APACHE II. On the other hand, it fails to include the underlying physiological derangements of the patient which is necessary to prognosticate patients requiring intensive care. MPI proves to be a good prognosticative indicator from present study and we recommend it as an alternative tool for usage especially in areas with poor infra-structure like rural hospitals where blood gas analysis would not be possible. However, MPI also needs operative findings to complete the score, hence cannot be used preoperatively. APACHE II continues to be more specific and accurate in predicting patients with mortality.
p-value was obtained from the Chi-square test, †Fisher’s-exact test (when expected count was less for cell); ‡Yates continuity correction (where the cells have zero count); ASA-American society of anesthesiologist
p-value is obtained from the †Fischer’s-exact test (when expected count is less for cell) and Yates continuity correction (where the cells have zero count); ‡Values are presented as Median (IQR): Median (25th percentile, 75th percentile) and p-value is obtained from nonparametric Mann-Whitney U test
Values are presented as number (percentage); P value is obtained from the †Fischer’s exact test (when expected count is less for cell) and Yates continuity correction (where the cells have zero count); ‡Values are presented as Median (IQR): Median (25th percentile, 75th percentile) and p-value is obtained from nonparametric Mann-Whitney U test