Does PCR Cycle Threshold for SARS-CoV-2 have Association with ABO Blood Group Types?
Manvir Singh Tevatia1, Avnit Sidhu2, Dinesh Kumar Kalra3, Ajay Kumar Baranwal4, Priyanka Pandit5, Prerna Guleria6, Prashant Sengupta7
1 Consultant and Head, Department of Pathology, Command Hospital (SC), Pune, Maharashtra, India.
2 Associate Professor, Department of Pathology, Command Hospital (SC), Pune, Maharashtra, India.
3 Assistant Professor, Department of Pathology, Command Hospital (SC), Pune, Maharashtra, India.
4 Associate Professor, Department of Pathology, Command Hospital (SC), Pune, Maharashtra, India.
5 Assistant Professor, Department of Pathology, Command Hospital (SC), Pune, Maharashtra, India.
6 Assistant Professor, Department of Pathology, Command Hospital (SC), Pune, Maharashtra, India.
7 Professor, Department of Pathology, Command Hospital (SC), Pune, Maharashtra, India.
NAME, ADDRESS, E-MAIL ID OF THE CORRESPONDING AUTHOR: Dr. Ajay Kumar Baranwal, Associate Professor, Department of Pathology, Command Hospital, Pune-411040, Maharashtra, India.
E-mail: ajaykumarbaranwal@yahoo.com
Introduction
Corona Virus Disease-19 (COVID-19) caused by the Severe Acute Respiratory Syndrome-Corona Virus-2 (SARS-CoV-2) has led to a global pandemic. Currently, the standard method for the diagnosis of COVID-19 is the detection of SARS-CoV-2 by Reverse Transcriptase Quantitative Polymerase Chain Reaction (RT-qPCR). Lower Cycle threshold (Ct) value of PCR is found to be associated with increased probability of progression to severe disease and infectivity. Blood group A individuals have been found to be more susceptible to infection by SARS-CoV-2 while that of O blood group have lower risk of infection. There has been growing scientific interest to obtain data which may characterise the susceptibility to COVID-19 infection and determine the risk factors which may be associated with progression and severity of the disease.
Aim
To study the association of RT-qPCR Ct values for SARS-CoV-2 with ABO blood group types.
Materials and Methods
A prospective observational study was conducted at tertiary care centre in western Maharashtra, India where in a total of 116 symptomatic admitted patients between mid-July to mid-August 2020 and was found to be positive for SARS-CoV-2 by RT-qPCR were enrolled in the study. Ct values for pan-Sarbecovirus E-gene and SARS-CoV-2 specific RdRP gene were recorded for each patient. In addition, all the patients were typed for ABO blood grouping. Distribution of different ABO blood group types in SARS-CoV-2 positive patients were analysed and was compared with blood groups in 882 non-COVID-19 blood donors comprising control group. Ct values for E and RdRP gene were also analysed in respect to different age group, gender and blood group types. Blood group records of voluntary healthy blood donors reporting at our centre between September to November 2019 were obtained.
Results
Of the 116 patients, 33 (28.45%) comprised of type A, 34 (29.31%) of type B, 41 (35.34%) were of type O and remaining 8 (6.90%) had AB blood group type. Compared to the control group, no significant difference was noted in the distribution of ABO blood types in SARS-CoV-2 positive patients. Also, no statistical significance was found in the Ct values with respect to age, gender and different ABO blood group types.
Conclusion
RT-qPCR Ct values for SARS-CoV-2 infection have no association with ABO blood group types.
Corona virus disease-19, Reverse transcriptase quantitative polymerase chain reaction, Viral load
Introduction
A cluster of cases with pneumonia with unknown cause were noticed in Wuhan, China in December 2019. In January 2020, World Health Organisation (WHO) officially announced a new virus initially named as the 2019-novel coronavirus (2019-nCoV) and later changed to SARS-CoV-2 as the cause of disease. Later on, in February 2020, WHO officially named the disease as COVID-19. Soon the disease spread globally and in March 2020, WHO declared the coronavirus outbreak a pandemic [1]. As of 14 August 2020, globally a total of 20,687,815 confirmed cases including 750,400 deaths has been reported with 2,461,190 cases including 48,040 deaths alone in India [2]. This has led to the shift in focus of attention of the healthcare workers, scientists and researchers worldwide towards this disease.
RT-qPCR test from respiratory samples (nasopharynx/oropharynx) is currently the standard method for the diagnosis of SARS-CoV-2 infection. This test is semiquantitative in nature and the Ct value is a surrogate marker for a measure of the viral load in the sample [3]. Ct values denote the number of amplification cycles required for the target gene to achieve or exceed a specified threshold level. Ct value is inversely proportional to the viral load and several studies have reported association of lower Ct value with increased probability of progression to severe disease, infectivity and greater transmissibility [4-7].
The antigenic determinants of ABO blood groups have been reported in past to be associated with certain viral infections such as rotavirus, noroviruses (NoVs), dengue virus, Norwalk virus and hepatitis B virus [8-11]. During this ongoing pandemic, researchers have demonstrated linkage of ABO blood group type with COVID-19 infection. Cheng Y et al., showed that individuals with O blood group as compared to non-O blood group ones were less susceptible to infection with SARS-CoV-2 [12]. Zhao J et al., based on the comparison of ABO blood groups of controls from the general population with SARS-CoV-2 infected patients reported a significantly higher risk of the infection in individuals with blood group A and lower risk in blood group O individuals [13]. Similar finding has been reported by Zietz M and Tatonetti NP in a cohort of 7770 SARS-CoV-2 positive cases [14].
Keeping in view the association of susceptibility of SARS-CoV-2 infection with ABO blood group types and Ct value with that of disease severity and infectivity rate, we aimed to assess the relationship between RT-qPCR Ct value for SARS-CoV-2 and ABO blood group type and to determine any blood type dependent difference in viral load. To the best of our knowledge, this is the first study to focus on such an association.
Materials and Methods
A prospective and observational study was carried out at ICMR approved COVID-19 diagnostic facility of Western Maharashtra, India. Convenient sampling was used wherein all consecutive patients admitted to our tertiary care centre between mid-July to mid-August 2020 were recruited for COVID-19 testing and blood grouping. Only patients who were found to be positive for SARS-CoV-2 by RT-qPCR were included in the study. Asymptomatic, non-admitted COVID-19 positive patients were excluded from the study. Samples obtained from all the consecutive admitted patients with COVID-19 helped us to prevent selection bias. This was a pilot study as there is no data on prior studies in Indian settings. The study was approved by the ethical Committee of the institution (IEC/2020/289) and written informed consent was obtained from all the patients.
Nasopharyngeal/Oropharyngeal swabs were collected in Viral Transport Medium (VTM) and were tested for SARS-CoV-2 within 24 hours of collection using commercially available TRUPCR SARS-CoV-2 RT qPCR kit version 2.0 (Cat No. 3B304, Kilpest India Ltd, Bhopal, India) on Light Cycler 480 II (Roche) platform (96 well plates). The samples were reported positive based on the detection of pan-Sarbecovirus E-gene sequence and SARS-CoV-2 specific RdRP gene sequence in accordance with the manufacturer instructions. Ct values for both E and RdRP genes obtained at the time of admission including age and gender of all the patients tested positive for SARS-CoV-2 were recorded. In addition, whole blood venous sample in EDTA vacutainer of all admitted 116 patients were obtained for ABO blood group typing. Records of blood groups of voluntary blood donors aged between 18 to 60 years at our hospital were obtained as control group to reflect the distribution of blood group types in the general population. These records were obtained from September 2019 to November 2019 to avoid inclusion of asymptomatic SARS-CoV-2 positivity. This control group was necessary to study any significant difference in the distribution of blood groups between SARS-CoV-2 positive and negative groups.
Statistical Analysis
The data were expressed as mean and Standard Deviation (SD) of Ct values and were subjected to Welch’s t-test for evaluation of statistical significance of association of Ct value of E and RdRP gene with different blood group types, age groups and gender. Fisher’s-exact test was used for comparison of ABO blood group distribution in SARS-CoV-2 positive patients and Control group. The statistical significance level was set at p<0.05. All statistical computations were performed using GraphPad Prism version 5.00 for Windows, (GraphPad Software, San Diego California USA).
Results
Distribution of ABO Blood Group in SARS-Cov-2 Positive Patients
Of the 116 patients positive for SARS-CoV-2 enrolled in the study, ABO blood group typing revealed that 33 (28.45%) had type A, 34 (29.31%) had type B, 41 (35.34%) were of type O and remaining 08 (6.90%) had AB blood group type. This distribution in COVID-19 patients was compared to control group comprising of 882 non-COVID-19 healthy blood donors. In the control group, type B was the most common followed by type O while type AB was the least common [Table/Fig-1]. The SARS-CoV-2 positive patient group comprised of higher percentages of individuals with type O and was the most common type followed by type B blood group. However, no significant difference was noted in the distribution of ABO blood types between the two groups i.e., SARS-CoV-2 positive and control [Table/Fig-1].
Comparison of ABO blood group distribution in SARS-CoV-2 positive patients and Control group.
| SARS-CoV-2 +ve | Control group | p-value |
|---|
| Total (n) | 116 | 882 | |
| ABO blood group |
| A | 33 (28.45%) | 256 (29.02%) | 0.9841 |
| B | 34 (29.31%) | 266 (30.16%) | 0.9365 |
| AB | 08 (6.90%) | 98 (11.11%) | 0.2206 |
| O | 41 (35.34%) | 262 (29.70%) | 0.2566 |
Fisher’s-exact test was used to calculate p-value (significant level p<0.05)
Cycle Threshold (Ct) Values with Respect to Age, Gender and ABO Blood Group Types in SARS-CoV-2 Positive Patients
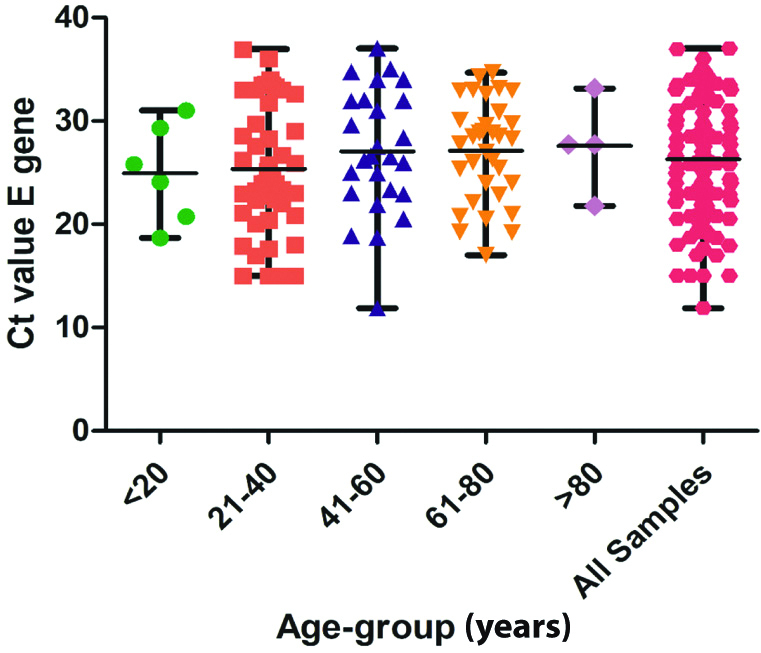
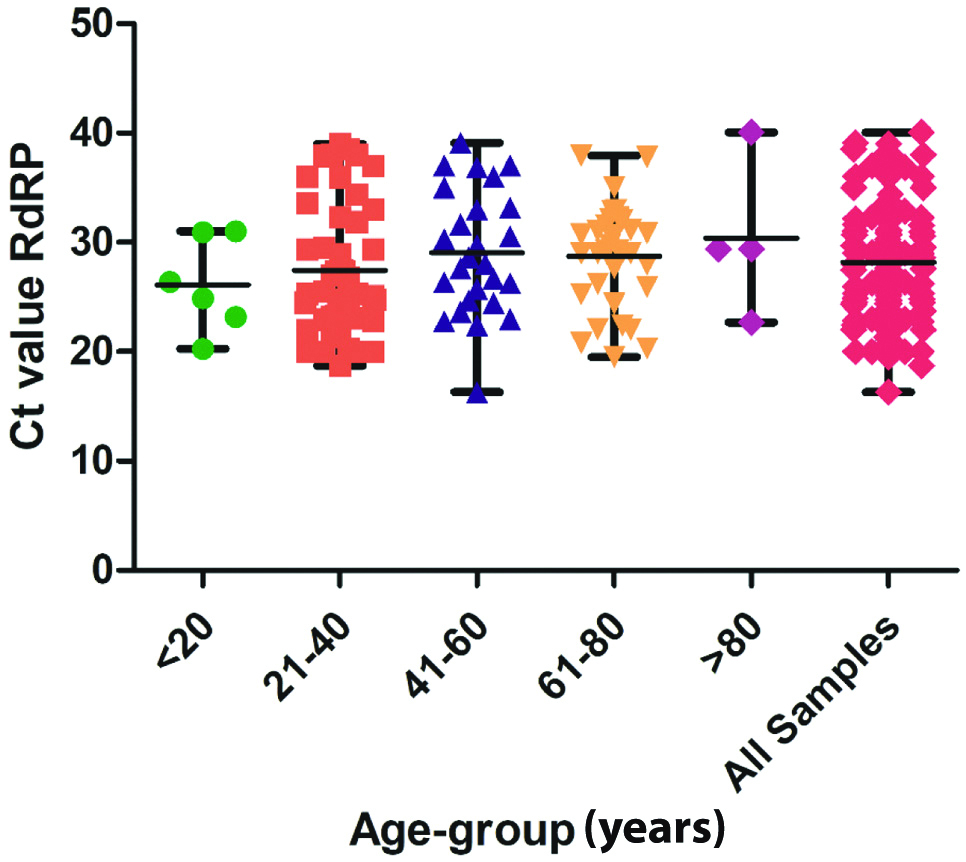
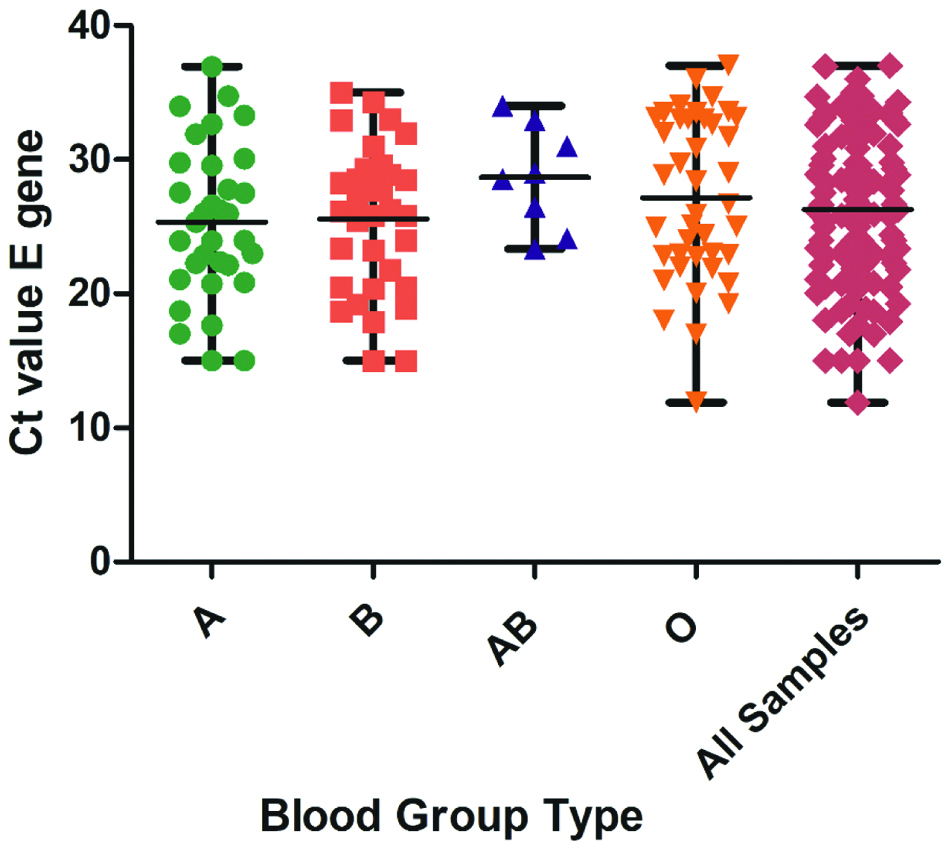
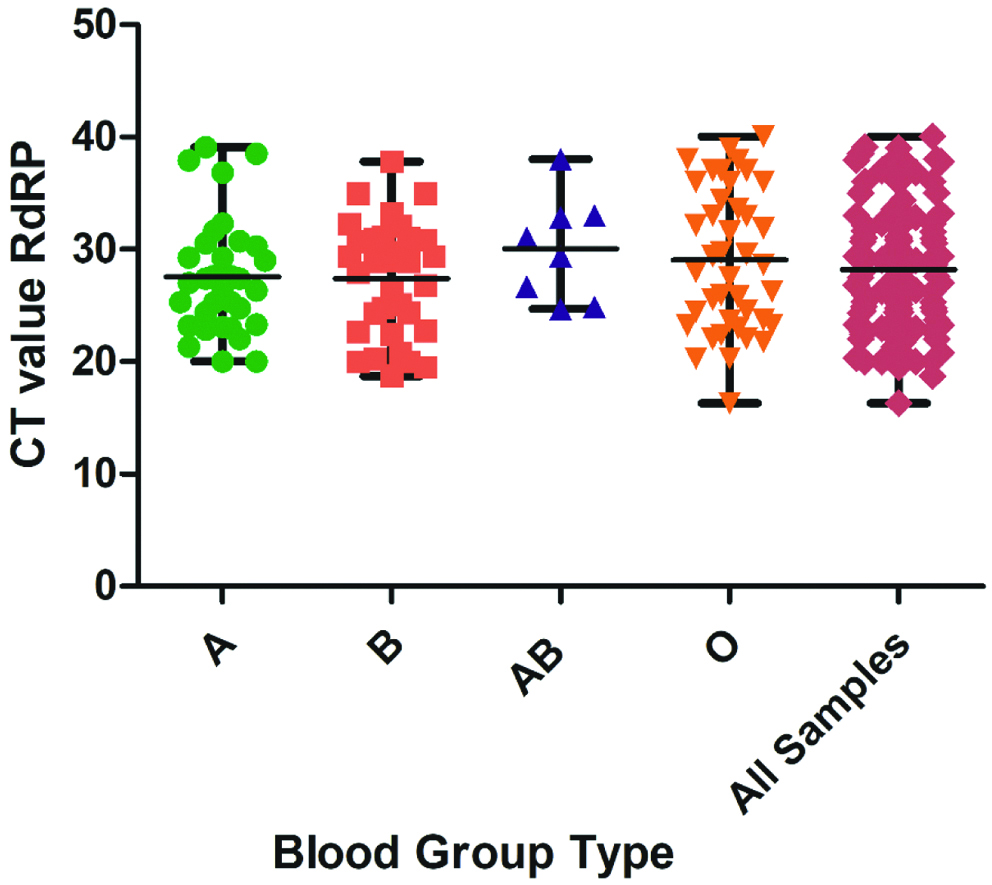
The study cohort comprised of 82 males and 34 females and was categorised into different age groups as shown in [Table/Fig-2]. The mean and SD of Ct values for E and RdRP gene in different age group, gender and ABO blood group types are shown in [Table/Fig-2]. Scatter dot plot of Ct values for both E gene and RdRP gene in different age group are shown in [Table/Fig-3,4], respectively while for that in different blood group types are plotted in [Table/Fig-5,6]. No statistical significance was noted in the Ct values with respect to age, gender and ABO blood group types either within or between the groups.
Cycle threshold (Ct) values of E gene and RdRP gene in SARS-CoV-2 positive patients and its correlation in different age group, gender and ABO blood group types.
| Characteristic | No. of samples | E gene | RdRP gene |
|---|
| Mean | SD | p-value | Mean | SD | p-value |
|---|
| All samples | 116 | 26.29 | 5.65 | - | 28.20 | 5.51 | - |
| Age (years) |
| ≤20 | 06 | 24.95 | 4.77 | 0.7702 | 26.11 | 4.29 | 0.6076 |
| 21-40 | 47 | 25.34 | 6.15 | 0.4641 | 27.44 | 5.96 | 0.4952 |
| 41-60 | 26 | 27.06 | 6.03 | 0.6290 | 29.08 | 5.67 | 0.8061 |
| 61-80 | 33 | 27.11 | 4.83 | 0.3081 | 28.72 | 4.69 | 0.2961 |
| >80 | 04 | 27.59 | 4.64 | 0.8608 | 30.39 | 7.19 | 0.3398 |
| Gender |
| Males | 82 | 26.05 | 5.74 | 0.8499 | 27.84 | 5.46 | 0.9446 |
| Females | 34 | 26.85 | 5.49 | 0.9066 | 29.09 | 5.60 | 0.8661 |
| ABO blood group |
| A | 33 | 25.36 | 5.67 | 0.9373 | 27.54 | 5.13 | 0.6582 |
| B | 34 | 25.59 | 5.36 | 0.7508 | 27.40 | 5.02 | 0.5449 |
| AB | 08 | 28.68 | 3.90 | 0.2980 | 30.06 | 4.60 | 0.6489 |
| O | 41 | 27.15 | 6.06 | 0.5630 | 29.04 | 6.28 | 0.2861 |
SD: Standard deviation
p-values are based on a comparison of mean CT values of each age group, gender and ABO blood group type vs the mean of all Ct values for E gene and RdRP gene using Welch’s t-test
Scatter dot plot with line at mean and range showing comparison of Cycle Threshold (Ct) of E gene by age group.
Scatter dot plot with line at mean and range showing comparison of Cycle Threshold (Ct) of RdRP gene by age group.
Scatter dot plot with line at mean and range showing comparison of Cycle Threshold (Ct) of E gene by ABO blood group type.
Scatter dot plot with line at mean and range showing comparison of Cycle Threshold (Ct) of RdRP gene by ABO blood group type.
Discussion
Blood group antigens are well known to modify the immune response to infection and based on the differences in blood group antigen expression, individuals may be susceptible or protected against certain infections [15]. Few studies mostly originating from China, have demonstrated that patients with blood group A were more susceptible to SARS-CoV-2 infection, whereas patients with blood group O relatively had a lower risk [13,14,16]. Coronavirus is an enveloped virus that targets host cells via viral adhesion glycoproteins. The SARS-CoV spike (S) protein is such a viral adhesion glycoprotein. Guillon P et al., have demonstrated that the natural human anti-A antibodies might block the interaction between SARS-CoV spike protein and its receptor angiotensin-converting enzyme 2, thus providing protection. This could well be explained hy individuals with blood group A with absence of naturally occurring anti-A antibodies tend to be more susceptible to SARS-CoV infection [17].
Several studies on COVID-19 have demonstrated that lower Ct values were associated with more severe disease and infectivity [4-7]. This is in conformity with earlier studies published on Ct values in other respiratory infections such as Middle East Respiratory Syndrome Coronavirus (MERS-CoV) and Respiratory Syncytial virus [18,19]. The association of susceptibility of SARS-CoV-2 infection with ABO blood group types and Ct value with that of disease severity and infectivity rate led us to assess the relationship between RT-qPCR Ct value for SARS-CoV-2 and ABO blood group type and to determine any blood type dependent difference in viral load.
Present study did not showed any association of ABO blood group type with susceptibility to infection by SARS-CoV-2. It also did not reveal any significant difference in Ct values for pan-Sarbecovirus E and SARS-CoV-2 specific RdRP gene in different blood group types. These results were in variance with those reported earlier [4-7,13,14,16]. This variance in the results may be explained based on the differences in the ethnicity of the population studied. There is a definite racial element to ABO blood typing [20,21]. Present study certainly raises a pertinent question on the effects of ethnicity on COVID-19 susceptibility and severity. Moreover, the time from onset of symptoms to sampling varied between patients which could have affected the Ct values.
Unlike the study by Buchan BW et al., where they showed significant correlation of Ct value with age between 80-89 years, present study did not show any significance with different age group. This difference may be attributed to very small number of patients in this group i.e., 4 patients comprising just 3.45% of the total cohort. However, present study result of Ct values showing no statistical significance with gender difference corroborated with that of Buchan BW et al., [22].
Limitation(s)
The main limitation in this study was the small sample size. Moreover, there was a lead time bias as the time from onset of symptoms to sampling differed between patients. The Ct value of SARS-CoV-2 is known to vary during the course of infection and tends to be higher in early symptomatic stage. Additionally, Berksonian bias cannot be ruled out as our study population includes hospitalised patients. However, present centre being a multi-speciality government hospital, people from different strata and socio-economic status were screened for SARS-CoV-2 infection before admission, during current pandemic.
Conclusion(s)
Present study did not find any association of Ct values for SARS-CoV-2 with ABO blood group types. However, the knowledge on COVID-19 is constantly evolving and a wide range in response and course of COVID-19 disease has been noted in different ethnic population. Since there is no published data from India on association of ABO blood group types with susceptibility to SARS-CoV-2 infection and its correlation with Ct values. Therefore, further large-scale studies based on Indian population are needed for more definitive results.
Author Declaration:
Financial or Other Competing Interests: None
Was Ethics Committee Approval obtained for this study? Yes
Was informed consent obtained from the subjects involved in the study? Yes
For any images presented appropriate consent has been obtained from the subjects. NA
Plagiarism Checking Methods: [Jain H et al.]
Plagiarism X-checker: Aug 22, 2020
Manual Googling: Sep 08, 2020
iThenticate Software: Sep 21, 2020 (7%)
[1]. Wiersinga WJ, Rhodes A, Cheng AC, Peacock SJ, Prescott HC, Pathophysiology, transmission, diagnosis, and treatment of Coronavirus Disease 2019 (COVID-19): A ReviewJAMA 2020 324(8):782-93.10.1001/jama.2020.1283932648899 [Google Scholar] [CrossRef] [PubMed]
[2]. WHO. Coronavirus disease (COVID-2019) situation reports. 2020. https://www.who.int/emergencies/diseases/novel-coronavirus-2019/situationreports. Accessed 14 Aug 2020 [Google Scholar]
[3]. Tom MR, Mina MJ, To interpret the SARS-CoV-2 test, consider the cycle threshold valueClin Infect Dis 2020 :ciaa61910.1093/cid/ciaa61932435816 [Google Scholar] [CrossRef] [PubMed]
[4]. Liu Y, Yan LM, Wan L, Xiang T, Li A, Liu JM, Viral dynamics in mild and severe cases of COVID-19Lancet Infect Dis 2020 20:656-57.10.1016/S1473-3099(20)30232-2 [Google Scholar] [CrossRef]
[5]. Liu Y, Liao W, Wan L, Xiang T, Zhang W, Correlation between relative nasopharyngeal virus RNA load and lymphocyte count disease severity in patients with COVID-19Viral Immunol [Internet] 2020 Apr 10 [cited 2020 Aug 17] Available from: https://www.libertpub.com DOI: 10.1089/vim.2020.0062.00 [Epub ahead of print] [Google Scholar]
[6]. Liu YY, Yang Y, Zhang C, Huang F, Wang F, Yuan J, Clinical and biochemical indexes from 2019-nCoV infected patients linked to viral loads and lung injurySci China Life Sci 2020 63:364-74.10.1007/s11427-020-1643-832048163 [Google Scholar] [CrossRef] [PubMed]
[7]. Rao SN, Manissero D, Steele VR, Pareja J, A narrative systematic review of the clinical utility of cycle threshold values in the context of COVID-19Infect Dis Ther 2020 9:573-86.10.1007/s40121-020-00324-332725536 [Google Scholar] [CrossRef] [PubMed]
[8]. Kalayanarooj S, Gibbons RV, Vaughn D, Green S, Nisalak A, Jarman RG, Blood group AB is associated with increased risk for severe dengue disease in secondary infectionsJ Infect Dis 2007 195(7):1014-17.10.1086/51224417330792 [Google Scholar] [CrossRef] [PubMed]
[9]. Hennessy EP, Green AD, Connor MP, Darby R, MacDonald P, Norwalk virus infection and disease is associated with ABO histo-blood group typeJ Infect Dis 2003 188(1):176-77.10.1086/37582912825190 [Google Scholar] [CrossRef] [PubMed]
[10]. Kazi AM, Cortese MM, Yu Y, Lopman B, Morrow AL, Fleming JA, Secretor and salivary ABO blood group antigen status predict rotavirus vaccine take in infantsJ Infect Dis 2017 215(5):786-89.10.1093/infdis/jix02828329092 [Google Scholar] [CrossRef] [PubMed]
[11]. Liu J, Zhang S, Liu M, Wang Q, Shen H, Zhang Y, Distribution of ABO/Rh blood groups and their association with hepatitis B virus infection in 3.8 million Chinese adults: A population-based cross-sectional studyJ Viral Hepat 2018 25(4):401-11.10.1111/jvh.1282929193618 [Google Scholar] [CrossRef] [PubMed]
[12]. Cheng Y, Cheng G, Chui CH, Lau FY, Chan PKS, Ng MHL, ABO blood group and susceptibility to severe acute respiratory syndromeJAMA 2005 293(12):1450-51.10.1001/jama.293.12.1450-c [Google Scholar] [CrossRef]
[13]. Zhao J, Yang Y, Huang HP, Li D, Gu D, Lu X, Relationship between the ABO blood group and the COVID-19 susceptibilitymedRxiv [Internet] 2020 Mar 27 [cited 2020 Aug 17] Available from: https://www.medrxiv.org/content/10.1101/2020.03.11.20031096v2. [Epub ahead of print]10.1101/2020.03.11.20031096 [Google Scholar] [CrossRef]
[14]. Zietz M, Tatonetti NP, Testing the association between blood type and COVID-19 infection, intubation, and deathmedRxiv [Internet] 2020 Apr 11 [cited 2020 Aug 17] Available from: https://www.medrxiv.org/content/10.1101/2020.04.08.20058073v2. [Epub ahead of print]10.1101/2020.04.08.20058073 [Google Scholar] [CrossRef]
[15]. Cooling L, Blood groups in infection and host susceptibilityClin Microbiol Rev 2015 28(3):801-70.10.1128/CMR.00109-1426085552 [Google Scholar] [CrossRef] [PubMed]
[16]. Wu Y, Feng Z, Li P, Yu Q, Relationship between ABO blood group distribution and clinical characteristics in patients with COVID-19Clinica Chimica Acta 2020 509:220-23.10.1016/j.cca.2020.06.02632562665 [Google Scholar] [CrossRef] [PubMed]
[17]. Guillon P, Clément M, Sébille V, Rivain JG, Chou CF, Ruvoën-Clouet N, Inhibition of the interaction between the SARS-CoV spike protein and its cellular receptor by anti-histo-blood group antibodiesGlycobiology 2008 18(12):1085-93.10.1093/glycob/cwn09318818423 [Google Scholar] [CrossRef] [PubMed]
[18]. Feikin DR, Alraddadi B, Qutub M, Shabouni O, Curns A, Oboho IK, Association of higher MERS-CoV virus load with severe disease and death, Saudi Arabia, 2014Emerg Infect Dis 2015 21:2029-35.10.3201/eid2111.15076426488195 [Google Scholar] [CrossRef] [PubMed]
[19]. Wishaupt JO, Ploeg TV, Smeets LC, Groot R, Versteegh FG, Hartwig NG, Pitfalls in interpretation of CT-values of RT-PCR in children with acute respiratory tract infectionsJ Clin Virol 2017 90:01-06.10.1016/j.jcv.2017.02.01028259567 [Google Scholar] [CrossRef] [PubMed]
[20]. Liu J, Zhang S, Wang Q, Shen H, Zhang Y, Liu M, Frequencies and ethnic distribution of ABO and RhD blood groups in China: A population-based cross-sectional studyBMJ Open 2017 7(12):e01847610.1136/bmjopen-2017-01847629203504 [Google Scholar] [CrossRef] [PubMed]
[21]. Garratty G, Glynn SA, McEntire R, ABO and Rh (D) phenotype frequencies of different racial/ethnic groups in the United StatesTransfusion 2004 44(5):703-06.10.1111/j.1537-2995.2004.03338.x15104651 [Google Scholar] [CrossRef] [PubMed]
[22]. Buchan BW, Hoff JS, Gmehlin CG, Perez A, Faron ML, Price LSM, Distribution of SARS-CoV-2 PCR cycle threshold values provide practical insight into overall and target-specific sensitivity among symptomatic patientsAm J Clin Pathol 2020 154(4):479-85.10.1093/ajcp/aqaa13332687186 [Google Scholar] [CrossRef] [PubMed]