Specular microscopy is a non invasive photographic technique that allows us to visualise and analyse the corneal endothelium. Modern specular microscopes analyses the size, shape and density of the endothelial cells. The instrument projects light onto the cornea and captures the image that is reflected from the optical interface between the corneal endothelium and the aqueous humor. The reflected image is analysed by the instrument and displayed as a specular photomicrograph. With specular microscopy, the corneal endothelium appears as a somewhat regular array of cells of the endothelial mosaic. In this mosaic configuration, all of the endothelial cells appear to be approximately the same size and shape [10]. In a normal endothelium, more than 60% of the endothelial cells are hexagonal. The size and shape of the endothelial cells is important because adjacent cells with similar dimensions best maintain the fluid barrier function of the endothelium [11].
Phacoemulsification surgery is performed in a limited, confined space. So during the surgery mechanical and thermal damage to the endothelium can occur because of close proximity. Pirazzoli G et al., found that, phacoemulsification was associated with 16.67% ECL correlating with the degree of trauma during surgery [12]. Preoperative parameters that influence ECL are older age, firmness of the nucleus and shorter Axial Length (AL) [12,13]. Intraoperative factors include the incision size and design, descemet membrane detachment, toxic intraoperative medications, phacoemulsification technique, and the type of Ophthalmic Viscosurgical Device (OVD) used [12-14].
During surgery, the phaco machine keeps track of the average phaco power, given as a percentage of maximum, as well as the total time during which phaco ultrasonic power delivered. The machine displays these settings. The total energy delivered into the eye is the product of the phaco power multiplied by the time the power is on, known as the Absolute Phaco Time (APT). The phaco machine automatically calculate the APT by multiplying the average phaco power by the phaco time so that the surgeon can compare the total ultrasonic energy delivered in different cases [15].
The purpose of the present study was to compare the variation in corneal endothelial cell density and corneal thickness with respect to variations in effective phaco time with constant power used in phacoemulsification surgery by the phaco-chop and divide and conquer techniques in various grades of cataract.
Materials and Methods
The present study was carried out in the Department of Ophthalmology at Acharya Vinoba Bhave Rural Hospital attached to Jawaharlal Nehru Medical College, Sawangi (Meghe) Wardha, a constituent college of Datta Meghe Institute of Medical Sciences (Deemed University), Nagpur. It was a rural hospital based randomised, prospective, comparative study of cataract patients attending eye OPD and referral from other departments OPD and indoor patients. The study was done from October 2018-April 2019 on 100 eyes of 100 patients.
Sample Size Calculation
Sample size calculation was done using the following formula:
N=Zα/2 2*p*(1-p)
d2
Where,
Zα/2=Level of significance at 5% i.e., 95% confidence interval=1.96
P=Prevalence of ECL=5%=0.05 10
d=Desired error of margin=6%=0.06
n=1.962*0.05*(1-0.05)0.062=50.68
Hence, 50 patients were required in each group.
The patients were randomised in two groups:
Group A included 50 eyes of 50 patients who underwent Phacoemulsification by ‘Divide and conquer’ technique with implantation of foldable lens, single piece hydrophilic acrylic lens.
Group B includes 50 eyes of 50 patients who underwent Phacoemulsification by ‘Phaco-chop’ technique with implantation of foldable lens, single piece hydrophilic acrylic lens.
During surgery the total phaco time (s) and the phaco power (%) for each case was documented for the calculation of APT. The two groups were then compared in terms of APT, change in preoperative and postoperative ECC, CCT and visual outcome on their first postoperative day, first postoperative week and sixth week.
Inclusion criteria:
Patient having senile cataract as diagnosed by slit lamp microscopy and distant direct ophthalmoscopy with nuclear sclerosis grade 1 to 4.
Patients without any history of ocular pathology and surgery.
Patients must be accessible and willing for follow-up.
Age group: 50-70 years.
Exclusion criteria:
Patients with additional visual comorbidity which may influence the visual outcome after surgery, viz., glaucoma, corneal and retinal pathologies.
Patients with nuclear sclerosis grade 5, mature cataract, traumatic, subluxated or complicated cataracts.
Systemic pathologies affecting visual outcome, viz., hypertensive retinopathy and diabetic retinopathy.
Cataract with pseudoexfoliation or posterior synechaie causing small pupil.
Patient not giving consent.
Any intraoperative or postoperative complications.
CCT <500 microns and >575 microns.
Endothelial count less than 1500 cells/mm2.
Ethical considerations: The study was approved by the Institutional Ethics Committee of the University and was carried out in accordance with the Declaration of Helsinki. The ethical clearance number was DMIMSU/IEC/2018-19/7895.
Informed consent was obtained from all patients. Preoperative ocular assessment included: uncorrected visual acuity, sit lamp biomicroscopy, applanation tonometer, fundus examination, ultrasonic biometry to determine the power of the posterior chamber IOL, non contact specular microscopy and pachymetry (using topcon SP 1P).
Preoperative Preparation
All the patients were given antibiotic eye drops preoperatively. Test for xylocaine sensitivity was done in each case preoperatively in the ward. Injection TT 0.5 mg was given intramuscularly in each case. The Operating eye was dilated with Topical Tropicamide 0.8% with phenylephrine 5%.
Anaesthesia
A peribulbar anaesthesia of 5 mL injection of xylocaine 2% with 1:200000 adrenaline with one ampule (150 USP units) of hyaluronidase was given. All surgeries were performed by the single surgeon.
Intervention
The surgical technique was the same in all cases except in step of nucleus fracturing:
Two clear corneal side port incisions were made using 15 degrees Lance tip at 3’o clock and 9’o clock
Anterior capsule was stained with trypan blue dye
Anterior chamber wash was given
AC filled with viscoelastic material
A 6 mm Continuous Curvilinear Capsulorrhexis was performed in a closed chamber with self-made bent 26 gauge needle (cystitome) through the side port.
Sodium hyaluronate 1.0% was then injected to fill the anterior chamber.
A superior self-sealing clear biplane corneal incision was done using 2.8 mm disposable metal keratome.
Hydrodissection and hydrodelineation was performed by injecting BSS through a 27 gauge cannula separating the cortex and epinucleus of the lens from the hard core nucleus, till it can be rotated freely clockwise or counter-clockwise in the bag.
AC filled with visco-elastic material
Nuclear fracturing technique was different for each group (group A- divide and conquer, group B: phaco-chop technique).
The parameters were same for both the techniques.
Phaco 1 was used for sculpting (maximum 50% continuous mode ultrasound (US) power, vacuum 40 mm Hg, flow rate 30-40 cc/min and bottle height 90-110 cm); and
Phaco 2 was used for quadrant removal (maximum 50% multi-burst mode (US) power, maximum vacuum 320 mm Hg, flow rate 25-30 cc/min and bottle height 90-110 cm).
Nuclear fracturing technique was different for each group as following:
Group A- Divide and Conquer
By phaco 1, aspiration of the superficial cortex and epinucleus done
A vertical groove, trench, about two tip widths wide from 12 to 6 o’clock positions was created
The groove was deepened especially at the centre until the red reflex was seen through it
The nucleus was rotated 90 degree by the phaco probe assisted by a sinskey hook dialer introduced from the side port
Another trench cross-hatched across the first one was carved to make a ‘plus sign’
A sinskey hook and a chopper were used to divide the nucleus into four separate quadrants
Then quadrants removed with phaco parameters were those of phaco 2
The quadrants were engaged by the phaco probe, brought to the centre of the capsular bag and emulsified at the pupillary plane
Chopping and quadrant removal was repeated in the same way as for the first heminucleus
Group B- Phaco-chop
Using the phaco 1, the superficial cortex and epinucleus were aspirated
A vertical groove, trench was made sufficient enough to see the fundal glow
The nucleus was then divided into two halves using phaco probe and nagahara chopper
The phaco tip was then buried in the centre of the endonucleus and the Nagahara phaco chopper was brought through the side-port incision and the equator of endonucleus was engaged by the chopper under the capsulorrhexis
The chopper was moved toward the phaco probe to initiate nuclear cracking and the phaco tip impaled in the inferior hemisection of the nucleus and the chopper was used to break this half into two smaller fragments, which were then emulsified
The procedure was repeated on the second half of nucleus
The residual cortex was aspirated using a Simcoe’s 2-way irrigation and aspiration cannula
Sodium hyaluronate was injected into the anterior chamber to inflate the capsular bag.
Implantation of a foldable hydrophilic acrylic IOL was done.
The remaining visco-elastic material was aspirated; AC reformed with BSS and side port was hydrated.
Eye pad given.
The following were reported during the surgery: The total phaco time (seconds), the mean phaco power (%) and the total phaco energy (the absolute phaco time=APT) was calculated by multiplying the phaco time (seconds) by the mean phaco power (%).
APT=phaco time X average phaco power
Postoperative Follow-up
All the subjects were followed for a period of one and half months. Each subject was followed-up postoperatively on first day, first postoperative week and sixth week.
At each of the follow-up, patient was examined for:
Uncorrected visual acuity by Snellen’s chart or Landolt C chart in illiterate patients
Slit lamp examination for any anterior chamber reaction, wound sealing, corneal clarity and IOLs placing and slit lamp biomicroscopy
Corneal specular microscopy to study endothelial cell changes and CCT
ECL was then calculated as following:
ECL %=(difference between postoperative and preoperative cell densities/preoperative cell density)×100.
Statistical Analysis
All data were analysed with the assistance of biostatistician, Department of Community Medicine, Jawaharlal Nehru Medical College, Sawangi, Wardha. All numerical patient data will be entered in a Microsoft Excel spreadsheet. Statistical analysis was done by using descriptive and inferential statistics using chi-square test and student’s unpaired t-test and software used in the analysis was SPSS 22.0 version and Graph Pad Prism 6.0 version and p<0.05 was considered as level of significance.
Results
The present study included 100 eyes of 100 patients divided randomly into two groups. Each group included 50 eyes: in group A Divide and conquer technique was performed and in the group B Phaco-chop technique was performed.
Demographic profile: In the present study, the mean age of the patients in group A was 59.72±5.75 years, and in group B it was 60.58±5.89 years.
Overall 54(54%) patients were male and 46(46%) patients were females in the two groups.
Male: Female ratio was 1.2:1
Nucleus Grade [Table/Fig-1]
Distribution of patients according to grade of nucleus in two groups.
| Grade of cataract | Group A (Divide and conquer) (n=50) | Group B (Phaco-Chop) (n=50) | Total |
|---|
| Number of patients | % | Number of patients | % | Number of patients | % |
|---|
| Nuclear sclerosis grade 3 | 2 | 4 | 3 | 6 | 5 | 5 |
| NS1+PSC | 2 | 4 | 4 | 8 | 6 | 6 |
| NS2+PSC | 15 | 30 | 13 | 26 | 28 | 28 |
| NS3+PSC | 5 | 10 | 3 | 6 | 8 | 8 |
| NS2+PSC+CC | 17 | 34 | 18 | 36 | 35 | 35 |
| NS3+PSC+CC | 4 | 8 | 2 | 4 | 6 | 6 |
| NS2+CC | 2 | 4 | 5 | 10 | 7 | 7 |
| NS3+CC | 3 | 6 | 2 | 4 | 5 | 5 |
| Total | 50 | 100 | 50 | 100 | 100 | 100 |
| χ2-value | 7.04p-value=0.42,NS, p>0.05 |
PSC: Posterior sub capsular cataract; NS: Nuclear sclerosis; CC: Cortical cataract
An evaluation of grade of cataract revealed that, out of 50 cases in Divide and conquer group maximum of the cases that is 17 (34%) had nuclear sclerosis grade 2 with posterior subcapsular cataract with cortical cataract followed by 15 (30%) patients having nuclear sclerosis grade 2 along with posterior subcapsular cataract. Then, 5 (10%) patients had nuclear sclerosis grade 3 with posterior subcapsular cataract. Four (8%) patients had nuclear sclerosis grade 3 along with posterior subcapsular cataract and cortical cataract and 3 (6%) had nuclear sclerosis grade 3 with cortical cataract, followed by 2 (4%) patients having nuclear sclerosis grade 2 with cortical cataract, nuclear sclerosis grade 3 and nuclear sclerosis Grade 1 with posterior subcapsular cataract each. None of the patient had nuclear sclerosis grade 1, nuclear sclerosis grade 2, nuclear sclerosis grade 4, nuclear sclerosis grade 1 with posterior subcapsular cataract and cortical cataract, nuclear sclerosis with cortical cataract.
Out of 50 cases in Phaco-chop technique group, maximum of the cases that is 18 (36%) had nuclear sclerosis grade 2 along with posterior subcapsular cataract and cortical cataract followed by 13 (26%) patients having nuclear sclerosis grade 2 along with posterior subcapsular cataract. Then, 5 (10%) patients had nuclear sclerosis grade 2 with cortical cataract. Followed by 4 (8%) patients having nuclear sclerosis grade 1 with posterior subcapsular cataract. Whereas, 3 (6%) patients had nuclear sclerosis grade 3 and nuclear sclerosis Grade 3 with posterior subcapsular cataract each. And 2 (4%) patients had nuclear sclerosis grade 3 with posterior subcapsular cataract and cortical cataract and nuclear sclerosis grade 3 with cortical cataract each.
By using chi-square test, χ2-value was 7.04, p-value-0.42, there was no significant difference between the two groups.
Preoperative Visual Acuity [Table/Fig-2]
Distribution of Preoperative Unaided Visual Acuity in two groups.
| Preoperative unaided visual acuity | Group A (Divide and conquer) (n=50) | Group B (Phaco-Chop) (n=50) | Total |
|---|
| Number of patients | % | Number of patients | % | Number of patients | % |
|---|
| 6/12-6/18 | 7 | 14 | 4 | 8 | 11 | 11 |
| 6/24-6/36 | 14 | 28 | 12 | 24 | 26 | 26 |
| 6/60-CF1/2 meter | 29 | 58 | 34 | 68 | 63 | 63 |
| PL+ PR Accurate | 0 | 0 | 0 | 0 | 0 | 0 |
| Total | 50 | 100 | 50 | 100 | 50 | 100 |
| χ2-value | 1.36p-value=0.50, NS |
In group A, out of 50 cases, maximum of the patients that is 29 (58%) had preoperative visual acuity in the range of 6/60-CF ½ metre and in group B, it was 34 (68%).
Preoperative Endothelial Cell Count (ECC)
The mean ECC in group A was 2508.66±315.99 and in group B it was 2584.88±305.94 preoperatively (p>0.05) [Table/Fig-3].
Distribution of Preoperative Endothelial Cell Count (ECC) in two groups.
| Preoperative Endothelial Cell Count (ECC) (Cell/mm2) | Group A (Divide and conquer) (n=50) | Group B (Phaco-Chop) (n=50) | χ2-value |
|---|
| Number of eyes | % | Number of eyes | % |
|---|
| 1500-2000 | 3 | 6 | 4 | 8 | 1.13p-value=0.56,NS |
| 2001-2500 | 20 | 40 | 15 | 30 |
| 2501-3000 | 27 | 54 | 31 | 62 |
| Total | 50 | 100 | 50 | 100 |
| Mean±SD | 2508.66±315.99 | 2584.88±305.94 |
Preoperative CCT
The mean CCT in group A was 515.98±19.98 and in group B it was 506.90±35.12 (p>0.05) [Table/Fig-4].
Distribution of Preoperative Central Corneal Thickness (CCT) in two groups.
| Preoperative CCT (Microns) | Group A (Divide and conquer) (n=50) | Group B (Phaco-Chop) (n=50) | χ2-value |
|---|
| Number of eyes | % | Number of eyes | % |
|---|
| 500-525 | 17 | 34 | 13 | 26 | 11.33p-value =0.33,NS |
| 526-550 | 23 | 46 | 29 | 58 |
| 551-575 | 10 | 20 | 8 | 16 |
| Total | 50 | 100 | 50 | 100 |
| Mean±SD | 515.98±19.98 | 506.90±35.12 |
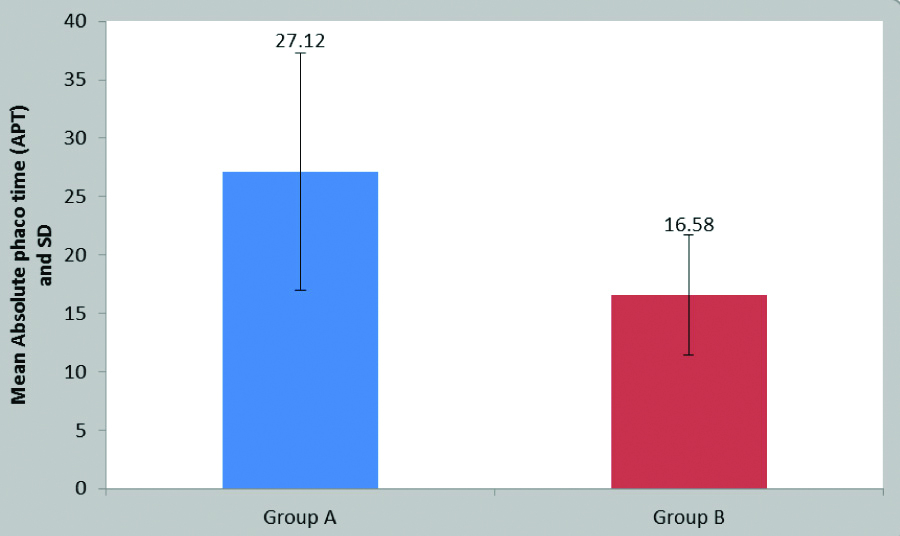
Absolute Phaco Time
The mean APT in group A was 27.12±10.15. and 16.58±5.11 in group B (p=0.0001) [Table/Fig-5a,b]
Mean Absolute Phaco Time (APT) in two groups.
| Absolute Phaco Time (APT) (Seconds) | Group A (Divide and conquer) (n=50) | Group B (Phaco-Chop) (n=50) |
|---|
| Mean | 27.12 | 16.58 |
| Std. deviation | 10.15 | 5.11 |
| Std. error mean | 1.43 | 0.72 |
| t-value | 6.55, p-value=0.0001,S |
Distribution of Absolute Phaco Time (APT) in two groups.
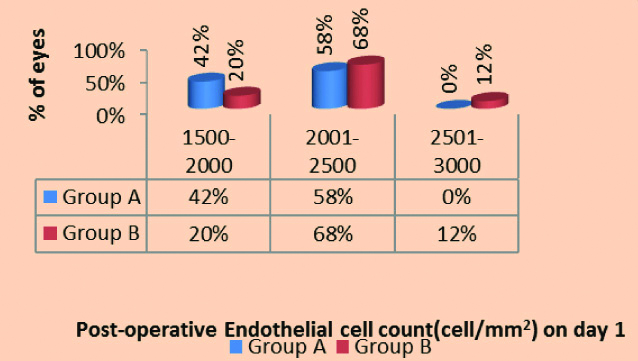
Postoperative Endothelial Cell Count (ECC) on Day 1, First week and Sixth week
On postoperative day 1, the mean ECC in group A was 2020.85±252.66 and in group B was 2200.26±265.03 (p-value=0.0058) [Table/Fig 6-a,b].
Distribution of Postoperative Endothelial cell count (ECC) in two groups on Day 1.
| Postoperative Endothelial Cell Count (ECC) (Cell/mm2) on day 1 | Group A (Divide and conquer) | Group B (Phaco-Chop) | χ2-value |
|---|
| Number of eyes | % | Number of eyes | % |
|---|
| 1500-2000 | 21 | 42 | 10 | 20 | 10.30, p-value=0.0058, S |
| 2001-2500 | 29 | 58 | 34 | 68 |
| 2501-3000 | 0 | 0 | 6 | 12 |
| Total | 50 | 100 | 50 | 100 |
| Mean±SD | 2020.85±252.66 | 2200.26±265.03 |
Distribution of Postoperative Endothelial cell count (ECC) in two groups on Day 1.
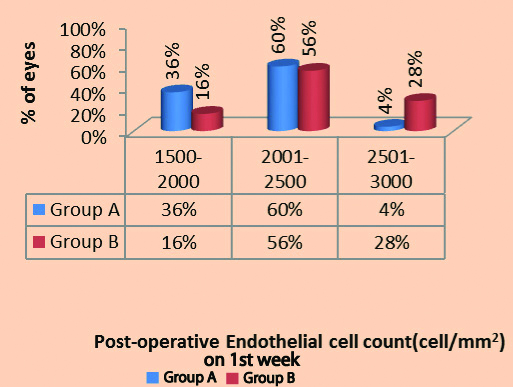
Similarly on postoperative first week, in group A was 2062.78±260.54 and in group B was 2324.20±276.11. (p-value=0.0016) [Table/Fig-6c,d].
Distribution of Postoperative Endothelial Cell Count (ECC) in two groups on first week.
| Postoperative Endothelial Cell Count (ECC) (Cell/mm2) on first week | Group A (Divide and conquer) (n=50) | Group B (Phaco-Chop) (n=50) | χ2-value |
|---|
| Number of eyes | % | Number of eyes | % |
|---|
| 1500-2000 | 18 | 36 | 8 | 16 | 12.92p-value=0.0016, S |
| 2001-2500 | 30 | 60 | 28 | 56 |
| 2501-3000 | 2 | 4 | 14 | 28 |
| Total | 50 | 100 | 50 | 100 |
| Mean±SD | 2062.78±260.54 | 2324.20±276.11 |
Distribution of Postoperative Endothelial cell count (ECC) in two groups on first week.
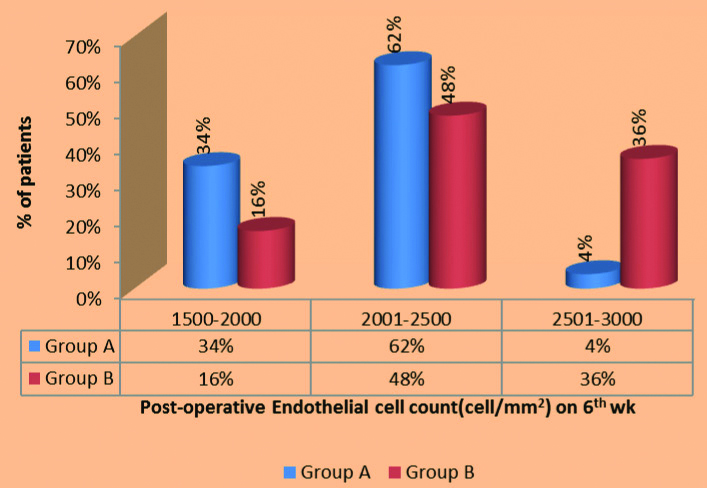
On postoperative sixth week, it was 2102.14±264.37 in group A and in group B was 2365.38±265.94 (p-value=0.003) [Table/Fig-6e,f].
Distribution of postoperative Endothelial Cell Count (ECC) in two groups on sixth week.
| Postoperative Endothelial Cell Count (ECC) (Cell/mm2) on sixth week | Group A (Divide and conquer) (n=50) | Group B (Phaco-Chop) (n=50) | χ2-value |
|---|
| Number of eyes | % | Number of eyes | % |
|---|
| 1500-2000 | 17 | 34 | 8 | 16 | 16.93, p-value=0.0003, S |
| 2001-2500 | 31 | 62 | 24 | 48 |
| 2501-3000 | 2 | 4 | 18 | 36 |
| Total | 50 | 100 | 50 | 100 |
| Mean±SD | 2102.14±264.37 | 2365.38±265.94 |
Distribution of postoperative Endothelial cell count (ECC) in two groups on sixth week.
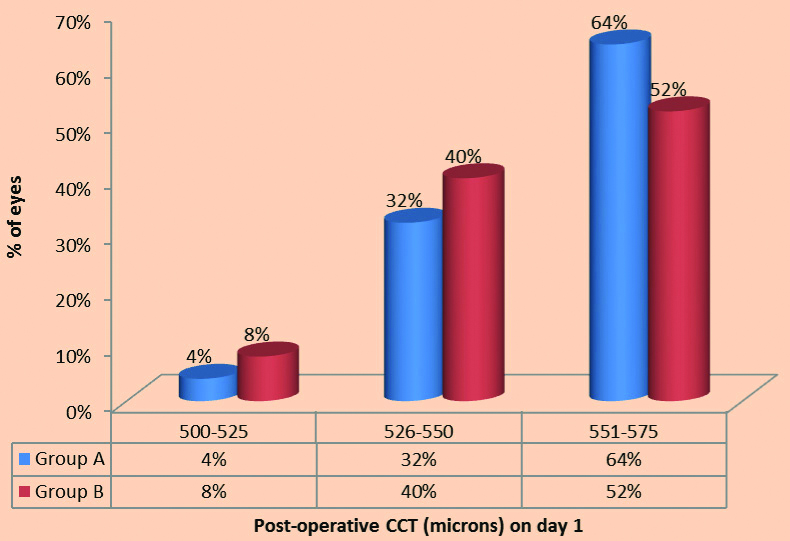
Postoperative Central Corneal Thickness (CCT) on Day 1, First week and Sixth week.
On day 1, the mean postoperative CCT in group A was 543.98±20.97 and in group B it was 525.24±36.30 [Table/Fig-7a,b].
Distribution of postoperative Central Corneal Thickness (CCT) on day 1.
| Postoperative Central Corneal Thickness (CCT) (Microns) on day 1 | Group A (Divide and conquer) (n=50) | Group B (Phaco-Chop) (n=50) | χ2-value |
|---|
| Number of eyes | % | Number of eyes | % |
|---|
| 500-525 | 2 | 4 | 4 | 8 | 21.70, p-value= 0.0072, S |
| 526-550 | 16 | 32 | 20 | 40 |
| 551-575 | 32 | 64 | 26 | 52 |
| Total | 50 | 100 | 50 | 100 |
| Mean±SD | 543.98±20.97 | 525.24±36.30 |
Distribution of postoperative Central Corneal Thickness (CCT) on day 1.
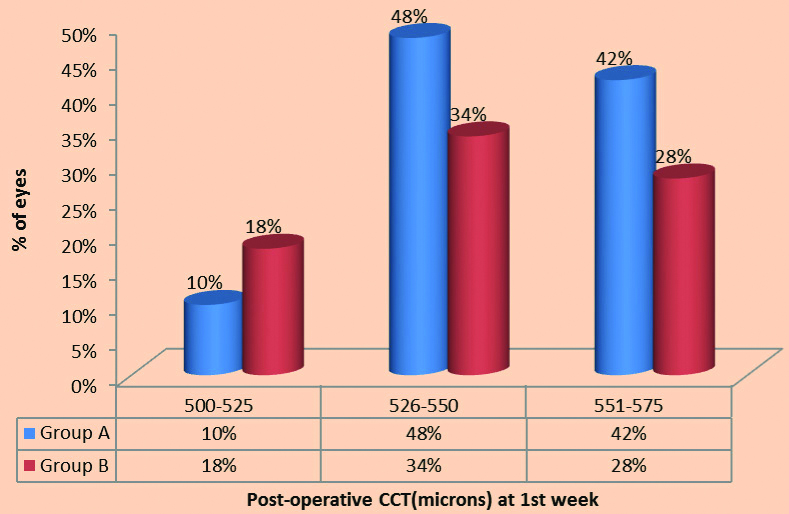
At first week, group A it was 532.26±20.63 and in group B it was 518.72±36.09 [Table/Fig-7-c,d].
Distribution of postoperative Central Corneal Thickness (CCT) on first week.
| Postoperative Central Corneal Thickness (CCT) (Microns) on first week | Group A (Divide and conquer) (n=50) | Group B (Phaco-Chop) (n=50) | χ2-value |
|---|
| Number of eyes | % | Number of eyes | % |
|---|
| 500-525 | 5 | 10 | 9 | 18 | 24.38, p-value=0.018, S |
| 526-550 | 24 | 48 | 27 | 34 |
| 551-575 | 21 | 42 | 14 | 28 |
| Total | 50 | 100 | 50 | 100 |
| Mean±SD | 532.26±20.63 | 518.72±36.09 |
Distribution of Postoperative Central Corneal Thickness (CCT) on first week.
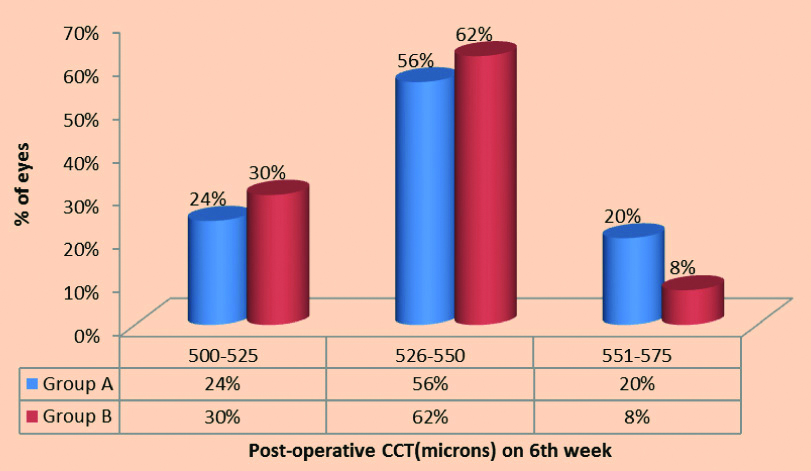
At sixth week, in group A was 523.44±20.31 and in group B it was 512.56±35.64. [Table/Fig-7-e,f]
Distribution of Postoperative Central Corneal Thickness (CCT) on sixth week.
| Postoperative Central Corneal Thickness (CCT) (Microns) on sixth week | Group A (Divide and conquer) (n=50) | Group B (Phaco-Chop) (n=50) | χ2-value |
|---|
| Number of eyes | % | Number of eyes | % |
|---|
| 500-525 | 12 | 24 | 15 | 30 | 10.29p-value= 0.040, S |
| 526-550 | 28 | 56 | 31 | 62 |
| 551-575 | 10 | 20 | 4 | 8 |
| Total | 50 | 100 | 50 | 100 |
| Mean±SD | 523.44±20.31 | 512.56±35.64 |
Distribution of Postoperative Central Corneal Thickness (CCT) on sixth week.
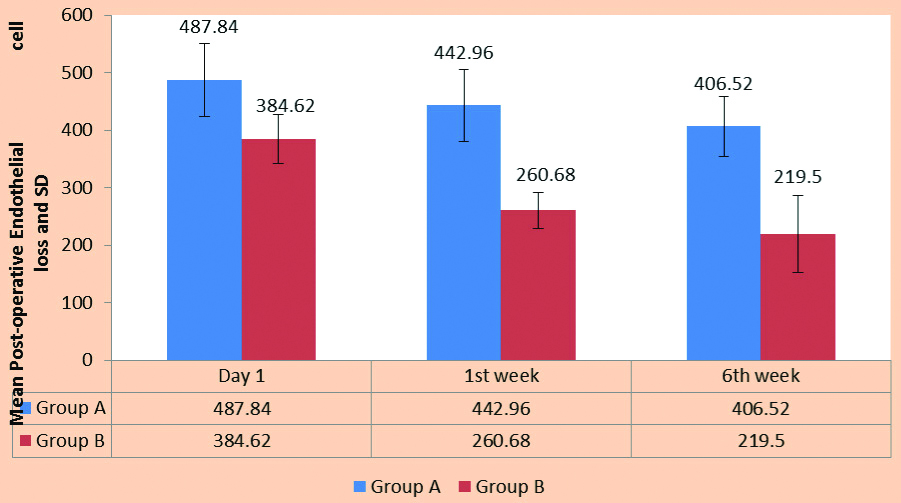
Postoperative mean Endothelial Cell Loss (ECL) in two groups on day 1, First week and Sixth week.
The mean postoperative ECC at sixth week in group A was 2102.14±264.37 and the cell loss was 406.52±52.27 cells/mm2 and in group B it was 2365.38±265.94 and the cell loss was 219.50±66.47 cells/mm2 [Table/Fig-8-a,b].
Postoperative mean Endothelial cell loss (ECL) in two groups on day 1, first week and sixth week.
| Mean preoperative Endothelial Cell Count (ECC) | Mean postoperative Endothelial Cell loss (ECL) |
|---|
| Day 1 | First week | Sixth week |
|---|
| Mean | Loss of ECC | Mean | Loss of ECC | Mean | Loss of ECC |
|---|
| Group A (Divide and conquer) | 2508.66±315.99 | 2020.85±252.66 | 487.81±63.55 | 2062.78±260.54 | 442.96±63.14 | 2102.14±264.37 | 406.52±52.27 |
| Group B (phaco-chop) | 2584.88±305.94 | 2200.26±265.03 | 384.62±42.90 | 2324.20±276.11 | 260.68±30.94 | 2365.38±265.94 | 219.50±66.47 |
| t-value | 1.22 | 9.51 | 18.32 | 15.63 |
| p-value | 0.22,NS | 0.0001,S | 0.0001,S | 0.0001,S |
Postoperative mean Endothelial Cell Loss (ECL) in two groups on day 1, first week and sixth week.
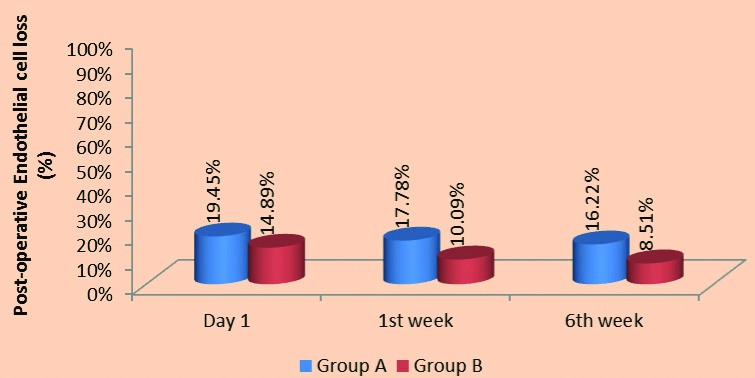
Postoperative Endothelial Cell Loss (ECL) (%) in two groups on Day 1, First week, Sixth week.
On postoperative day 1 there was 19.45% ECL in group A, whereas it was 14.89% in group B.
The cell loss reduced on first week. There was 17.78% cell loss in group A, whereas it was 10.09% in group B.
On sixth week the ECL was 16.22% in group A and 8.51% in group B [Table/Fig-8c,d].
Postoperative Endothelial Cell Loss (ECL) (%) in two groups on day 1, first week, sixth week.
| Follow-up | Group A (Divide and conquer) | Group B (Phaco-Chop) |
|---|
| % Cell loss | t-value | % Cell loss | t-value |
|---|
| Day 1 | 19.45% | 55.55, p=0.0001, S | 14.89% | 58.70, p=0.0001,S |
| First week | 17.78% | 56.85, p=0.0001, S | 10.09% | 59.52, p=0.0001,S |
| Sixth week | 16.22% | 56.22, p=0.0001, S | 8.51% | 62.88, p=0.0001,S |
Postoperative Endothelial Cell Loss (ECL) (%) in two groups on day 1, first week, sixth week.
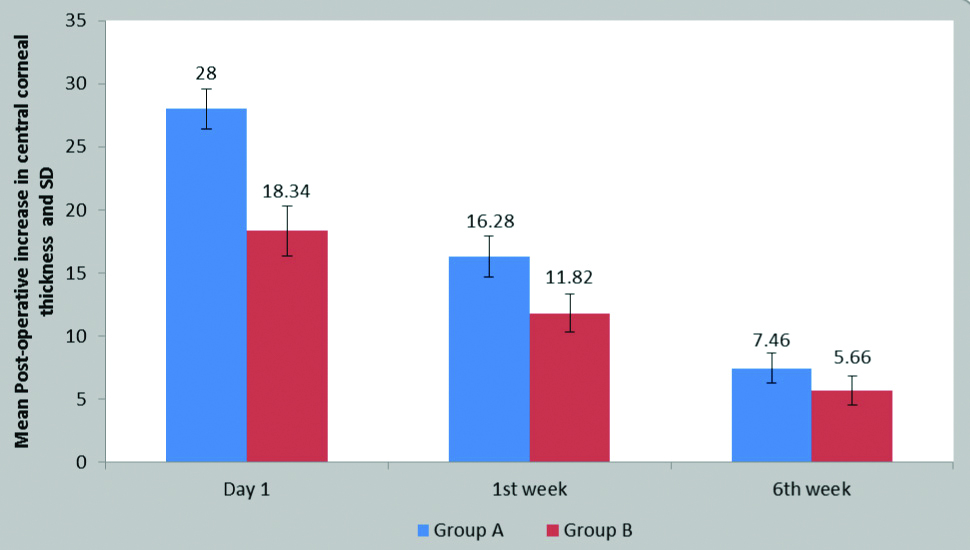
Postoperative increase in Central Corneal Thickness (CCT) on Day 1, First week and Sixth week
The mean postoperative CCT on day 1 in group A was 543.98±20.97, the mean increase was 28±1.59 and in group B it was 525.24±36.30 and the mean increase was 18.34±1.99 (p-value=0.0001).
On first week in group A was 532.26±20.63, the mean increase was 16.28±1.62 and in group B it was 518.72±36.09 and the mean increase was 11.82±1.48 (p-value=0.0001).
On sixth week in the group A was 523.44±20.31, the mean increase was 7.46±1.16 and in group B it was 512.56±35.64 and the mean increase was 5.66±1.17 (p-value=0.0001) [Table/Fig-9a,b].
Postoperative increase in Central Corneal Thickness (CCT) on day 1, first week and sixth week.
| Mean preoperative Central Corneal Thickness (CCT) | Postoperative mean Central Corneal Thickness (CCT) |
|---|
| Day 1 | First week | Sixth week |
|---|
| Mean | Increase in CCT | Mean | Increase in CCT | Mean | Increase in CCT |
|---|
| Group A (Divide and conquer) | 515.98±19.98 | 543.98±20.97 | 28±1.59 | 532.26±20.63 | 16.28±1.62 | 523.44±20.31 | 7.46±1.16 |
| Group B (Phaco-chop) | 506.90±35.15 | 525.24±36.30 | 18.34±1.99 | 518.72±36.09 | 11.82±1.48 | 512.56±35.64 | 5.66±1.17 |
| t-value | 1.58 | 9.15 | 19.23 | 16.63 |
| p-value | 0.11, NS | 0.0001, S | 0.0001, S | 0.0001,S |
Postoperative increase in Central Corneal Thickness (CCT) on day 1, first week and sixth week.
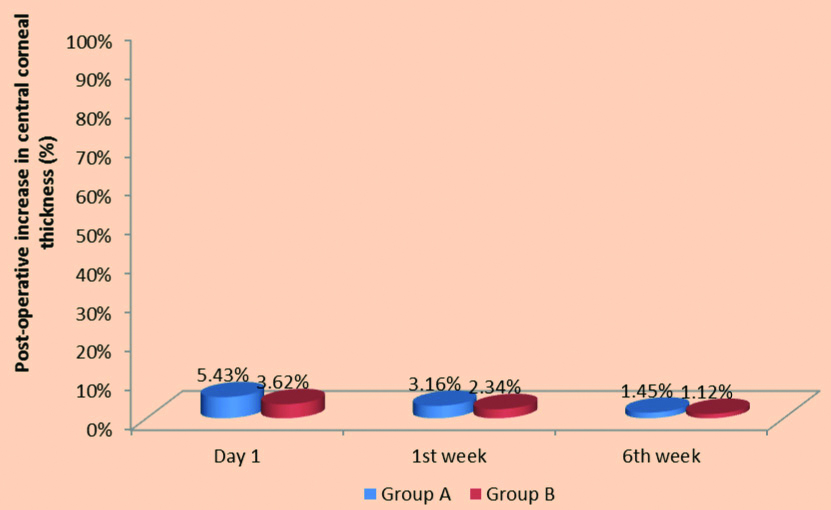
Postoperative % increase in Central Corneal Thickness (CCT) on Day 1, First week and Sixth week.
On postoperative day 1 there was 5.43% increase in CCT in group A, whereas it was 3.62% in group B.
On first week, there was 3.16% increase in CCT in group A, whereas it was 2.34% in group B.
On 6th week it was only 1.45% in group A and 1.12% in group B [Table/Fig-9c,d].
Postoperative % increase in Central Corneal Thickness (CCT) on day 1, first week and sixth week.
| Follow-up | Group A (Divide and conquer) | Group B (Phaco-Chop) |
|---|
| % increase | t-value | % increase | t-value |
|---|
| Day 1 | 5.43% | 180.80, p=0.0001, S | 3.62% | 101.36 p=0.0001,S |
| First week | 3.16% | 181.60, p=0.0001, S | 2.34% | 102.22 p=0.0001,S |
| Sixth week | 1.45% | 182.30, p=0.0001, S | 1.12% | 102.16 p=0.0001,S |
Shows Postoperative % increase in Central Corneal Thickness (CCT) in two groups on day 1, first week, sixth week.
Discussion
In the past 20 years, a revolution has occurred in the techniques and technology of cataract operations, both in developed world and developing world. Cataract surgery is one of the most gratifying rehabilitative procedures, whereby, a person may be relegated upto complete 6/6 vision. Corneal endothelial protection is always a major concern in any form of cataract surgery and plays a vital role in postoperative vision of the patient following cataract surgeries.
During uneventful cataract surgery, ECL may be caused by US vibration, air bubbles, turbulent flow of irrigating solution, long duration of nucleus endothelial contact and floating fragments of cortical masses. Other factors known to increase ECL are high phacoemulsification power, long time of phacoemulsification, high total irrigation volume and temporary postoperative intraocular pressure rise resulting from Ophthalmic Viscosurgical Devices (OVD) retention in the anterior chamber. Excessive manipulation in the anterior chamber which is not well formed leads to mechanical trauma to corneal endothelium.
The single most important predictor of good vision and a clear cornea postoperatively is the total amount of phaco energy delivered into the eye [16]. All modern machines record the total time spent in foot pedal position 3 (phaco time) and the application of average phaco power. The APT or the Effective Phaco Time (EPT), which is the equivalent phaco time at 100% power EPT=phaco time X average phaco power [16]. Technological advances and surgical techniques aimed at minimising the surgical effects of phaco energy have evolved rapidly. The phacoemulsification technique itself can also influence ECL. Storr-Paulsen A et al., suggested that the divide and conquer technique provokes more ECL than the phaco-chop technique, because the divide and conquer method uses more phaco energy, as it cracks the nucleus and facilitates phacoemulsification [17].
Type of Cataract
Nuclear sclerosis was the most prevalent morphology of cataract in the study group.
The same result was found in the study by Bandhu SD et al., where they found in population-based study of lens opacity that, among 198 patients, nuclear sclerosis was found in maximum of the patients [18].
As per the studies done by Chylack LT et al., a well -known clinical relationship exists between nuclear grade and ease of phacoemulsification [19].
Also, a study done by Tabandeh H et al., explains the importance of lens hardness as an important factor and also its association with increased phaco time and power [16].
The importance of this table is that the distribution of patients according to grade of cataract in various groups was not statistically significant which means that all the three groups had comparable characteristics.
Preoperative Visual Acuity
Out of 100 eyes, maximum eyes that is 63 (63%) had preoperative unaided visual acuity of 6/60-CF ½ meter followed by 6/24-6/36 which included 26 (26%) eyes.
Then there were 11 (11%) eyes having preoperative unaided visual acuity of 6/12-6/18 and none of the eyes had preoperative unaided visual acuity of PL+ PR accurate.
It clearly shows that the preoperative unaided visual acuity in the three groups did not vary significantly (p>0.5).
Preoperative Endothelial Cell Count (ECC) and Central Corneal Thickness (CTT)
Preoperative Endothelial Cell Count (ECC)
In a study done in the year 2000 by Rao SK et al., in the Indian population the average endothelial cell density in the age group of 20-87 years was 2525±337 cells/mm2 [20].
Also in a study done by Snellingen T et al., in the age range of 40-75 years showed mean endothelial cell density to be 2720 cell/mm2 [21].
According to a study done by Elnaby EA et al., on comparing phacoprechop and divide and conquer showed that the mean preoperative ECC 2484.44 cells/mm2 and 2536.56 cells/mm2 in the two group [22].
Preoperative Central Corneal Thickness (CTT) in two groups
The mean ECC in group A was 515.98±19.98 and in group B it was 506.90±35.12 preoperatively.
According to study done by El-Din Farahat HG et al., of comparing divide and conquer and chopping, the mean CCT was 505.33±42.81, 508.87±39.70 in the two groups [23].
In a study done by Elnaby EA et al., on comparing phacoprechop and divide and conquer showed that the mean CCT was 545.60 μ±38.60 μ and 543.0 μ±25.47 μ in the two group [22].
Absolute Phaco Time (APT) in Two Groups
Mean Absolute Phaco Time (APT) in two groups
The mean Absolute Phaco Time (APT) in Divide and conquer technique group was 27.12±10.15.
Whereas the mean APT in phaco-chop technique group was 16.58±5.11.
Similarly in a study done by Elnaby EA et al., comparing prechop and divide and conquer showed that the mean effective US time in prechop group was 19.36 seconds ± 8.51 [22]. While it was 24.44±7.86 seconds in divide and conquer group and the difference between the two groups was statistically significant (p=0.033). Thereby showing that the phaco-chop technique has lower APT than divide and conquer technique which was similar to our study.
Also according to study done by El-din Farahat HG et al., of comparing divide and conquer and chopping in the year 2016, the total US consumption (APT) in the divide and conquer group was 48.47 and phaco-chop technique was 22.57 [23]. This was comparable to present study.
Wong T et al., in a study comparing time and power requirements in divide and conquer and phaco-chop techniques reported an effective phaco time of 50.4 seconds in the divide and conquer technique compared to 17.4 seconds with phaco-chop which was comparable to the present study [24].
Also, in a study by Storr-Paulsen A et al., showed mean APT of 3.98 in phaco-chop technique [17], while 12.79 in divide and conquer group.
In a study done by Gross FJ et al., comparing phaco-chop and divide and conquer showed that the mean APT for divide and conquer method was 27.8 and 15 by phaco-chop method [25].
Our results are comparable to those reported by Auffarth G et al., which was a standardised laboratory set up in 10 pairs of human autopsy eyes randomised for the pre chopper or the divide and conquer technique [26]. They found that the average phaco time with the prechopper technique was 1.15±0.26 min versus 1.48±0.28 min with the divide and conquer technique.
Pirazzoli G et al., in a study assessing endothelial damage by phaco-chop and divide and conquer in 1996, reported an effective phaco time of 25.53 seconds with phaco-chop as compared to 87.26 seconds with divide and conquer which was similar to the present study [12].
Mean Absolute Phaco Time (APT) of various grade of cataract in two groups
Similarly, according to a study by Elnaby EA et al., comparing divide and conquer versus prechop showed that the APT in nuclear grade 1 was 21.62 seconds by divide and conquer and 14.57 seconds by phaco-chop technique [22]. Whereas, in nuclear grade 2 APT was 22.68 seconds by divide and conquer technique and 17.5 seconds by phaco-chop technique. Also, in nuclear grade 3 it was 36.75 seconds by divide and technique and 34.25 seconds by phaco-chop technique.
In a study done by Sangeeta P et al., showing effect of power used in phacoemulsification on corneal endothelium by phaco-chop showed that the mean EPT used in nuclear cataract grade 1 was 10 seconds [16]. Similarly, in nuclear cataract grade 2 and nuclear cataract grade 3 and mature cataract, average phaco time used was 14.3, 23 and 25.75 seconds, respectively. The EPT used for posterior subcapsular cataract was the least 9.1 seconds.
Nixon DR, found that effective phaco time varied significantly in cataracts of different grades [27].
Storr-Paulsen A et al., found that significantly less PKE power was used during phaco-chop surgery than during divide and conquer surgery [17].
Tabandeh H et al., stated that lens hardness is probably the important factor and is associated with increased phaco time and power [16].
In a randomised prospective study in 2000, Wong T et al., used a legacy system and found a mean phaco time of 1.2 minutes±0.1 (SD) for phaco-chop and 2.4±0.1 minutes for divide and conquer, with cataracts graded according to LOCS [24].
According to Chylack LT et al., there is a relationship between nuclear colour and ease of phacoemulsification [19].
In a study by Pirazolli G et al., comparing divide and conquer and phaco-chop showed that the mean US time was 63.7seconds in divide and conquer method and 52.58 seconds in phaco-chop method [12]. In grade 1 and 2 nuclear cataract, the phaco time in phaco-chop was less than that of divide and conquer method.
Postoperative Endothelial Cell Count (ECC) on Different Follow-up
Postoperative Endothelial Cell Count (ECC) in two groups on Day 1, First week and Sixth week
The mean ECC in the divide and conquer technique group was 2020.85±252.66 and in phaco-chop technique group was 2200.26±265.03 on postoperative day 1 showing the difference between the two groups was statistically significant. (p=0.0058).
The mean ECC in the divide and conquer technique group was 2062.78±260.54 and in phaco-chop technique group was 2324.20±276.11 on postoperative first week showing the difference between the two groups was statistically significant. (p=0.0016).
The mean ECC in the divide and conquer technique group was 2102.14±264.37 and in phaco-chop technique group was 2365.38±265.94 on postoperative sixth week showing the difference between the two groups was statistically significant. (p=0.0003).
In the study by Storr-Paulsen A et al., comparing endothelial cell damage between divide and conquer and phaco-chop technique stated that postoperatively, both groups had a significant but equal decrease in endothelial cell density [17].
Likewise, in a study by El-din Farahat HG et al., the mean ECC on first week was 2114.73±472.66 by divide and conquer method and 2440.07±256.83 by phaco-chop method [23]. Also, the mean ECC after three months was 2068.20±463.83 by divide and conquer method. And, it was 2381.67±270.68 by phaco-chop method which was statistically significant.
Thus, showing that there was significant decrease in ECC in both the methods but it was less in phaco-chop than divide and conquer method.
Similar to our study, Elnaby EA et al., showed that there was loss of ECC in both the groups but it was less in phaco-chop method than divide and conquer method [22].
Postoperative Central Corneal Thickness (CCT) on Different Follow-ups
Postoperative Central Corneal Thickness (CCT) in two groups on Day 1, First week and Sixth week
In the present study, there was a significant increase in CCT at the immediate postoperative day.
Similar to the study by Elnaby EA et al., showed CCT of 561.72 μ±38.55 μ at first postoperative week and 550.36 μ±39.20 μ at twelvth week in divide and conquer technique [22]. While in phaco-chop technique it showed 562.72 μ±34.93 μ on first week and 548.20 μ±26.13 μ at twelvth week.
Also El-din Farahat HG et al., also showed similar result of increase in CCT immediate after postoperative day. But then there was increase in the thickness which was similar to our study [23].
In a study by Salvi SM et al., it was found that CCT remained increased by 6.44% on day 1 postoperatively compared with preoperative values and gradually reduced to preoperative levels by the first-week postoperative period (0.57% difference) [28]. We agree with them that pachymetric changes after phacoemulsification surgery are reversible.
Endothelial Cell Loss (ECL) in the Two Groups
Mean Endothelial Cell Loss (ECL) and percentage loss
In a study by Elnaby EA et al., comparing phaco-chop and divide and conquer showed that the mean ECL three months postoperatively in Phaco-chop technique was 344.56 (13.86%) and in divide and conquer group [22], the mean ECL three months postoperatively was 449.48 (17.72%) that was statistically significant (p<0.05). The difference in ECL three months postoperatively between the two groups was statistically significant. (p=0.001) This was similar to our study.
Similar to our study, El-din Farahat HG et al., showed similar result showing that there was significant ECC loss in both the groups but the ECC loss was more in divide and conquer group than phaco-chop method till the third month [23]. It was 511.73±408.68 on first week in divide and conquer method and 172.87±154.75 by phaco-chop method. Whereas it was 558.33±403.36 on third month by divide and conquer method and 223.53±169.94 by phaco-chop method.
In the present study, on postoperative day 1 there was 19.45% ECL in divide and conquer technique group, whereas it was 14.89% in phaco-chop group and was statistically significant.
However, the cell loss reduced on first week. There was 17.78% cell loss in divide and conquer technique group, whereas, it was 10.09% in phaco-chop group and was statistically significant.
And also, on sixth week the ECL was 16.22% in divide and conquer group and 8.51% in phaco-chop group and was statistically significant.
Storr-Paulsen A et al., in the study comparing endothelial damage in divide and conquer versus phaco-chop techniques reported that, the mean cell loss was 173 cells/mm2 (6.3%) and 155 cells/mm2 (5.7%) at 3 and 12 months, respectively, in the divide and conquer group and 138 cells/mm2 (5.0%) and 94 cells/mm2 (3.5%), respectively, in the phaco-chop group [17].
In a study by Pirazzolli G et al., the mean preoperative ECD was 2623 cells/mm2 in the phaco-chop group and 2590 cells/mm2 in the phaco fracture group [12]. Postoperatively, it was 2499 and 2233 cells/mm2, respectively. The mean cell loss was 4.72 and 13.8%, respectively which was similar to our study.
Postoperative Increase in the Central Corneal Thickness (CCT)
Postoperative increase in Central Corneal Thickness (CCT) on Day 1, First week and Sixth week and mean increase in thickness
In the present study, there was a significant increase in CCT at the immediate postoperative day. However, then the CCT recovered to the preoperative values at the final follow-up.
Can I et al., reported a shorter time interval (10-14 days) [29].
In the study by El-Din Farahat HG et al., there was a significant increase in CCT at the immediate postoperative day [23]. At first week it was 14±5.7 (2.7%) in divide and conquer group and 10.5±11.4 (2.1%) in chop group. While at three months it was 1.4±1.8 (0.3%) in divide and conquer group and 0.6±2.3 (0.1%) in chop group, which was statistically significant.
Postoperative Visual Acuity
Postoperative visual acuity in two groups on Day 1, First week and Sixth week
The two groups gained improvement in visual acuity. There was a significant difference between the studied groups at immediate postoperative day.
The reduced visual acuity on the first postoperative day in both groups is due to the anterior chamber reaction and some amount of corneal oedema. But visual recovery is early in phaco-chop group than divide and conquer group.
The early improvement in visual acuity in phaco-chop group was due to the fact that there is less amount of ECL as there is less amount of energy usage and less time is taken in it.
The postoperative vision at the final follow-up at sixth week was 6/9 or better in 82% of cases in divide and conquer group and 86% in phaco-chop group.
Conclusion(s)
The present study concluded that there is a relationship between the phaco time used and the ECL in both techniques: the longer the phaco time used, the more the ECL. The phaco-chop technique has fewer steps and requires minimal manipulation of intraocular instruments. Thus, the results are efficient and predictable for all nuclear densities. Since, phaco-chop uses less phaco power, so it can be suggested that it is less harmful to the corneal endothelium. It could be understood that since divide and conquer technique provokes ECL and hence, uses more phaco energy as it attacks the nucleus and facilites phacoemulsification. Thus, there is significant advantage of phaco chop in terms of phaco power and the duration. Thus to conclude, the phaco-chop technique takes less phacoemulsification time and less ECL as compared to divide and conquer technique.
PSC: Posterior sub capsular cataract; NS: Nuclear sclerosis; CC: Cortical cataract