Influenza is an acute, febrile respiratory illness caused by infection with influenza type A or B viruses and is responsible for outbreaks almost every winter [1] Since the identification of the novel variant of influenza A (swine influenza/H1N1) in April 2009 and its subsequent antigenic and genetic characterisation, this novel H1N1 virus strain had rapidly spread worldwide [2]. In India, Influenza A (H1N1) is the predominating subtype that has been circulating for many years post the 2009 pandemic. From 2011 to 2014 swine influenza was laying dormant but 2015 showed its revival in India [3]. During the post-pandemic period, the last major outbreak in India occurred in 2019 with 28798 cases and 1218 deaths, out of which 5092 cases and 208 deaths occurred in Rajasthan only as per the National Centre for Disease Control data (NCDC) [4].
Patients with swine influenza (H1N1) mostly present with fever, headache, malaise, sore throat and cough. They frequently progress to bilateral pneumonia. In some cases, it may lead to acute respiratory distress syndrome and multiple organ dysfunctions leading to high case fatality. Delay in diagnosis of swine influenza virus infection is associated with a delayed admission in ICU, greater chance of respiratory and renal failure and a higher mortality rate. Hence, early diagnosis and treatment with antivirals is imperative to achieve successful outcome [5]. At present, RT-PCR of respiratory tract specimens is recommended as critical diagnostic tests for clinical decision-making according to the NCDC guidelines in India, which are time-consuming procedures and result in a significant delay in confirmation of suspected cases [6].
CBC is one of the most routine laboratory tests being examined in patients with ILI, which can be carried out in hospitals of different grades and conditions. The role of haematological indices in the diagnosis of influenza virus infection has also been reported before [7-10].
This study was designed to evaluate haematological indices as potential indicators to discriminate swine influenza (H1N1) virus infection from another ILI in adults, which would facilitate early screening and initiation of antiviral treatment before the result of RT-PCR of respiratory specimen became available.
Materials and Methods
Design and Setting
The present study was a hospital-based, prospective observational study conducted in the Department of Medicine, at SP Medical College, Bikaner, a tertiary care center in northwest Rajasthan (India); during the period from January 2019 to December 2019. The study protocol was approved by the Institutional Review Board {No: F.29. (Acad) SPMC/2019/3868} and informed consent was taken from each study subject. A sample size of 110 was calculated assuming frequency of 50% with a permissible error of 20% using the statistical formula, n=4pq/L2. where q=1-p, and L=allowable error.
Inclusion criteria: Adult patients aged more than 18, admitted with a complaint of ILI, fulfilling criteria of category C as per NCDC technical guidelines for H1N1 [6].
Exclusion criteria: All other patients who had productive cough indicating a bacterial infection or chest X-ray indicating lobar pneumonia were excluded. Patients with sepsis, anaemia, haematological disorders, cancer, liver disease, nephropathy, and cardiovascular diseases were excluded.
Methods
A total of 332 patients were included presenting as ILI. Simultaneously, 200 age and sex-matched unrelated healthy adult subjects (relatives of patients admitted for illnesses, other than ILI) were recruited as the control group. Reverse transcriptase-polymerase chain reaction (RT-PCR) testing of nasal and pharyngeal sample was used to obtain swine influenza (H1N1) results in all patients. SFRI HEMIX 5-60 five-classification haematology analyser was used to obtain CBC results in all patients and healthy control. Though, healthy controls did not undergo H1N1 testing to rule out asymptomatic infection. All reagent preparation and determination of results were strictly referred to related kit instructions.
Patients were divided into two groups according to swine influenza (H1N1) results: swine influenza-positive patient group (89) and swine influenza-negative patient group (243). The first visit CBC results including White Blood Cell count (WBC), Absolute Neutrophil (Neu) Count, Absolute Lymphocyte (LYM) Count, and Platelet (PLT) count of patients and healthy control along with swine influenza (H1N1) results of each patient were recorded. Additionally, another three haematological parameters were calculated, which were NLR, absolute neutrophil count divided by LYM, PLR, platelet count divided by absolute lymphocyte count, and LYM×PLT.
When collecting the nasal sample from patients for RT-PCR, the swab was inserted into the place with the most secretions with gentle rotation of the swab and pushed it into the nasal cavity, until the nasal turbinate is blocked. After several times of rotation, gently stuck the nasal wall and took out the swab. When collecting the pharyngeal sample, the swab was inserted from the mouth into the pharynx, and the swab was taken from the posterior pharyngeal wall and bilateral pharyngeal tonsils with moderate force. RT-PCR was done in the Department of Microbiology according to NCDC guidelines [6]. Five milliliters of peripheral blood were taken from patients and healthy control placed in Ethylene Diamine Tetraacetic Acid (EDTA) tube for haematological indices (WBC count, absolute neutrophil counts, lymphocyte, and platelet) and the specimens were analysed within 1 hour from venesection.
Statistical Analysis
Statistical Package for the Social Sciences (SPSS) 16.0 software was used for statistical analysis. Continuous variables were represented as the mean±SD (Standard Deviation). ANOVA test was used to compare variables of different groups. p-value <0.05 was considered statistically significant. The sensitivity, specificity, and AUC of LYM, PLT, NLR, PLR, and LYM×PLT were calculated using the Receiver Operating Characteristic (ROC) curve.
Results
A total of 332 patients with ILI were enrolled in the study. Out of which, 89 patients were positive for swine influenza in pharyngeal and nasal swabs and 243 patients were negative for swine influenza (ILI), with a positive detection rate of 26.8 %. Diagnosis of ILI was kept in 243 swine influenza negative patients and they were treated symptomatically and with antibiotics. There were no significant differences in age or gender among the three groups [Table/Fig-1].
Results of age, gender, and hematological indices of the swine influenza-positive patient, swine influenza-negative patients and control group.
| Parameters | Swine influenza-positive patient group (Mean±SD) | Swine influenza-negative patient group (Mean±SD) | Control group (Mean±SD) | χ2/F | p-value |
|---|
| No. of subjects | 89 | 243 | 200 | - | |
| Male (%) | 51 (57.30) | 134 (55.14) | 119 (59.5) | - | |
| Age (years) | 45.86±16.81 | 41.03±17.65 | 40.3±17.55 | 307.18 | 0.069 |
| WBC (109/L) | 7.020±3.684b | 7.419±2.393 | 5.921±1.032 | 5.27 | 0.001 |
| NEU (109/L) | 5.385±2.831b | 5.729±1.708 | 3.422±0.559 | 2.78 | 0.001 |
| LYM (109/L) | 1.014±0.698b | 1.020±0.362 | 1.908±0.464 | 0.22 | 0.001 |
| PLT (109/L) | 159±59.25ab | 226±69.24 | 228±46.38 | 3586.50 | 0.001 |
| NLR | 5.976±1.559b | 5.779±1.101 | 1.855±0.351 | 1.006 | 0.001 |
| PLR | 214.89±107.73ab | 232.32±57.37 | 121.76±13.72 | 3507.62 | 0.001 |
| LYM×PLT | 191.60±189.38ab | 243.54±137.56 | 456.18±190.55 | 28282.02 | 0.001 |
One-way ANOVA was used to compare mean between different groups; WBC: White blood cell count; NEU: Neutrophil; LYM: Lymphocyte; PLT: Platelet; NLR: Neutrophil to lymphocyte ratio; PLR: Platelet to lymphocyte ratio; LYM×PLT: Lymphocyte multiplied by platelet; a: p<0.05 compared to swine influenza- negative group; b: p<0.05 compared to healthy control group; SD: Standard deviation
Compared with patients in the swine influenza-negative group, NLR in swine influenza-positive group was higher, while WBC, LYM, PLT, PLR, LYM×PLT were lower. In addition, compared with the control group, WBC, NEU, NLR and PLR in swine influenza-positive groups were significantly higher, while LYM, PLT, and LYM×PLR were significantly lower.
Diagnostic Values of Haematological Indices for Distinguishing Influenza H1N1-Positive Patients from Influenza H1N1-Negative Patients or Healthy Controls
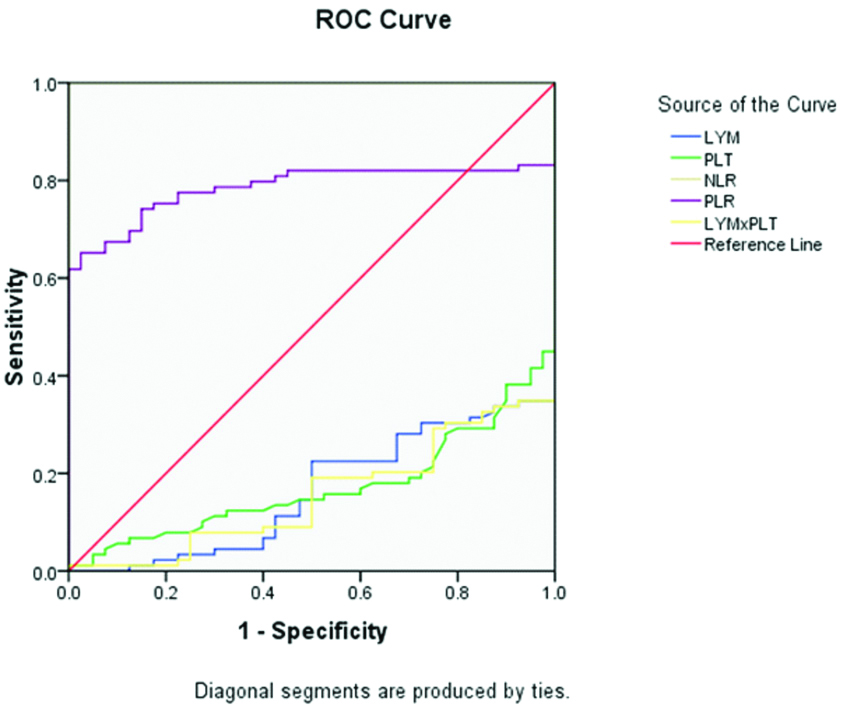
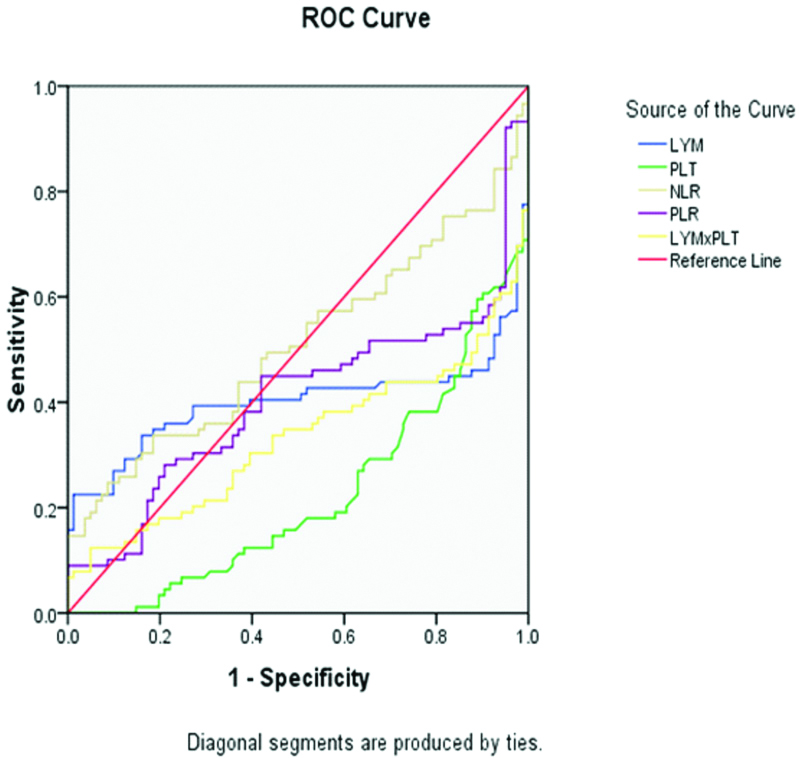
With a cut-off value of 5.432, NLR distinguished swine influenza-positive patients from swine influenza-negative patients with the highest sensitivity and specificity of 55.1% and 48.1%, respectively, while the sensitivity and specificity of NLR were highest at 100% each in the swine influenza-positive group with a cut-off value of 3.09, if healthy controls were used as a reference. PLR distinguished swine influenza-positive patients from swine influenza-negative patients with the highest sensitivity and specificity of 46.1% and 46.9% with a cut-off value of 217.62, while the sensitivity (77.5%) and specificity (77.5%) of PLR were highest in the swine influenza-positive group with a cut-off value of 130.53, if the healthy control group was used as a reference.
For LYM×PLT, the sensitivity (39.3 %) and specificity (38.3) were highest if, 165.8 was used as the cut-off value with the swine influenza-negative group as reference. And if healthy controls were used as a reference, the highest sensitivity and specificity of LYM×PLT were 29.2 % and 25.0%, respectively, with a cut-off value of 236.47. Among all the haematological indices, NLR has the largest AUC and the highest diagnostic value followed by PLR [Table/Fig-2,3,4 and 5].
Diagnostic performance of LYM, PLT, NLR, PLR, and LYM×PLT for distinguishing swine influenza-positive patients from healthy controls.
| Parameter | Cut-off value† | Sensitivity (%) | Specificity (%) | AUC (95% CI) |
|---|
| LYM | 1.464 | 29.2 | 27.5 | 0.162 (0.107-0.217 |
| PLT | 183.5 | 28.1 | 23.5 | 0.171 (0.110-0.233) |
| NLR | 3.09 | 100 | 100 | 1.0* |
| PLR | 130.53 | 77.5 | 77.5 | 0.785** (0.706-0.863) |
| LYM×PLT | 236.47 | 29.2 | 25 | 0.154 (0.099-0.209) |
AUC (95% CI); area under the receiver operating characteristic curve (95% confidence interval); LYM: Lymphocyte; PLT: Platelet; NLR: Neutrophil to lymphocyte ratio; PLR: Platelet to lymphocyte ratio; LYM×PLT: Lymphocyte multiplied by platelet; †: Cut-off value was determined by the Youden index (J) method; *: Highest AUC; **: Second highest AUC
Diagnostic performance of LYM, PLT, NLR, PLR, and LYM×PLT for distinguishing swine influenza-positive patients from swine influenza-negative patients with ILI.
| Parameter | Cut-off value† | Sensitivity (%) | Specificity (%) | AUC (95% CI) |
|---|
| LYM | 0.841 | 42.7 | 48.1 | 0.401 (0.309-0.493) |
| PLT | 168.5 | 30.3 | 29.6 | 0.223 (0.166-0.281) |
| NLR | 5.432 | 55.1 | 48.1 | 0.511* (0.431-0.591) |
| PLR | 217.62 | 46.1 | 46.9 | 0.407** (0.327-0.488) |
| LYM×PLT | 165.8 | 39.3 | 38.3 | 0.331 (0.253-0.410) |
AUC (95% CI); area under the receiver operating characteristic curve (95% confidence interval); LYM: Lymphocyte; PLT: Platelet; NLR: Neutrophil to lymphocyte ratio; PLR: Platelet to lymphocyte ratio; LYM×PLT: Lymphocyte multiplied by platelet; ILI: Influenza like illness; †: Cut-off value was determined by the Youden index (J) method; *, Highest AUC; **: Second highest AUC
Receiver Operating Characteristic (ROC) curve of Lymphocyte (LYM), Platelet (PLT), Neutrophil–To-Lymphocyteratio (NLR), Platelet-To-Lymphocyte ratio (PLR), and LYM×PLT in Swine Influenza. The control group was used as reference.
Receiver Operating Characteristic (ROC) curve of Lymphocyte (LYM), Platelet (PLT), Neutrophil–To-Lymphocyte ratio (NLR), Platelet-To-Lymphocyte ratio (PLR), and LYM×PLT in Swine Influenza. The swine influenza-negative patient was used as reference.
Discussion
This study was designed to evaluate haematological indices as potential indicators to discriminate swine influenza (H1N1) virus infection from another ILI. Among all the haematological indices, NLR has the largest AUC and the highest diagnostic value, followed by PLR, which may be used in combination to improve the diagnostic value.
This study found that many haematological parameters changed significantly due to swine influenza virus infection, such as LYM, PLT, NLR, PLR, and LYP*PLT. There was a significant difference in LYM between the swine influenza-positive and control group (p=0,001), but no significant difference between swine influenza-positive and swine influenza-negative group (p=0.995). In a study Influenza virus infection induced a neutrophilia and lymphopenia, which was different from adenovirus, respiratory syncytial virus, EB virus, human herpes virus type 6, and enterovirus [11,12]. Han Q et al., also reported neutrophilia and lymphopenia in influenza A infection [10]. Lymphopenia was also reported by other studies in swine influenza infection [13,14]. A study from Turkey concluded that relative lymphopenia and monocytosis may be considered as a surrogate marker of pandemic influenza A [15]. The reason for lymphopenia might be that influenza viruses temporally destroy the human immune system’s line of defense by increasing the granzyme B positive cells to kill virus-infected lymphocytes and monocytes, resulting in susceptibility to a secondary infection [16].
Compared with the control group, PLT in swine influenza-positive and swine influenza-negative groups was significantly lower (p=0.001). On post-hoc analysis, there was a significant difference in PLT between swine influenza-positive and control group (p=0.001), and between swine influenza-positive and swine influenza-negative groups, respectively (p=0.001). A study done by Han Q et al., reported that platelet count was significantly lower in influenza virus-positive patients than in negative controls (p <0.001), suggesting that decreased platelet counts could differentiate influenza virus infections from others, and concluded that platelet count had a high correlation and specificity to preliminarily discriminate influenza virus infection from suspected influenza virus infection [10]. Influenza virus could induce uncontrolled platelet activation which may lead to an inflammatory response in the respiratory tract [17,18]. Scott S et al., reported that the influenza virus removes platelet surface sialic acid and that these platelets are rapidly cleared from peripheral blood [19]. Compared with the control group, LYM×PLR in swine influenza-positive and swine influenza-negative groups were significantly lower (p=0.001). On post-hoc analysis, there was a significant difference in LYM×PLT between swine influenza-positive and control group (0.001), and between swine influenza-positive and swine influenza-negative group respectively (p=0.035). Fei Y et al., reported that LYM×PLT was significantly different in influenza-positive, influenza-negative and control groups, respectively [9].
Compared with the control group, NLR in swine influenza-positive and swine influenza-negative groups was significantly higher (p=0.001). On post-hoc analysis, there was a significant difference in NLR between the swine influenza-positive and control group (p=0.001), but no significant difference between swine influenza-positive and swine influenza-negative group (p=0.25). Compared with the control group, PLR was significantly higher in influenza-positive and influenza-negative groups (p=0.001). On post-hoc analysis, there was a significant difference in PLR between swine influenza-positive and control group (p=0.001), and between swine influenza-positive and swine influenza-negative group respectively (p=0.047). Han Q et al., reported higher PLR in influenza-positive patients, compared with healthy control group (p=0.967) [10].
Among all the haematological indices, NLR has the largest AUC and the highest diagnostic value. However, the AUC was only 0.511 with the best sensitivity and specificity of 55.1% and 48.1%, respectively, if the swine influenza–negative group was used as a reference. Whereas, using controls as a reference, the AUC of NLR was 1.0 with the best sensitivity and specificity of 100 % each. This means the diagnostic value of NLR is quite good. It is noteworthy that the best sensitivity and specificity of PLR was 46.1% and 46.9% if the swine influenza-negative group was used as a reference. NLR and PLR may be used in combination to discriminate swine influenza infection from ILI, and may be helpful in timely initiation of antiviral treatment. A study done by Xiaohong Y et al., reported a higher NLR value in children with influenza A, compared to influenza negative group (p<0. 05). The ROC curve of NLR prediction of influenza A in children showed that the sensitivity, specificity, and AUC were 86.1%, 93.2% and 0.594, respectively when the NLR value was 0.42 [8]. Han Q et al., reported NLR of 8.877±9.833 in influenza-positive patients, 8.905±0.617 in influenza negative patients, and 1.595±0.507 in healthy control group respectively (p=0.984), and diagnostic sensitivity of 70.09 %. They concluded that NLR was a more sensitive parameter for influenza virus infection than the other haematological [10]. Contrary to this Fei Y et al., reported that, LYM×PLT has the largest AUC (0.682) and the highest diagnostic value with the best sensitivity and specificity of 57.59% and 72.60%, respectively, if the influenza A-negative group was used as a reference. While using controls as a reference, the AUC of LYM×PLT was 0.788 with the best sensitivity and specificity of 63.87% and 92.31%, respectively [9]. Haematological indices are simple and inexpensive investigation which is routinely performed in every hospitalised patient, hence the inferences of this study have pretty useful diagnostic value.
Limitation(s)
Relatively few cases were enrolled in a single-center, so large-scale multicentre clinical studies are required to validate these findings. Effect of other diseases and medication on haematological indices is another limitation.
Conclusion(s)
According to this study, the authors concluded that if the NLR values are more than 3.09 and the PLR values more than 130.53, the results may indicate swine influenza (H1N1) infection in adults. NLR and PLR value can be used to ascertain, whether the patient is infected with influenza presenting as ILI, to avoid blindly using antibiotics and ignoring antiviral treatment before RT-PCR results. When using NLR and PLR as diagnostic and predictive indicators, epidemiological history and comprehensive examination should be combined to avoid overuse and unnecessary treatment. The anti-viral treatment can also be started early, thus reducing the complications and mortality due to delayed treatment, especially when there are a large number of suspected cases or in areas where the facilities for RT-PCR are not available.
One-way ANOVA was used to compare mean between different groups; WBC: White blood cell count; NEU: Neutrophil; LYM: Lymphocyte; PLT: Platelet; NLR: Neutrophil to lymphocyte ratio; PLR: Platelet to lymphocyte ratio; LYM×PLT: Lymphocyte multiplied by platelet; a: p<0.05 compared to swine influenza- negative group; b: p<0.05 compared to healthy control group; SD: Standard deviation
AUC (95% CI); area under the receiver operating characteristic curve (95% confidence interval); LYM: Lymphocyte; PLT: Platelet; NLR: Neutrophil to lymphocyte ratio; PLR: Platelet to lymphocyte ratio; LYM×PLT: Lymphocyte multiplied by platelet; †: Cut-off value was determined by the Youden index (J) method; *: Highest AUC; **: Second highest AUC
AUC (95% CI); area under the receiver operating characteristic curve (95% confidence interval); LYM: Lymphocyte; PLT: Platelet; NLR: Neutrophil to lymphocyte ratio; PLR: Platelet to lymphocyte ratio; LYM×PLT: Lymphocyte multiplied by platelet; ILI: Influenza like illness; †: Cut-off value was determined by the Youden index (J) method; *, Highest AUC; **: Second highest AUC