Diabetes and its related complications have established itself as the most significant cause of morbidity and mortality worldwide. Diabetic neuropathy is the most common microvascular complication of Diabetes Mellitus (DM) reaching 45-50% prevalence. The exact prevalence of diabetic peripheral neuropathy is debatable; however, it is roughly estimated to be about 8% in newly diagnosed diabetics (at time of diagnosis of DM) and greater than 50% in patients who had diabetes longer than 20 years with average prevalence of 30% [1].
There is a close association between obesity and type 2 diabetes as well as its complications. The relation between obesity and Type 2 Diabetes Mellitus (T2DM) is so inherent that Sims EA et al., coined the term “diabesity”, and reported that young men with no family history of diabetes when overfed for 6 months, showed a reversible rises in fasting concentrations of insulin, glucose, and Triglycerides (TG), and impaired glucose tolerance and their BMI increased to 28·0 kg/m2 [2]. According to Stevens J et al., around 90% of individuals who develop T2DM have BMI higher than 23·0 kg/m2, the risk of diabetes being greatly increased by early weight gain and with abdominal obesity [3]. Obesity may trigger changes to the body’s metabolism that cause adipose tissue to release increased amounts of fatty acids, glycerol, hormones, pro-inflammatory cytokines and other factors that are involved in the development of insulin resistance [4]. Oxidative stress occurs by the insulin resistance and obesity which leads to self-reinforcing cascade of metabolic and inflammatory effects and ultimately cause peripheral nerve injury. It has been proved from animal based models that obesity induced by diet leads to microvascular injury and peripheral nerve dysfunction in animals [5].
Most of the studies that address epidemiological correlates of diabetic neuropathy have taken BMI as a surrogate marker of obesity [6,7]. BMI is known to affect nerve conduction; hence its consideration is of utmost importance while interpreting Nerve Conduction Studies (NCS). However, BMI is just a surrogate marker of obesity and it doesn’t provide actual information about the body fat content. In fact, doubts have been raised by researchers and there is a continuing debate about where on the BMI scale, the dividing lines between categories should be placed [8]. Few studies have correlated body composition and body fat content with diabetic neuropathy, but they have used the Michigan Neuropathy Screening Instrument (MNSI) scores that comprise a questionnaire and inspection, not NCV- considered the gold standard for detection of diabetic neuropathy [9].
To best of the knowledge, none of the study has correlated NCV with actual body fat mass in type 2 diabetic patients. In the present study, the actual body fat mass was measured by bio impedance analysis with the NCV in the type 2 diabetic peripheral neuropathy patients was correlated.
Materials and Methods
The prospective, cross-sectional study was conducted in Department of Physiology and Centre for Diabetes and Endocrinology on 90 type 2 DM patients attending diabetes clinic during April 2018-January 2019 after obtaining a valid ethical clearance from the Institutional Ethics Committee of the college (D.No.1287/FM). Patient selection was strictly based on the inclusion and exclusion criteria.
Inclusion criteria
Patients presenting in the hospital diagnosed as type 2 DM of recent onset or not more than 8 years.
Age of the patient between 30 to 60 years.
According to Diabetes Association Criteria, if Fasting Plasma Glucose (FPG) ≥126 mg/dL (7.0 mmol/L) and 2 hour postprandial plasma glucose ≥200 mg/dL (11.1 mmol/L) during oral glucose tolerance test and Glycosylated haemoglobin ≥6.5% (48 mmol/L) then the diagnosis of diabetes was confirmed [9].
Informed consent for nerve conduction study.
Exclusion criteria
Patients with any systemic condition related to peripheral neuropathy (malnutrition, alcoholic neuropathy, renal failure) or with neuropathies associated with exogenous toxins, metals, and drugs.
Peripheral artery disease or evidence of limb ischemia.
Trauma, skin lesion or swelling in the course of nerve that interfered with nerve conduction study recordings.
Patient’s demographic profile such as gender, age, diabetes duration, height and weight was obtained. BMI was calculated as per the formula {weight (kg)/height (m)2}. Blood pressure was measured three times using a standard mercury sphygmomanometer, and measurements were averaged.
Biochemical investigations of the patients i.e., fasting blood glucose, postprandial blood glucose and glycosylated haemoglobin (HbA1c) were recorded. Glucose oxidase peroxidase enzymatic method was used to measure plasma glucose and glycosylated haemoglobin (HbA1C) was estimated by cation exchange resin method (reagent supplied by Pointe Scientific Inc. Michigan, USA).
Nerve Conduction Studies (NCS)
Nerve conduction study was performed using Neuroperfect software on windows-based Computerised EMG/NCV/EP (electromyography, NCV, electrophysiology) system supplied by Medicaid System, Chandigarh, India. The study was performed with standard surface stimulating and recording techniques. NCV (m/s) were measured in both upper and lower limbs bilaterally. Median, Ulnar, and Posterior tibial nerves were selected for motor nerve conduction study and Median, Ulnar and Sural nerves were selected for sensory nerve conduction study. Standard recording and stimulation sites were used for all recordings. Since the studies were performed in atropical country where the ambient temperature at the time of performing NCS was always >25°C, limb temperature was not monitored, however the room was air conditioned to prevent excessive ambient temperature. Compound muscle action potential amplitudes were measured from the baseline to negative peak, and onset latencies were measured for distal and proximal stimulation sites. Sensory Nerve Action Potential (SNAP) amplitude was measured from the initial positive peak to the negative peak or from the baseline to the negative peak, if there was no initial positive peak. Motor NCV was measured by electrical stimulation of a peripheral nerve and recording from a muscle supplied by this nerve. Stimulation was provided at two different locations along the same nerve for the determination of NCV. The ratio of distance between the different stimulating electrodes (mm) and the difference in latencies (ms) depicted the NCV (m/s).
Sensory NCV was measured by electrically stimulating a peripheral nerve and recording its SNAP from a purely-sensory portion of the nerve, such as on a finger. The sensory NCV was then calculated by recording the latency and the distance between the stimulating and recording electrodes.
Body Fat Analysis
TBFM and body fat percentage were measured by BIA with Body stat analyser (1500 MDD; Bodystat, Isle of Man, UK). BIA analysis is based on the principle that different body tissue conducts electric current at different rates and adipose tissue is significantly less conductive than muscle or bone. The calculation of body fat mass and percentage is as per the algorithm used in the manufacturer software provided with the analyser.
Statistical Analysis
Statistical analysis of the data was performed using software Statistical Package for Social Science (SPSS) version 25.0 for Windows (IBM Corp. USA). One-sample Kolmogorov-Smirnov tests were performed to check whether distribution of variables was normal. Continuous variable were expressed as mean±standard deviation. The association between continuous variables was tested by linear correlation using Pearson’s coefficient. All tests were two tailed, confidence intervals were calculated at 95% level and a p-value of<0.05 was considered significant.
Results
The mean age of the patients was 51.42±7.53. The mean duration of diabetes was 4.57±2.08 [Table/Fig-1].
Demographic and biochemical parameters.
| Variable | Value (Mean±SD) | Range |
|---|
| Sex (M:F) | 34:56 | |
| Age (years) | 51.42±7.53 | 32-60 |
| Duration of T2DM (years) | 4.57±2.08 | 0.5-8 |
| Weight (kg) | 64.70±8.88 | 50-89 |
| Height (m) | 1.56±0.10 | 1.35-1.86 |
| Systolic BP (mmHg) | 138±23.14 | 104-172 |
| Diastolic BP (mmHg) | 86±7.04 | 72-118 |
| Fasting plasma glucose (mg/dL) | 152.78±54.77 | 84-214 |
| Post prandial glucose (mg/dL) | 225.84±74.38 | 118-352 |
| HbA1c (%) | 8.99±2.03 | 6.4-11.4 |
N=90; T2DM: Type 2 diabetes mellitus; BP: Blood pressure; SD: Standard deviation
BMI categorisation was done according to the Asian-Pacific cut-off points [10]. As per the categorisation, 48% of the subjects (n=44) were found to be obese and 31% (n=28) were overweight. The mean BMI of all the 90 subjects came out to be 26.57±3.9. The mean TBFM was 22.88±5.93 kg and the percentage body fat mass came out to be 35.39±8.3 [Table/Fig-2].
BMI and Total Body Fat Mass (TBFM) analysis of the type 2 diabetic subjects.
| Variable | Value (Mean±SD) | Range |
|---|
| BMI | 26.57±3.9 | 19.29-36.05 |
| BMI subcategories*: |
| Underweight (n=0) | 0 | |
| Normal (n=18) | 20.71±1.12 | 19.29-22.89 |
| Overweight (n=28) | 24.14±0.63 | 23.12-24.97 |
| Obese (n=44) | 26.58±3.82 | 25.30-36.05 |
| Body fat mass analysis |
| Total body fat mass (kg) | 22.88±5.93 | 9.8-40.6 |
| % body fat mass | 35.39±8.33 | 115.8-50.7 |
*Asia-pacific population cut-off [10]; BMI: Body mass index; SD: Standard deviation
Comparative analysis using independent sample t-test showed that there is no significant difference in the motor NCV of the right and left side of the body [Table/Fig-3]. Comparative analysis using independent sample t-test showed that there is no significant difference in the sensory NCV of the right and left median, ulnar and sural nerves [Table/Fig-4].
Motor Nerve Conduction Velocity (NCV) of the type 2 diabetic subjects.
| Nerves | Nerve conduction velocity (m/s) | p-value |
|---|
| Right side | Left side |
|---|
| Median nerve | 48.35±7.07 | 49.90±6.37 | 0.252 |
| Ulnar nerve | 54.18±6.62 | 53.12±7.62 | 0.972 |
| Posterior tibial nerve (PTN) | 40.05±5.82 | 41.68±6.40 | 0.61 |
(Significant p-value at <0.05)
Sensory Nerve Conduction Velocity (NCV) of the type 2 diabetic subjects.
| Nerves | Nerve conduction velocity (m/s) | p-value |
|---|
| Right side | Left side |
|---|
| Median nerve | 45.94±7.60 | 47.76±7.04 | 0.216 |
| Ulnar nerve | 47.55±7.48 | 48.69±8.58 | 0.48 |
| Sural nerve | 46.68±7.01 | 45.95±6.35 | 0.56 |
(Significant p-value at<0.05)
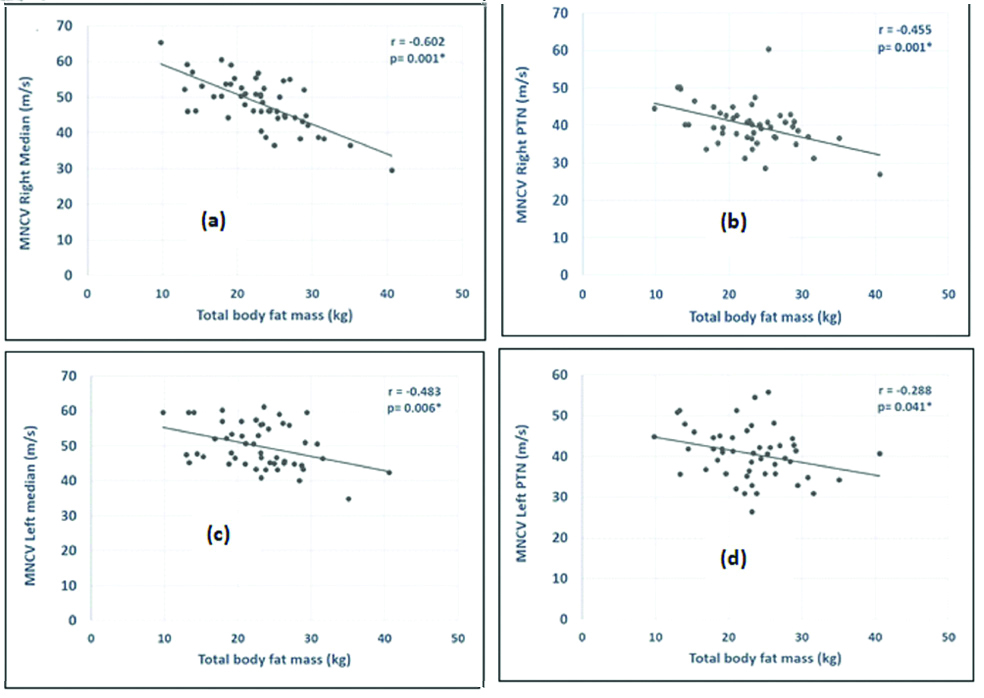
BMI and TBFM showed negative correlation with the motor NCV of both sides of the body. BMI had a significant negative correlation with conduction velocity of two nerves, the right median and the right posterior tibial nerve. However, the TBFM showed a significant negative correlation with the motor conduction velocity of right median, right posterior tibial, left median and left posterior tibial [Table/Fig-5,6].
Correlation of BMI and Total Body Fat Mass (TBFM) (kg) with the motor Nerve Conduction Velocity (NCV).
| Nerves studied | Body mass index (BMI) | Total body fat mass (kg) |
|---|
| ‘r’ value | p-value | ‘r’ value | p-value |
|---|
| Right median | -0.483 | 0.002* | -0.602 | 0.001* |
| Right ulnar | -0.103 | 0.476 | -0.245 | 0.087 |
| Right posterior tibial | -0.305 | 0.031* | -0.455 | 0.001* |
| Left median | -0.260 | 0.059 | -0.483 | 0.006* |
| Left ulnar | -0.031 | 0.832 | -0.135 | 0.351 |
| Left posterior tibial | -0.058 | 0.696 | -0.288 | 0.041* |
*p-value <0.05
Graph significant correlation of Total Body Fat Mass (TBFM) with: (a) MNCV right median nerve; (b) MNCV right posterior tibial nerve (PTN); (c) MNCV left median nerve and; (d) MNCV left posterior tibial nerve.
MNCV: Motor nerve conduction velocity
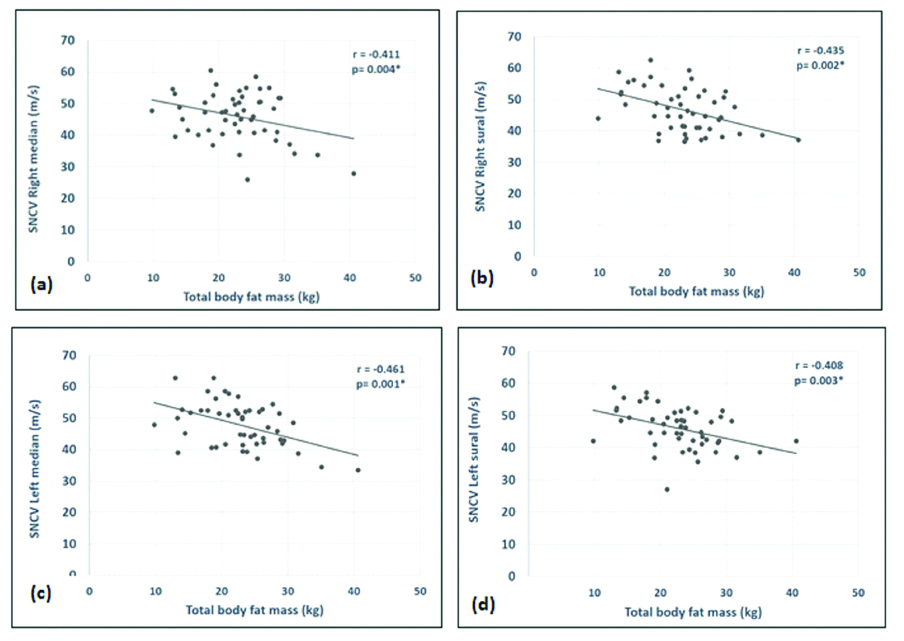
Both BMI and TBFM showed negative correlation with the sensory NCV of both sides of the body. However, yet again the BMI was significantly correlated with just the right median and the left sural nerves. The TBFM correlated significantly with the sensory NCV of right median, right sural, left median and left sural nerve [Table/Fig-7,8].
Correlation of BMI and Total Body Fat Mass (TBFM) (kg) with the sensory Nerve Conduction Velocity (NCV).
| Nerves studied | Body mass index (BMI) | Total body fat mass (kg) |
|---|
| ‘r’ value | p-value | ‘r’ value | p-value |
|---|
| Right median | -0.388 | 0.05* | -0.411 | 0.004* |
| Right ulnar | -0.201 | 0.161 | -0.258 | 0.070 |
| Right sural | -0.254 | 0.076 | -0.435 | 0.002* |
| Left median | -0.258 | 0.070 | -0.461 | 0.001* |
| Left ulnar | -0.080 | 0.580 | -0.155 | 0.282 |
| Left sural | -0.356 | 0.05* | -0.408 | 0.003* |
*p-value <0.05
Graph significant correlation of Total Body Fat Mass (TBFM) with: (a) SNCV right median nerve; (b) SNCV right sural nerve (c) SNCV left median nerve and; (d) SNCV sural nerve.
SNCV: Sensory nerve conduction velocity
As evident from [Table/Fig-5,6,7 and 8], the TBFM has a more significant correlation with the nerve conduction velocities of both motor and sensory nerves as compared to the BMI.
Discussion
In the current study, it was found that both BMI and TBFM showed a negative correlation with the motor as well as sensory nerve conduction velocities. However, TBFM showed a more significant correlation with both the motor and sensory nerve conduction velocities. As evident from [Table/Fig-5], BMI showed a significant correlation with just two of the motor NCV. The TBFM on the other hand showed a significant negative correlation with four out of the six nerves evaluated. Similarly, with the sensory NCV, the BMI was able to show a significant correlation with just two nerve that is the left sural and right median whereas the total body fat was again significantly correlated with four of the nerves that is the right and left median and right and left sural nerves. In the earlier studies, the authors have reported a decrease in the motor as well as sensory NCV in the type 2 diabetics when compared to normal subjects. The same comparison is not done here, as this study mainly focuses on the correlation of the NCV with that of BME and TBFM [11].
The present study provides evidence that evaluating the risk of type 2 diabetes complications even in normal BMI subjects should include measurement of TBFM. The epidemiological studies that analyse the association between total body fat and type 2 DM are scarce, despite of the fact that the risk of type 2 diabetes increased when there is excess adiposity. The study could not find any previous studies that correlated the actual body fat mass with NCV in type 2 diabetic individuals. In one of the recent studies by Oh TJ et al., the authors studied the correlation of TBFM with the neuropathy status in type 2 diabetes patients, however they correlated the body fat mass with the Michigan Neuropathy Screening Instrument (MNSI) scores and insulin resistance but not with the nerve conduction study parameters. They concluded that physical examination including body fat estimation might be more useful in clinical practice than questionnaire-based evaluation in diabetics subjects with obesity [12].
Cinar N et al., reported in Malaysian subjects a reduction in velocities of the median, ulnar (except sensory NCV), common perineal, and sural nerves in different BMI groups. They therefore concluded that BMI can influence the NCV’s [13]. Naik BM et al., observed a tendency toward delay or slowing in impulse transmission in nerve fibres in obese individuals in comparison to non-obese subjects, and it was suggested that obesity per se has some degree of deleterious influence on axonal functions [14]. Chadha V et al., reported that a possible reason for decreased conduction velocity and amplitude of action potential in obese subjects with higher BMI can be the attenuation in conduction current by thicker subcutaneous tissue [15]. The findings of the current study is in concordance with the above studies.
Findings of the present study are in contrast to a study done by Pawar SM et al., which reported a positive correlation of BMI with NCV. They cited that increased NCV in people with higher BMI might be because of epineural fat which acts as insulator for the nerve and thus maintains the optimum temperature, which is one of the most important factors affecting nerve conduction parameters [16].
According to Yajnik K et al., BMI does not seem to affect the NCV parameters particularly. They found a mild positive correlation between BMI and NCV however the correlation was non-significant [17]. The result is also in contrast with the present study, where it was found a negative correlation of BMI with the NCV both motor and sensory.
The body fat distribution in Obese type 2 diabetics and obese non-diabetics shows a characteristic difference, the obese type 2 diabetics have an unfavourable body fat distribution with an increase in visceral fat. Adipose tissue from visceral fat is found to be associated with inflammation and oxidative stress. BMI is unable to give an estimate of visceral fat deposition and hence, it lacks the credibility of being a good screening test. Imaging techniques like Computed Tomography (CT) scan, magnetic resonance imaging and dual X-ray absorptiometry provides accurate body fat analysis but their high cost makes them an ineffective tool more, so in the Indian context. Moreover, a study has revealed that CT scan provides comparable result to BIA in measuring total body fat [18]. In the current study, BIA analysis to measure the total body fat was used and found that majority of the NCV values showed a strong and significant negative correlation with it as compared to BMI. The study therefore hypothesised that even though BMI, is used as a simple mean to define obesity, it does not actually demarcate between fatty and fat-free mass and do not give any qualitative inference. Further research in the field should employ a large multicentric research to ascertain the cut-off point of TBFM by Receiver Operative Curve (ROC) analysis to get a sensitive predictor of neuropathy onset in diabetics. Moreover, clinical trials can be undertaken to assess whether weight loss interventions improve the neuropathy severity in diabetics or not.
Limitation(s)
This study has a few limitations. First, a relatively small sample was analysed and hence, the results drawn cannot be a reliable representation of the whole population. Second is its cross-sectional design; which makes it impossible to examine the time course of the development of the observed differences, thus limiting us to speculation.
Conclusion(s)
BMI, a traditional tool normally used to assess body fat to define normal weight or overweight in a clinical setting, provides qualitative inference and is not a reliable marker of obesity. TBFM as assessed by BIA analysis shows a stronger correlation with the NCV as compared to the BMI and should therefore be used clinically along with electrophysiological studies for the risk factor stratification of diabetic peripheral neuropathy in type 2 diabetic patients. The authors suggest, in future, a multicentre prospective longitudinal study should be done to confirm the findings of the present study.
Source of funding: The research is a part of the Indian Council of Medical Research (ICMR) sponsored Short term Studentship (STS) project.
N=90; T2DM: Type 2 diabetes mellitus; BP: Blood pressure; SD: Standard deviation
*Asia-pacific population cut-off [10]; BMI: Body mass index; SD: Standard deviation
(Significant p-value at <0.05)
(Significant p-value at<0.05)
*p-value <0.05
*p-value <0.05