Alcoholism is a global health concern and India is one of the largest producers of alcohol in the world. There has been a steady increase in its production over the last 15 years [1]. The consumption of alcohol by Indians was 2.4 liters in 2005, but in 2010 it increased to 4.3 liters and further scaled up to 5.7 litres in 2016, according to the global status report on alcohol and health 2018 released by the World Health Organisation (WHO) [2].
Alcoholism affects each and every member of the family including young or grown up children, spouse of an alcoholic, siblings and other relatives [3]. Mostly, spouse of an alcoholic face lot of problems like arguments, role changes, conflicts, quarrels, physical violence, marital discord, divorce and even suicide [4].
Alcoholism also has negative psychological effects on family members of an alcoholic. The spouses of the alcoholics may have the feeling of hated, social contact avoidance, self pity and may become physically and mentally sick [5]. Mostly, the spouse has to shoulder the roles of both parents which lead to painful chaos in managing family alone [6].
A community-based cross-sectional study was carried out to measure the prevalence and determinants of alcohol consumption among adults in Pondicherry [7]. Results showed that prevalence of alcohol consumption was found to be 59.6%. Determinants like lower literacy level, family history of alcohol consumption, and cigarette smoking were positively associated with alcohol consumption [7].
Alcoholism also leads to disharmony in the family and studies proved that the spouses are undergo various psychosocial problems in their life [8].
Hence, the present study envisaged identifying the QOL of spouses of alcoholics and based on that researcher set a plan to prevent this serious threat by adopting various health promotional strategies like yoga and health education to promote the QOL among spouses of alcoholics.
Research hypothesis: The health promotional strategies (Yoga and Health education) affect the Quality of Life (QOL) of the spouse of alcoholics. Also, there was a significant association between the post-test QOL scores and selected demographic variables.
Null hypothesis: The health promotional strategies (Yoga and Health education) do not affect the Quality of Life (QOL) of the spouse of alcoholics. Also, there was no significant association between the post-test QOL scores and selected demographic variables.
Materials and Methods
To meet the objectives of the study a quantitative approach with quasi experimental pre-test post-test control design was adapted and the study was carried out during July 2017 to April 2019. The project was examined and approved by the Father Muller Institutional Ethics Committee (FMMC/FMIEC/2907/2016). The study was conducted in two villages of Mangalore and Bantwal taluks of Dakshina Kannada District. Investigator did house to house survey with the help of social workers, Anganwadi workers, ASHA (Accredited Social Health Activist) workers, ANMs (Auxillary Nurse Midwife), Mahila mandal representatives to identify the houses of alcoholics after obtaining permission from the concerned authority.
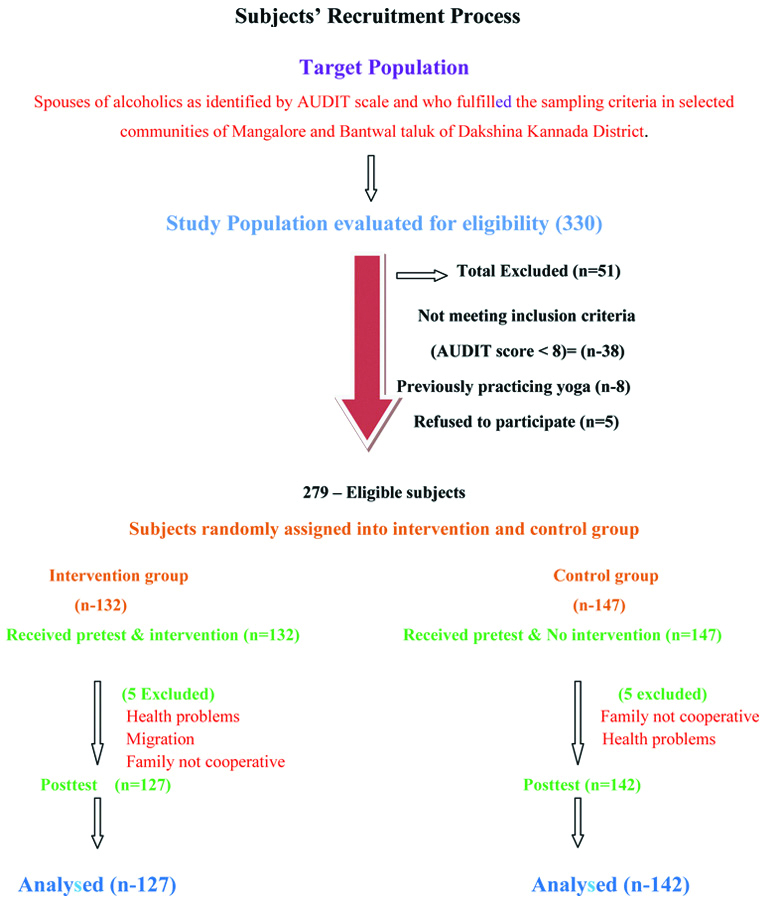
AUDIT [9] is a standardised, valid and reliable free to use instrument consisting of 10 items with five options scored (0-4) to identify the alcoholics. Maximum score can be 40 and scores in the range of 8-15 represented individuals with medium level of alcohol problems/alcoholics. AUDIT was translated in the local language by the investigator herself and its reliability was measured. The Cronbach’s Alpha value obtained was 0.85. Tool was administered to 330 men by the investigator through house to house visit; of which 279 men were identified as alcoholics. The study included the spouse of these alcoholic men who were residing with the husband and not consuming alcohol. The spouses of alcoholics who were diagnosed as having psychological problems, separated from husband and already practicing yoga were excluded from the study. The sample size was found to be adequate, based on an earlier work in 2013-2014 [10]. These identified 279 spouses of alcoholics were allotted to intervention and control group by simple randomisation technique using coin toss method. Heads were assigned to intervention group and tails to the control group. Since more tails were observed while tossing the coin there was difference in sample size in both the groups. The nature and purpose of the study was explained by participant information sheet and informed consent was obtained.
The subjects were administered demographic proforma and WHOQOL-BREF scale. Demographic proforma included age, religion, education status, type of family as per income, occupation, monthly income, type of family, place of residence, family support, social support, duration of marital life, number of children, primary decision maker, years of husband drinking alcohol and history of domestic violence. World Health Organisation QOL (WHOQOL-BREF) [11] tool is a standardised, valid and reliable tool. It consists of 26 items with five options scoring (1-5) in 4 Domains: Physical (Domain 1), Psychological (Domain 2), Social (Domain 3) and Environmental (Domain 4). Scores of all four domains denote an individual’s perception of QOL. WHOQOL-BREF is a pre validated with high intra-rater reliability for the total WHOQOL-BREF [12] and its subscales (ICC or Intraclass correlation coefficient range: 0.84-0.930). Inter-rater reliability was moderate for the total WHOQOL-BREF and its sub scales (ICC range: 0.56-0.95) Kannada version [13] and internal consistency was measured by using Cronbach’s alpha (0.94). QOL mean scores of all four domains were calculated based on the raw scores. Higher domain scores denote higher QOL.
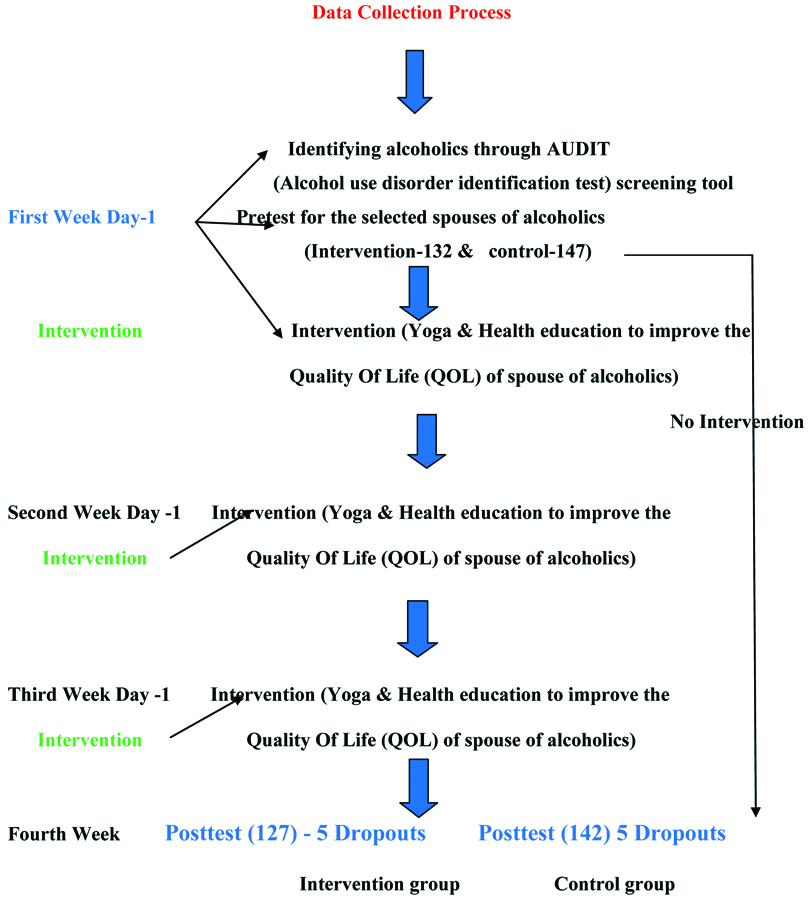
The investigator had undergone yoga training and Health promotion training by National Institute of Health and Family Welfare (NIHFW), New Delhi prior to the study. Hence the investigator herself was competent to demonstrate yoga for 15 minutes, health teaching regarding stress management, marital harmony, lifestyle balancing, behavioural modification and health problems faced by spouses of alcoholics and different coping strategies such as yoga, breathing exercises, good nutrition, spiritual aspects in physical, psychological, social and environmental areas for about 45 minutes to the subjects, once in a week for three consecutive weeks followed by post-test on 4th week. The recruitment of subjects, duration and implementation of interventional strategies is depicted in the flow chart given in [Table/Fig-1,2].
Subjects’ recruitment process.
Implementation of interventional strategies and data collection process.
Statistical Analysis
The collected data was analysed using descriptive and inferential statistics. The data were analysed through SPSS version 18.0. Independent t-test was performed to determine the effectiveness of health promotion strategies on QOL scores between intervention and control group at p-value 0.05 level of significance and chi-square test was computed to find the association between post-intervention QOL scores and selected demographic variables at 0.05 level of significance.
Results
Description of Sample Characteristics
Majority 73 (55.3%) of the subjects belonged to the age group of 36 years and above in the intervention group and 89 (60.5%) in control group. Most of the subjects 114 (86.4%) of them belonged to Hindu religion in intervention group and 124 subjects (84.4%) in control group. With regard to educational status, majority 73 (55.3%) had primary education in intervention group and 91 (61.9%) in control group . Most 104 (78.8%) of the family belonged to BPL family in intervention group whereas in control group 110 (74.8%). About 97 (73.5%) were daily wagers in intervention group and 110 (74.8%) in control group. Around 47 (35.6%) had income of Rs.10,001 to 15,000 in intervention group and in control group 67 (45.6%) had income of Rs. 10, 001 to 15,000 per month. Also, 55 (41.7%) subjects had a nuclear family in intervention group and 59 (40.1%) in control group. Place of residence of 61 (46.2%) subjects was rural in intervention group and 58 (39.5%) in control group. About 56 (42.4%) of the subjects had moderately adequate family support in intervention and whereas in control group it was 53 subjects (36.1%). Majority of them, 87 (65.9%) had social support from social organisations in intervention group whereas 107 (72.8%) has social support in control group. Duration of marital life of subjects was more than 10 years in 87 (65.9%) subjects in intervention group and 100 (68%) in control group. Number of children in 57 (43.2%) individuals were two in intervention group and 63 (42.9%) in control group. Primary decision maker in the family, in both the groups majority had both partners as decision makers by mutual consent in intervention group 92 (69.7%) and in control group 86 (58.5%), respectively. For about 50 (37.9%) subjects, duration of alcohol intake by spouse was about 6-10 years in intervention. History of domestic violence was present in 25 (18.9%) subjects’ households in intervention group and 30 (20.4%) in control group [Table/Fig-3].
Frequency and percentage distribution of subjects according to their demographic characteristics. P-value to check the homogeneity with respect to demographic characters.
| S. No. | Variables | Experimental group (n=132) | Control group (n=147) | p-value |
|---|
| | f | % | f | % | |
|---|
| 1 | Age (in years) |
| <20 | 0 | 0 | 0 | 0 | 0.093 |
| 20-25 | 3 | 2.3 | 1 | 0.7 |
| 26-30 | 21 | 15.9 | 11 | 7.5 |
| 31-35 | 35 | 26.5 | 46 | 31.3 |
| 36 and above | 73 | 55.3 | 89 | 60.5 |
| 2 | Religion |
| Hindu | 114 | 86.4 | 124 | 84.4 | 0.832 |
| Muslim | 6 | 4.5 | 9 | 6.1 |
| Christian | 12 | 9.1 | 14 | 9.5 |
| 3 | Educational status | |
| No formal education | 35 | 26.5 | 25 | 17.0 | 0.122 |
| Primary school | 73 | 55.3 | 91 | 61.9 |
| Secondary school | 12 | 9.1 | 16 | 10.9 |
| High school | 8 | 6.1 | 14 | 9.5 |
| PUC | 3 | 2.3 | 0 | 0.0 |
| Graduation | 1 | 0.8 | 0 | 0.0 |
| Postgraduate and above | 0 | 0 | 1 | 0.7 |
| 4 | Type of family as per income [14] | |
| APL | 28 | 21.2 | 37 | 25.2 | 0.435 |
| BPL | 104 | 78.8 | 110 | 74.8 |
| 5 | Occupation | |
| Home maker | 29 | 22.0 | 29 | 19.7 | 0.938 |
| Daily wages | 97 | 73.5 | 110 | 74.8 |
| Business | 4 | 3.0 | 6 | 4.1 |
| Technical | 2 | 1.5 | 2 | 1.4 |
| Professional | 0 | 0 | 0 | 0 |
| 6 | Monthly income of the family (in rupees) | |
| Less than 5000 | 2 | 1.5 | 0 | 0.0 | 0.186 |
| 5000-10000 | 46 | 34.8 | 43 | 29.3 |
| 10001-15000 | 47 | 35.6 | 67 | 45.6 |
| >15000 | 37 | 28.0 | 37 | 25.2 |
| 7 | Type of family |
| Nuclear | 55 | 41.7 | 59 | 40.1 | 0.138 |
| Joint | 40 | 30.3 | 59 | 40.1 |
| Extended | 37 | 28.0 | 29 | 19.8 |
| 8 | Place of residence | |
| Rural | 61 | 46.2 | 58 | 39.5 | 0.035* |
| Semi urban | 60 | 45.5 | 61 | 41.5 |
| Urban | 11 | 8.3 | 28 | 19.0 |
| 9 | Family support | |
| Not at all | 9 | 6.8 | 12 | 8.2 | 0.660 |
| A little | 48 | 36.4 | 59 | 40.1 |
| Moderately adequate | 56 | 42.4 | 53 | 36.1 |
| Good support | 19 | 14.4 | 23 | 15.6 |
| 10 | Social support | |
| Family members | 5 | 3.8 | 12 | 8.2 | 0.142 |
| Relatives | 33 | 25.0 | 25 | 17.0 |
| Friends | 5 | 3.8 | 2 | 1.4 |
| Social organisations | 87 | 65.9 | 107 | 72.8 |
| Neighbours | 2 | 1.5 | 1 | 0.7 |
| 11 | Duration of marital life (in years) |
| <5 | 10 | 7.6 | 6 | 4.1 | 0.455 |
| 5-10 | 35 | 26.5 | 41 | 27.9 |
| >10 | 87 | 65.9 | 100 | 68.0 |
| 12 | Number of children | |
| None | 9 | 6.8 | 11 | 7.5 | 0.764 |
| One | 33 | 25.0 | 43 | 29.3 |
| Two | 57 | 43.2 | 63 | 42.9 |
| 3 and above | 33 | 25.0 | 30 | 20.4 |
| 13 | Primary decision maker in the family | |
| Husband | 40 | 30.3 | 60 | 40.8 | 0.110 |
| Wife | 0 | 0.0 | 1 | 0.7 |
| Mutual consent | 92 | 69.7 | 86 | 58.5 |
| 14 | Since how many years your husband is drinking alcohol | |
| <1 | 2 | 1.5 | 1 | 0.7 | 0.926 |
| 1-5 | 37 | 28.0 | 41 | 27.9 |
| 6-10 | 50 | 37.9 | 57 | 38.8 |
| >10 | 43 | 32.6 | 48 | 32.7 |
| 15 | History of domestic violence | |
| Present | 25 | 18.9 | 30 | 20.4 | 0.758 |
| Absent | 107 | 81.1 | 117 | 79.6 |
chi-square*p<0.05 significant; *p<0.001 statistically highly significant
APL: Above poverty line; BPL: Below poverty line; PUC:Pre university course
Assessment of Quality of Life (QOL) of Subjects in Intervention and Control Group
The data presented in [Table/Fig-4] depicts that mean % QOL scores in intervention and control groups pre-test and post-test for all QOL domains i.e., Physical, Psychological, Social and Environmental. It showed that there was an increase in mean percentage of QOL scores before and after the intervention.
Mean, Standard deviation and Mean % of domain wise QOL of subjects in pre and post-test.
| Domains of QOL | Intervention group | Control group |
|---|
| Mean | SD | Mean % | Mean | SD | Mean % |
|---|
| Pre-testn=279Intervention group-132Control-147 | PhysicalPsychologicalSocialEnvironmental | 11.739.435.0413.10 | 2.0291.7861.2062.529 | 33.5331.4233.6032.74 | 11.439.364.9113.04 | 1.9431.4381.3632.393 | 32.6731.2032.7532.59 |
| Post-test n=269InterventionGroup-127Control-142 | PhysicalPsychologicalSocialEnvironmental | 19.2716.698.5423.64 | 3.4392.6201.8453.413 | 55.0755.6556.9459.09 | 11.299.404.6812.46 | 1.8661.5931.2572.485 | 32.2731.3231.2331.14 |
Effectiveness of Health Promotional Strategies on Quality of Life (QOL) of Subjects
In order to find out the effectiveness of Health promotional strategies on QOL of subjects, independent t-test was used. The data presented in [Table/Fig-5] shows that there was a significant difference in the change from pre to post-test score between intervention (-28.847±4.92) and control group (0.912±0.55). In the intervention group, there was improvement in the QOL scores, however in the control group, there was slight deterioration in the QOL scores. Calculated t-value of (34.04) with p<0.001** inferred that Health promotional strategies improved the QOL of subjects in intervention group compared to control group.
Mean±Standard deviation and t-value to determine effectiveness of health promotion strategies on Quality of Life (QOL) scores between in experimental and Control group.
| Group | Mean±SD | Mean difference±SD difference | t-value | df | p-value | Comparison of difference between the groups (post-test scores) |
|---|
| t-value | p-value |
|---|
| Intervention | Pre-test | 39.30±4.335 | -28.847±4.921 | 18.45 | 131 | 3.357<0.001HS | 34.04 | <0.001 |
| Post-test | 68.15±9.256 |
| Control | Pre-test | 38.74±3.71 | 0.912±0.55 | 3.74 | 146 | 3.357<0.001 |
| Post- test | 37.83±4.26 |
Independent t-test conducted to find the effectiveness
p-value <0.001
Association of post-test QOL Scores with Selected Demographic Variables
Chi-square test was computed to determine the association between the post-test scores of QOL with selected demographic variables [Table/Fig-6]. The study findings showed that there was a significant association between post-test QOL scores of subjects and selected variables such as primary decision maker of the family (p=0.002*) and history of domestic violence (p=0.030*). Hence, the null hypothesis which stated that there was no significant association of post-test QOL scores of spouses of alcoholics with selected demographic variables was rejected and research hypothesis was accepted.
Association between the post-test quality of life of wives of alcoholics and selected demographic variables.
| Sl. No. | Variables | Observed values | Chi Square | df | p-value |
|---|
| <Median (66) | ≥Median (66) |
|---|
| 1 | Age in (years) | | | 0.044 | 1 | 0.834NS |
| 20-35 | 25 | 32 |
| 36 and above | 32 | 38 |
| 2 | Religion |
| Hindu | 50 | 60 | 0.109 | 1 | 0.741NS |
| Others | 7 | 10 |
| 3 | Educational status |
| No formal education | 10 | 23 | 4.735 | 2 | 0.094NS |
| Primary school | 33 | 37 |
| Secondary to professionals | 14 | 10 |
| 4 | Type of family as per income |
| APL | 09 | 19 | 2.356 | 1 | 0.125NS |
| BPL | 48 | 51 |
| 5 | Occupation |
| Homemaker | 15 | 14 | 0.711 | 1 | 0.399NS |
| Others | 42 | 56 |
| 6 | Monthly income of the family (in rupees) |
| <5000-10000 | 16 | 27 | 2.012 | 2 | 0.366NS |
| 10001-15000 | 24 | 22 |
| Above 15000 | 17 | 21 |
| 7 | Type of family |
| Nuclear | 24 | 27 | 0.164 | 2 | 0.921NS |
| Joint | 17 | 22 |
| Extended | 16 | 21 |
| 8 | Place of residence |
| Rural | 26 | 31 | 0.578 | 2 | 0.749NS |
| Semi urban | 25 | 34 |
| Urban | 06 | 05 |
| 9 | Family support |
| Not at all and little | 23 | 34 | 5.258 | 2 | 0.072NS |
| Moderately adequate | 22 | 31 |
| Good support | 12 | 05 |
| 10 | Social support |
| Family members, relatives and friends | 18 | 16 | 1.517 | 2 | 0.468NS |
| Social organisations | 36 | 48 |
| Others | 03 | 06 |
| 11 | Duration of marital life (in years) |
| <5-10 | 21 | 24 | 0.090 | 1 | 0.765NS |
| >10 | 36 | 46 |
| 12 | Number of children |
| None and one | 20 | 22 | 0.217 | 2 | 0.897NS |
| Two | 23 | 29 |
| Three and above | 14 | 19 |
| 13 | Primary decision maker in the family |
| Husband | 09 | 29 | 9.849 | 1 | 0.002S* |
| Mutual consent | 48 | 41 |
| 14 | Years of husband drinking alcohol |
| <1-5 years | 15 | 23 | 0.644 | 2 | 0.725NS |
| 6-10 years | 23 | 26 |
| >10 years | 19 | 21 |
| 15 | History of domestic violence |
| Present | 06 | 18 | 4.729 | 1 | 0.030S* |
| Absent | 51 | 52 |
Chi-square test conducted to find association; p=0.05 level of significance; *significant; S: Statistically significant; NS: Not significant
There was no significant association between post-test QOL scores of subjects and rest of the variables such as age, religion, education status, type of family as per income, monthly income, occupation, type of family, place of residence, family support, social support, duration of marital life, number of children, years of husband drinking alcohol. Hence, the null hypothesis was accepted, and research hypothesis was rejected.
Discussion
The present study focussed on adopting various health promotional measures to improve the QOL of spouses of alcoholics. The study findings revealed that mean post-test QOL scores of all the domains were increased compared to mean pre-test QOL scores in the intervention group. This suggested that most of the spouse of alcoholics had poor QOL and they had various physical, psychological and social problems.
A study was conducted on perceived QOL among wives of alcoholic and non alcoholics. The study findings revealed that majority (66.7%) of the wives of the alcoholics reported that they had low level perceived QOL compared to wives of non alcoholics [15].
Another similar study was conducted to assess the QOL of wives of alcoholics in Perambalur district. The study results showed that Overall QOL of the respondents (52%) was low level with regard to various dimensions of QOL [16].
The present study also showed that there was a significant difference in mean scores of pre-test and post-test in intervention group compared to control group. Hence, it can be inferred that health promotional strategies were effective in improving QOL of subjects.
A study was conducted to assess the community based nursing intervention strategies on alcohol dependence and QOL among alcoholics by using WHOQOL-BREF. The study findings revealed that mean differences between pre-test and post-test overall QOL, was 23.93 with t-value 32.99. These scores were highly significant at p<0.001 suggesting that community based nursing intervention strategies such alcohol education was effective in reducing alcohol dependence [17].
A similar study was conducted to evaluate the effectiveness of pranayama on reduction of anxiety level among alcoholics A quasi-experimental pre-test, post-test design was used. A total of 60 subjects were selected for the study using probability purposive sampling technique, of which 30 samples each assigned to both experimental group and control group. Fifteen minutes of Pranayama was administered for the experimental group. Results of the study showed effectiveness of pranayama on level of anxiety among alcoholics. The obtained t-value was 23.69 (p<0.001), which suggested that pranayama helps in decreasing the level of anxiety among alcoholics [18].
A pilot randomised controlled trial was undertaken to investigate the effect of a yoga intervention on alcohol and drug abuse behaviours in women with Post-traumatic Stress Disorder (PTSD). Subjects were selected by using AUDIT and Drug Use Disorder Identification Test (DUDIT). Twelve-session yoga intervention was given, followed by 1-month follow-up. Linear mixed models were used to test the significance of the change in AUDIT and DUDIT scores over time. Results of the study revealed that while there was a decrease in the mean AUDIT and DUDIT scores in the yoga group, in the control group, mean AUDIT scores were increased, while no difference was noted for mean DUDIT scores. Most yoga group participants reported a reduction in symptoms and showed improved symptom management. Hence, it was inferred that yoga may play a role in attenuating the symptoms of PTSD and reducing risk of alcohol and drug use [19].
The present study findings also showed that there was a significant association between post-test QOL scores of subjects and selected variables such as primary decision maker of the family (p=0.002) and history of domestic violence (p=0.030).
An exploratory study was conducted to assess the psychosocial problems of wives of alcoholic dependents of selected community. Subjects were selected purposively and assessed using rating scale on psychosocial problems. Results revealed that there was a significant association of psychosocial problems with duration of marriage (p-value=0.006), number of children (p-value=0.002), duration of alcohol consumption (p-value=0.0001) and history of domestic violence (p-value=0.0001). Study concluded that wives were suffering from one or other problems due to alcoholic husband in their life [4].
Limitation(s)
The yoga practiced by the spouse of alcoholics at home could not be monitored and the control group could not be taught yoga because of the nature of the study.
Conclusion(s)
Alcoholism is a major familial and social problem in India. The present study highlighted the problems faced by the family members specially the spouses of alcoholics in terms of their QOL. With this aim, the investigator adopted various health promotional measures such as yoga and health education for the spouse alcoholics there by to improve the QOL among spouses of alcoholics. This study suggested that practicing yoga and health awareness can help in improving the QOL.