The CMBs represent small areas of blood-breakdown products (haemosiderin, deoxyhaemoglobin and methaemoglobin) deposition adjacent to small arteries, which owing to the paramagnetic properties, exhibit significant magnetisation under MRI field [1,2].
CMBs are neither detected on CT nor on T1 weighted, T2 weighted or Fluid Attenuated Inverse Recovery (FLAIR) MRI sequences. Even catheter angiography, which is considered gold standard, fails to detect such lesions [3].
CMBs were first described after the clinical use of gradient MRI and are typically demonstrated on T2*-weighted GRE imaging (T2* GRE) and SWI that are sensitive to the susceptibility effects of iron atoms contained within haemosiderin [4].
Radiologically, following MRI, CMBs appear as discrete, round or oval hypointense foci, distinct from vascular flow voids, meningeal haemosiderosis, or non haemorrhagic subcortical mineralisation that are not consistent with bones, vessels, or MRI artifacts. CMBs indicate previous extravasation of blood, generally associated with local vessel wall damage [1,2]. Various studies have reported CMBs to be <10 mm in diameter on T2* GRE [4]. The prevalence of CMBs on MRI vary from 3.1-23.5% [5].
T2*-weighted sequences i.e., T2*GRE and SWI are iron-sensitive sequences which enhance the susceptibility effect caused by haemosiderin, thus increasing the sensitivity for detection of micro and macro haemorrhages [3,4]. In the presence of blood-breakdown products, these sequences result in signal dropout or areas of dephasing, the so called “blooming effect” which appear as dark or hypointense areas, leading to their detection and characterisation [4,6,7].
The SWI is a high-resolution 3D GRE MRI sequence which uses a flow compensated (usually applied along all axes), long echo, GRE pulse sequence that utilises magnitude and filtered-phase data, both individually and in combination with each other to acquire images [6].
The two most consistent predictors of CMBs include ageing process and chronic hypertension. Other frequently reported risk factors include diabetes, smoking and hypercholesterolemia which increase the likelihood of occurrence of CMBs. CMBs were initially assumed to be asymptomatic, however with advances in medical care, they are not only regarded as probable markers of small vessel disease, but have also been implicated in other manifestations like Alzheimer’s disease, cognitive impairment and stroke [4,7,8]. Thus, it is essential to differentiate CMBs from its various ‘mimics’ for evaluation of prognostic and therapeutic implications of CMBs. These ‘mimics’ closely resemble CMBs on routine MR sequences i.e., T1WI, T2WI and T2* GRE and can be categorised as those containing blood products (e.g., vascular flow voids, diffuse axonal injury, cavernous malformations) and those that do not contain blood products (e.g., calcium, manganese, partial volume artefacts from adjacent bony structures, air embolism) [9,10].
The distinct benefit of SWI over T2* GRE has been recognised in discrimination of these CMB ‘mimics’ and true microbleeds. SWI images can be displayed as a minimum intensity projection that provides high resolution delineation of the cerebral venous architecture, a feature that is not available in any other MRI techniques [10].
With this background, the present study was undertaken to evaluate CMBs on MRI and to compare the sensitivity of SWI and T2* GRE sequences in detection of these microbleeds. In addition, association between topography (size, number and location) of CMBs and various risk factors was also evaluated. CMBs are an asymptomatic precursor of intracranial haemorrhage, and their presence increases the risk of (recurrent) ischemic stroke and cognitive decline [7]. We believe that the findings of this study will help in better understanding of association between CMB topography and major risk factors. As most of these risk factors are modifiable, the knowledge gained from this research will aid clinicians in early identification of patients at increased risk of serious neurological complication attributable to occurrence of CMBs.
Materials and Methods
The present prospective observational analytical study was conducted in the Department of Radiodiagnosis and Imaging in a tertiary care hospital in the north India for a period of two years from (January 2016 to January 2018) and comprised of 67 patients. Approval of the Institutional Ethical Committee was taken to conduct this study (Ref No. IEC/63/15). The patients were recruited in the study only after obtaining written consent from them and/or their caregivers. Relevant clinical history was taken emphasising history of hypertension, smoking, diabetes mellitus, hypercholesterolemia (hyperlipidemia), and heart disease.
All patients with CMBs detected on MRI were included in study. Patients with diffuse axonal injury secondary to trauma, coexistent brain tumours and prior brain surgery were excluded.
A total of 100 patients with CMBs were recruited and evaluated. Thirty three patients (33%) were excluded from further analysis due to protocol violation or consent withdrawal.
The equipment used for the study was a Siemens MRI machine-Magnetom Avanto TIM (Total Imaging Matrix) with 1.5 Tesla Magnet (Magnetom, Siemens, Erlangen, Germany). All scans were performed in supine position with head first into the machine. The imaging protocol consisted of (in addition to routine sequences i.e. T2W FSE, T1W SE, FLAIR, DWI) T2*-weighted GRE sequence (TR/TE=800/26 ms, flip angle= 5-20°) and SWI (TR/TE=54/40 ms, FOV=288 mm, flip angle=15°).
The T2W sequences were acquired in all three orthogonal planes (axial, coronal and sagittal) while, for all other sequences, images were acquired only in the axial plane. Both magnitude and filtered-phase RP images were generated for SWI and T2* GRE sequences.
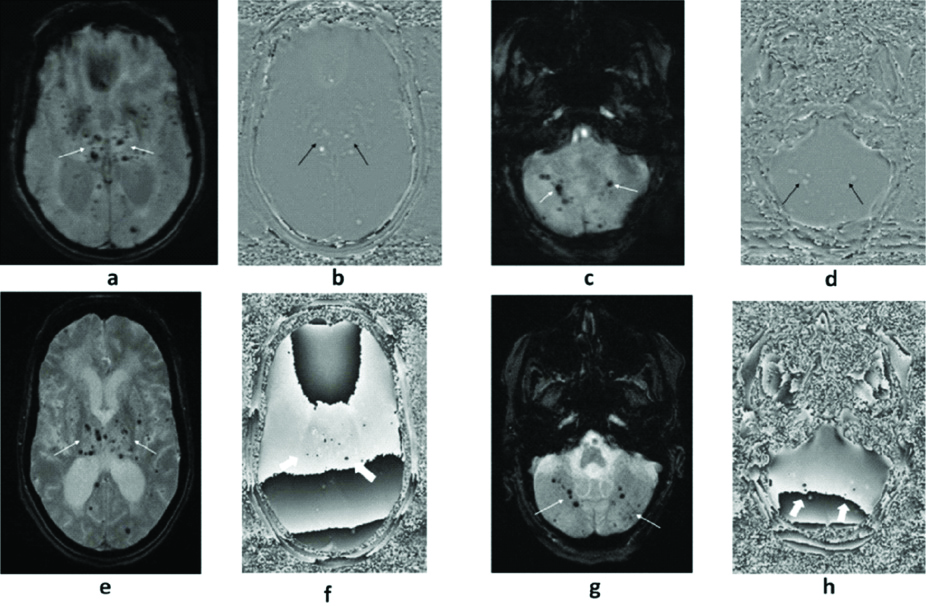
CMBs were identified as discrete, small, round or oval, homogenous, hypointense foci of blooming within the brain parenchyma with clear margins, which measure less than 10 mm in widest diameter (1-10 mm range) on magnitude SWI and T2* GRE. [Table/Fig-1] showing a positive/hyperintense signal on RP images [4].
(a to h): A 63-year-old hypertensive and diabetic female who underwent MRI with SWI (a to d) and T2*GRE (e to h) sequences. Multiple foci of blooming are noted in bilateral deep grey nuclei, cerebral and cerebellar hemispheres (thin white arrows) on magnitude SWI (a&c) with a positive signal on RP SWI (b&d) suggestive of CMBs (thin black arrows). In the same patient and at the same slice section, CMBs are clearly demonstrated on magnitude T2*GRE (thin white arrows in e&g) but difficult to delineate (thick white arrows) on its RP (f&h).
Depending on the location, CMBs were categorised as follows:
Lobar (Cortex and/or subcortical white matter in frontal, parietal, temporal and occipital regions).
Deep (Basal ganglia, thalamus, internal capsule, external capsules).
Infratentorial (Brainstem and cerebellum).
Intracranial calcification(s) were recognised as signal void areas on magnitude SWI and T2* GRE showing a negative/hypointense signal on RP images [17].
Two observers (labelled O1 and O2), blinded to clinical information, independently reviewed the T2*GRE and SWI sequences (using the magnitude and phase-filtered images). Observer 1 (O1) was a radiologist with 5 years of experience and Observer 2 (O2) was a radiology resident with 3 years of experience.
The T2* GRE and SWI sequences for each patient were reviewed randomly and at least 6 weeks apart, to reduce the bias that may result from interpretation of the first image.
Both observers recorded the topographical details of CMBs which included presence, number, size and location.
Statistical Analysis
Cohen’s Kappa (κ) was calculated to measure agreement between the raters (Inter-rater agreement) for the number of CMBs on SWI and on T2*GRE. The ‘κ’ values were interpreted as [18]:
0-0.20: Poor agreement
0.21-0.40: Fair agreement
0.41-0.60: Moderate agreement
0.61-0.80: Good agreement
0.81-0.99: Very good agreement
1.0: Perfect agreement.
Also, ICC was used for reliability index in test-retest, intra-rater and inter-rater reliability analyses. The intra-rater reliabilities of each rater were compared. ICC describes how strongly units in the same group resemble each other.
The ICC values were interpreted as [19]:
0-0.5: Poor reliability
0.5-0.75: Moderate reliability
0.75-0.9: Good reliability
>0.90: Excellent reliability
The correlations between CMBs and risk factors was also performed with Pearson’s correlation Coefficient (r). The p-value <0.05 was considered statistically significant. The strength of the correlation for the absolute value ‘r’ was assessed as follows [20]:
0.00-0.19: Very weak
0.20-0.39: Weak
0.40-0.59: Moderate
0.60-0.79: Strong
0.80-1.0: Very strong
The statistical analysis was performed using SPSS software (version 21.0). Descriptive analysis was used and the data was represented in the form of charts, tables.
Results
The study comprised of patients ranging from 50 to 86 years of age. The mean age of patients was 66.16±9.38 years. Majority of patients belonged to age group of 70-79 years i.e., 24 (35.8%) while least belong to 80 years and above i.e., 6 (8.9 %). A total of 47 (70.1%) patients were males and remaining females. Fifty-one (76.1%) patients were hypertensive and forty-six (68.6%) were diabetic while coexistent hypertension and diabetes was also found in a considerable number of patients (n=43; 64.2%). Thirty (44.8%) patients were smokers and 17 (25.4%) patients had hyperlipidemia. Topography of CMBs was assessed only based on major risk factors and not their combinations, for the sake of simplicity and ease of highlighting the most important risk factor.
So, coexistence of hypertension and diabetes was not included for assessment of topography.
Topographical analysis of CMBs by both observers
The more experienced observer (O1) identified more number of CMBs on both sequences when compared to less experienced observer (O2) [Table/Fig-2]. Both observers detected higher number of CMBs on SWI sequence (magnitude and RP) as compared to T2*GRE as depicted in [Table/Fig-3,4].
Total number of CMBs on Magnitude and RP T2*GRE and SWI by both observers.
| CMBs | On magnitude T2*GRE | On RP T2*GRE | On Magnitude SWI | On RP SWI |
|---|
| Observer 1 | 1749 | 1202 | 1964 | 1917 |
| Observer 2 | 1671 | 1002 | 1894 | 1841 |
| Average | 1710 | 1102 | 1929 | 1879 |
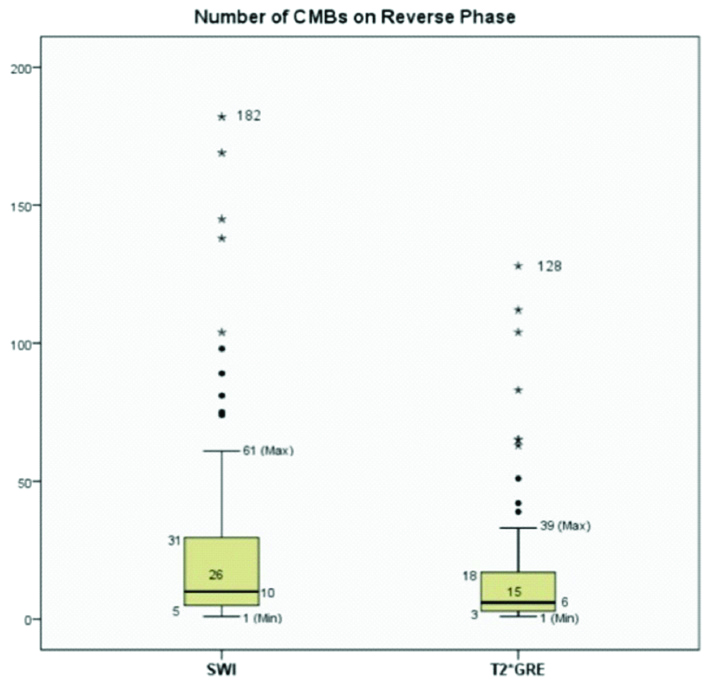
Box-and-whisker plots comparing number of CMBs on RP SWI and RP T2*GRE. The bottom side of the box represents the first quartile/25th percentile (Q1=5 for SWI and 3 for T2*GRE), and the top side, the third quartile/75th percentile (Q3=31 for SWI and 18 for T2*GRE). The vertical width of the central box represents the Inter-Quartile Range (IQR) {26 for SWI and 15 for T2*GRE}. The horizontal line inside the box is the median (10 for SWI and 6 for T2*GRE). The vertical lines protruding from the box extend to the minimum (1 for SWI and 1 for T2*GRE) and the maximum values (61 for SWI and 39 for T2*GRE) of the data set, as long as these values are not outliers. The ends of the whiskers are marked by two shorter horizontal lines. Values higher than Q3+1.5× IQR (maximum 182 for SWI and 128 for T2*GRE) or lower than Q1-1.5×IQR are considered outliers and are plotted above the top whisker or below the bottom whisker.
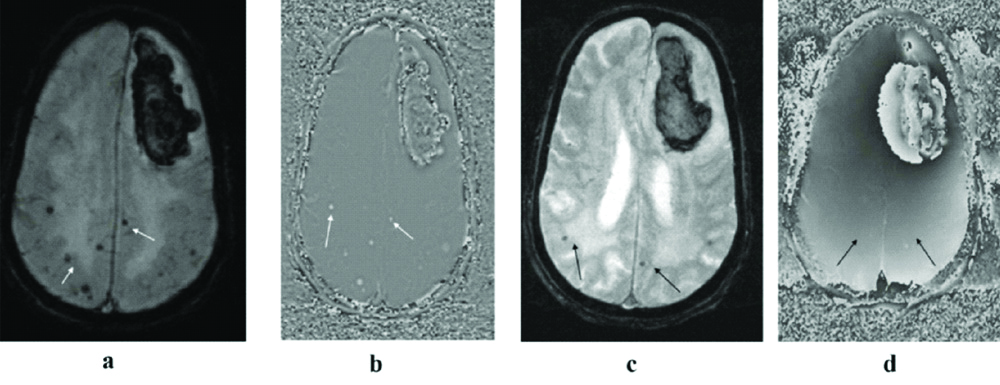
(a to d): MR imaging of 70-year-old smoker and hypertensive male, shows a left frontal Intracerebral hemorrhage (ICH). Multiple CMBs are noted in bilateral parietal regions on SWI (thin white arrows in a & b). In the same patient, at the same slice position, corresponding T2*GRE (c) and its RP (d) fails to demonstrate many of these CMBs due to pronounced susceptibility artefacts (thin black arrows in c&d).
Relative percentage of number of CMBs on T2*GRE by setting mean number of CMBs detected on SWI were calculated as 100% and found that T2*GRE demonstrated only 70.5% of the microbleeds, in comparison to SWI (p=0.001).
The number of CMBs detected by observer 1 on RP SWI varied from 1 to 182 (mean±SD=28.61±41.5) and from 1 to 177 (mean±SD=27.48±39.65) by observer 2 [Table/Fig-5]. On RP T2* GRE, the number of CMBs detected varied from 1 to 128 (mean±SD=17.97±27.57) for observer 1 and from 1 to 109 (mean±SD=14.96±23.55) for observer 2 [Table/Fig-6].
Descriptive statistics of Number of CMBs on RP SWI#
| Variable | Observer 1 | Observer 2 | Average (Observers 1 and 2) |
|---|
| Mean | 28.61 | 27.48 | 28.04 |
| Standard deviation | 41.5 | 39.65 | 40.57 |
| Range | 181 (1-182) | 176 (1-177) | 178.5 (1-179.5) |
#Reverse Phase (RP) of Susceptibility Weighted Imaging (SWI) sequence
Descriptive statistics of number of CMBs on RP T2*GRE#.
| Variable | Observer 1 | Observer 2 | Average (Observers 1 and 2) |
|---|
| Mean | 17.97 | 14.96 | 16.45 |
| Standard deviation | 27.57 | 23.55 | 25.54 |
| Range | 127 (1-128) | 108 (1-109) | 117.5 (1-118.5) |
#Reverse Phase (RP) of T2* Gradient-recalled echo imaging sequence
The mean number of CMBs detected by SWI were significantly higher when compared to T2*GRE (p-values=0.022 and 0.002) using Independent sample Students t-test.
Based on number of CMBs, the study group was subdivided into:-
CMBs less than 5 in number (1-5 CMBs)
CMBs more than 5 in number
Majority of the patients (n=48; 71.6%) had more than 5 CMBs (maximum number of CMBs being 182) and rest were having less than 5.
[Table/Fig-7] shows the total number of CMBs <5 mm or ≥5 mm detected by each observer. RP SWI detected significantly higher number of CMBs in comparison to RP T2* GRE (100% vs 70.5%). So, we choose RP SWI sequence for categorising CMBs according to the size. The number of CMBs of size <5 mm detected by observer 1 on RP SWI varied from 1 to 171 (mean±SD=26.43±39.01) and varied from 1 to 166 (mean±SD=25.30±37.17) by observer 2 [Table/Fig-8]. The number of larger sized CMBs (>5 mm) detected by both observers ranged from 0 to 12 (mean±SD=2.18±3.35) [Table/Fig-9]. It was found that the patients with hypertension (r=0.72) and diabetes (r=0.68) had predominantly larger sized CMBs (≥5 mm) which showed strong correlation in comparison to CMBs <5mm. However, smoking and hyperlipidemia had a weak correlation with size of CMBs [Table/Fig-10].
| Variable | Total number of CMBs <5 mm | Total number of CMBs ≥5 mm | Total |
|---|
| Observer 1 | 1771 | 146 | 1917 |
| Observer 2 | 1695 | 146 | 1841 |
| Average | 1733 | 146 | 1879 |
Descriptive Statistics of number of CMBs of size less than 5 mm on RP SWI.
| Variable | Observer 1 | Observer 2 | Average (O1 and O2) |
|---|
| Mean | 26.43 | 25.30 | 25.87 |
| Standard deviation | 39.01 | 37.17 | 38.10 |
| Range | 170 (1-171) | 165 (1-166) | 168 (1-169) |
Descriptive Statistics of number of CMBs of size more than 5 mm on RP SWI.
| Variable | Observer 1 | Observer 2 | Average (O1 and O2) |
|---|
| Mean | 2.18 | 2.18 | 2.18 |
| Standard deviation | 3.35 | 3.35 | 3.35 |
| Range | 12 (0-12) | 12 (0-12) | 12 (0-12) |
Pearson’s correlation coefficient (r) for the major risk factors with the size of CMBs.
| Major risk factors | CMBs <5 mm | CMBs ≥5 mm | p-value |
|---|
| Hypertension | 0.62 | 0.72 | 0.0001 |
| Diabetes | 0.61 | 0.68 | 0.0001 |
| Smoking | 0.342 | 0.344 | 0.0001 |
| Hyperlipidemia | 0.24 | 0.26 | 0.0001 |
Lobar location of CMBs was most frequent (n=60, 89.6%) followed by the deeper location (n=47, 70.1%). Diabetes and hypertension showed moderate correlation with CMBs in the deep grey nuclei and infratentorial locations and weak to moderate correlation with CMBs in lobar locations. Smoking showed weak correlation with CMBs in lobar locations. However, correlation with CMBs in the deep grey nuclei and infratentorial locations was not found to be statistically significant. The correlation of hyperlipidemia with CMBs was not found to be statistically significant for any location as shown in [Table/Fig-11].
Pearson’s correlation coefficient (r) for the major risk factors with the location of CMBs.
| Risk factors | Lobar | Deep gray nuclei | Infratentorial | |
|---|
| Frontal | Parietal | Temporal | Occipital | Basal Ganglia | Thalamus | Brainstem | Cerebellum | p-value |
|---|
| Hypertension | 0.46 | 0.41 | 0.43 | 0.32 | 0.54 | 0.53 | 0.49 | 0.44 | 0.0001 |
| Diabetes | 0.40 | 0.41 | 0.38 | 0.32 | 0.51 | 0.49 | 0.27 | 0.38 | 0.0001 |
| Smoking | 0.30* | 0.34* | 0.31* | 0.24* | 0.2 | 0.07 | 0.16 | 0.11 | *0.001>0.05 |
| Hyperlipidemia | 0.18 | 0.29 | 0.25 | 0.22 | 0.08 | 0.12 | 0.18 | 0.22 | >0.05 |
*p-value <0.05 was considered statistically significant
Among the 67 patients with CMBs, few of them (n=5; 7.4%) had simultaneous non physiological intracranial calcifications which were not clearly demonstrated on RP T2*GRE as depicted in [Table/Fig-12].
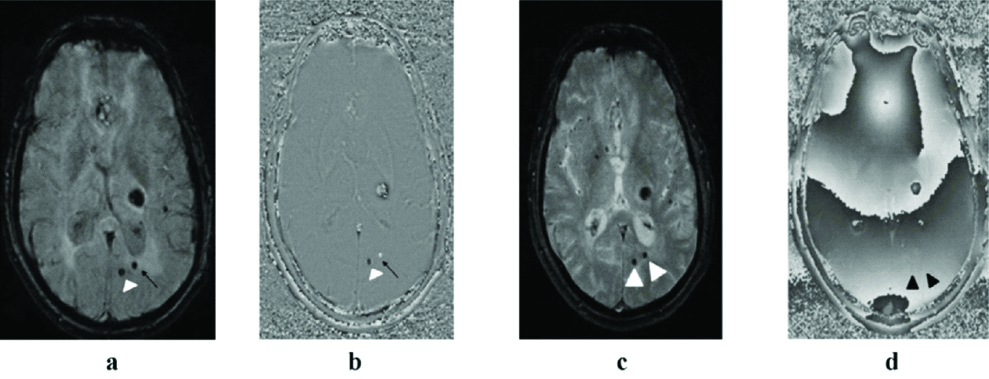
12 (a to d): MRI of a 67-year-old hypertensive male showing left thalamic bleed. A tiny low signal intensity focus is seen on magnitude SWI (arrow head in a) with signal void on reverse RP SWI (arrow head in b) suggestive of a tiny calcified focus. A chronic microbleed is seen just lateral to the tiny calcified focus (black arrow in a) and shows positive signal on RP SWI (black arrow in b). At the same slice position, both of these are seen on corresponding magnitude T2*GRE as well (white arrowheads in c) but due to presence of susceptibility artefacts in its RP, they are difficult to characterise separately (black arrowheads in d).
An almost perfect agreement was found between both observers for number of CMBs on RP SWI with ‘κ’ value of 0.97a (0.96-0.98) in contrast to a weak agreement on RP T2*GRE with κ=0.52a (0.40-0.64). A perfect agreement was found for number of CMBs >5 mm on RP SWI with κ value of 1.0a [Table/Fig-13].
Inter-observer correlation (Cohen’s kappa-κ).
| Variable | Cohen’s kappa-κ | 95% CI | p-value |
|---|
| Number of CMBs on RP T2*GRE | 0.52a | 0.40-0.64 | 0.0001 |
| Number of CMBs on RP SWI | 0.97a | 0.96-0.98 | 0.0001 |
| Number of CMBs <5 mm on RP SWI | 0.91a | 0.89-0.93 | 0.0001 |
| Number of CMBs >5 mm on RP SWI | 1.0a | - | 0.0001 |
For SWI, an almost perfect reliability was found (ICC=0.998) as compared to a moderate reliability on T2*GRE (ICC=0.6826). Surprisingly, a perfect reliability was observed for number of CMBs >5 mm on SWI (ICC=1.0; p=0.0001) [Table/Fig-14].
Inter-class correlations between both observers for various parameters (ICC).
| Parameters assessed for both observers | Interclass correlation value ± 95% CI | p-value |
|---|
| Number of CMBs on reverse phase T2*GRE | 0.6826 (0.4012-0.964) | 0.0001 |
| Number of CMBs on reverse phase SWI | 0.998 (0.996-0.999) | 0.0001 |
| Number of CMBs <5 mm on RP SWI | 0.998 (0.995-0.999) | 0.0001 |
| Number of CMBs >5 mm on RP SWI | 1.0 | 0.0001 |
Discussion
CMBs have recently emerged as an important neuro-imaging marker of Cerebral Small Vessel Disease (CSVD) and have been implicated as surrogate markers for overt stroke and severe microvascular pathology. The presence of CMBs has been increasingly studied over the past few decades. Their association with acute Intracerebral Hemorrhage (ICH) and /or acute infarcts has been heavily debated in a myriad of studies worldwide [10,11,21].
MRI sequences sensitive to CMBs (i.e., SWI and T2*GRE) are now being used in routine clinical settings which has led to an increased detection rate of CMBs, especially in the elderly and in patients with cognitive impairment [22].
The present study had aged patients more than 50 years due to the presence of CMBs in the elderly and patients with cognitive impairment were recruited since many previous studies found that advancing age is a common risk factor for CMBs [23,24].
The mean age (±SD) of the study population was 66.16±9.38 years, which ranged from 50 to 86 years. The age distribution in this study was more or less similar to that of other studies in literature and even few population-based studies [8,25].
There was a male predominance in the present study, similar to previous studies by Tsai H et al., Kinoshita T et al., [23,26], Romero J et al., and Poels MM et al., [27,28]. The male to female ratio in the present study was 2.3:1. The possible reason for this sex discrepancy is due to protective effect of oestrogen against atherosclerosis and arteriosclerosis in the females. The short-term vasodilating effects as well as long-term vasoprotective and anti-atherosclerotic effects of the oestrogen safeguard the females against vasculopathies [29].
Approximately, three fourth patients in this study group had hypertension (76.1%) and nearly two-third were diabetic (68.6%). Approximately, half the patients in the study group comprised of smokers (44.8%). These findings are in concordance with the existing studies [11,30]. An apt explanation for a higher frequency of hypertension and diabetes in this study group is the adoption of western lifestyles and the stress of urbanisation in the background of unhealthy lifestyles. Geographical, ethnic and genetic factors might have also played a significant role.
In the present study, CMBs were only demonstrated on the T2*GRE and SWI sequences. The term ‘blooming’ refers to the phenomenon of lesions appearing larger than they actually are. This ‘blooming’ effect, typically encountered on GRE and SWI sequences, is indeed a susceptibility artefact. This artefact occurs in the presence of paramagnetic substances (e.g., deoxyhaemoglobin or haemosiderin) which affect the local magnetic milieu [6,7]. Although an artefact, it improves the detection of microhaemorrhages [6,7], a finding which we also encountered more with SWI sequence as compared to T2* GRE.
SWI is sensitive for detection of CMBs and even calcifications. Azad R et al., in their study demonstrated the unique ability of SWI in detection and differentiation of focal intracranial calcifications and chronic microbleeds [17]. In a left-handed MRI system, like the one used in the present study, brain iron deposition and CMBs (paramagnetic) appeared dark (hypointense) on magnitude SWI images and hyperintense (bright/positive or predominantly positive signal) on the RP images. On the contrary, calcium (diamagnetic) appeared signal void (dark/negative or predominantly negative signal) on both magnitude and RP SWI [17,31]. In this study, it was found that both microbleeds and calcification presented as low signal on magnitude phase SWI images. But on the RP images they presented with opposite signal features: diamagnetic susceptibility of calcification as signal void, but paramagnetic susceptibility of haemorrhage as high signal.
In addition to the presence of CMBs, five patients in this study group demonstrated simultaneous occurrence of calcified foci in brain parenchyma, separate from the areas of physiological calcifications. Both CMBs and calcification had similar appearance (signal void) on the magnitude SWI and could not be differentiated whereas opposite phase shifts on RP SWI allowed accurate identification. Zhu WZ et al., in their study showed that both haemorrhage and calcification manifested as low signal on SWI [31]. But they obtained opposite signal features on the corrected phase images. They found considerable differentiation in average phase shift among haemorrhage and calcification (t=74.69, p<0.05). Azad R et al., in their study utilised magnitude and phase SWI images to differentiate intracranial calcifications from haemorrhage [17]. The overall sensitivity of SWI in detection of calcification in their study was 93.9% with good inter observer agreeability (k= 0.7) on phase images. They were able to detect all chronic microbleeds on SWI with moderate inter observer agreeability in evaluation of signal on phase component (k= 0.5). Thus, the use of RP SWI significantly improved differentiation of CMBs from intracranial calcific foci and provided a reasonably accurate microbleed assessment.
However, whilst quite a few studies have already evaluated CMBs and compared T2*GRE and SWI [11-16,21], there is still limited literature available regarding the use of RP SWI in CMB detection in the current setting.
The present study demonstrated a higher number of CMBs on RP SWI (28.61±41.5) in comparison to the conventional T2*GRE (17.97±27.57; p-value <0.05). CMBs detected on SWI were approximately 1.7 times more than the GRE sequence (In total, 777 more CMBs were seen on SWI). Some previous studies have reported a lower mean number of CMBs [13,32] than this study while in others, the mean number of CMBs was comparable [14,15] or even higher [33] to this study. The lower number of CMBs in these studies is possibly attributed to lesser number of patients in their study population. Notably, the study by Nandigam R et al., evaluated only 3 patients [13]. Liu J et al., on other hand, reported a greater number of CMBs than the present study, which is probably due to inclusion of patients with post-traumatic brain injuries and various other haemorrhagic lesions, including cavernous angiomas, tumours, angiitis etc., as well [33].
The more experienced observer (Observer 1) identified more CMBs on both T2*GRE and SWI when compared to the less experienced observer (Observer 2). However, the inter-observer variation in total number of CMBs detected was less on SWI (53) in contrast to T2*GRE (200). Single microbleed seen in five patients was equally detectable on SWI and T2*GRE sequences. The discrepancy in CMB detection on both sequences was stark in patients with higher number of CMBs (especially more than 10). For instance, in one of the cases, observer 1 counted 182 CMBs on RP SWI whereas, same observer counted only 128 CMBs on RP T2*GRE.
SWI showed an excellent inter-rater reliability (ICC=0.998), which was only moderate for T2*GRE (ICC= 0.6826). The inter-observer correlation (Cohen’s kappa-κ) was weak for T2*GRE (κ=0.52) but was excellent for SWI (κ=0.97; p=0.0001). The T2*GRE sequence, which was previously considered to be the gold standard for detection of microbleeds, detected only 70.5% microbleeds as compared to SWI (p=0.0001). This implies that the reliability of CMB count was better on SWI than on GRE. Therefore, we believe that SWI, with its phase component, is the modality of choice for accurate detection and interpretation of CMBs. This is more or less in concordance with other studies published in literature [14,32-36].
SWI is a 3D T2* sequence with a much higher spatial resolution in comparison to the conventional 2D T2*GRE. A combination of increased TE, decreased bandwidth and flip angle ensured a high Signal to Noise Ratio (SNR) as well as an adequate contrast between CMBs and background brain tissue in the present study, which has also been reported previously [16,36]. Therefore, SWI makes microbleed detection clearer and is more sensitive for their detection than conventional 2D-T2*-weighted GRE sequence by providing greater contrast, resulting in detection of approximately, 50-70% more lesions [14,16].
Most of our patients had multiple CMBs involving various parts of the brain. The Lobar pattern of CMBs distribution is diagnostic for Cerebral Amyloid Angiopathy (CAA) according to the “modified Boston criteria for the diagnosis of CAA” with relative sparing of the deep locations [1,10]. Mixed pattern of distribution with CMBs in both deep and lobar location is also not uncommon which may be caused by either atherosclerosis (most commonly of hypertensive origin) or a combination of hypertensive angiopathy and CAA [10,35,37].
The present study showed a significantly higher percentage of patients with mixed distribution pattern (combined lobar and deep locations) of CMBs (n=48, 71.6%) than the CMBs in strictly lobar or deep locations. These findings are more or less comparable to existing literature [23,38]. Interestingly, the mean number of CMBs in the present study (28.61) was nearly similar (26.4) to the study by Werring DJ et al., [38]. On the contrary, Maia L et al., reported 91% CMBs strictly in the lobar or cortical-subcortical location [39]. This can be explained by the fact that Maia L et al., investigated patients more than 55 years of age and only those patients were included that fulfilled the criteria for CAA in which strictly lobar microbleeds are a radiological hallmark.
The pathogenesis of CMBs in mixed lobar and deep locations remains contentious. It has been reported that hypertensive arteriopathy typically produces deep CMBs in its initial course [38,40-42]. As hypertensive arteriopathy advances to a severe stage, there is decreased vascular reactivity of the superficial cortical arteries as well which is independently sufficient enough to cause microbleeds in all locations [10]. In the present study, a higher number of CMBs were noted in the lobar location (66.6±55.78) than other locations. Many patients in the study population were more than 65 years of age. Therefore, such a distribution pattern could be attributed to a possible overlap of hypertensive angiopathy and CAA.
All hypertensive patients in the present study had CMBs located in the deep grey nuclei, irrespective of CMBs in other locations. A higher number of CMBs were seen in the thalamic region (n=234; 3.49±6.18). This is analogous to studies by Romero R et al., and by Jia Z et al., [27,40]. In infratentorial region, CMBs were found more frequently in the cerebellum, extensively concentrated around the dentate nuclei in the inferior half of cerebellum (n=192; 2.87±6.18). This finding of the present study correlated well with previous studies [25,43,44]. The long, thin, penetrating branches of the superior cerebellar artery found around the dentate nucleus make this area particularly vulnerable [25,35]. Hereby, we believe that mixed CMBs (especially in the lobar and deep locations) may be caused by long-standing hypertensive arteriopathy with or without coexisting CAA and thus produced results like those of the present study.
As per the location, deep and infratentorial CMBs had moderate correlation with hypertension. This indicates the preferential initial sites for hypertensive CMBs to be the non lobar areas of brain. Indeed, there has been strong evidence that blood pressure reduction mitigates the risks of dementia and cognitive impairment associated with microbleed prevalence and stroke [45]. Therefore, detection of microbleed in patients with cerebrovascular diseases further emphasises the need for vigorous control of hypertension. The larger sized CMBs (size ≥5 mm) showed strong correlation with diabetes and hypertension in comparison to CMBs <5 mm. This suggests that both hypertension and diabetes, which render the brain microvasculature fragile, tend to play a significant role in microbleed formation, particularly, larger sized CMBs. Present study findings corroborate with previous studies [40,46,47] which reported strong association of CMBs with diabetes and hypertension. Since susceptibility effect is directly proportional to the square of the magnetic field strength, it is increased at higher magnetic field strengths, and blooming effects are therefore predicted to be greater than for lower magnetic field strengths. Therefore, SWI on 3.0 T might prove more beneficial for microbleed detection as susceptibility effects caused by haemosiderin would be more pronounced and the magnetic susceptibility of molecules generated by local inhomogeneities with higher sensitivity.
Limitation(s)
The sample size was relatively small, which might limit statistical relevance. The study composed of patients who sought medical attention for several reasons and hence the sample was heterogeneous and may be different from that of population-based studies. Some of the microbleeds particularly in the basal regions of brain may have been missed owing to susceptibility artefacts caused by air and bone interfaces (with associated susceptibility artefact from air in the sinuses).
Conclusion(s)
SWI sequence offered greater sensitivity and reliability in detection of CMBs in comparison to T2*GRE sequence and should be the gold standard modality for detection and assessment of CMBs. The burden of CMBs may further predict inappropriately managed diabetes and hypertension. We thus strongly recommend inclusion of SWI sequence in routine MRI protocol for evaluation of patients with cerebrovascular disease.
#Reverse Phase (RP) of Susceptibility Weighted Imaging (SWI) sequence
#Reverse Phase (RP) of T2* Gradient-recalled echo imaging sequence
*p-value <0.05 was considered statistically significant