Simple febrile seizure is one of the most common emergencies encountered in paediatric practice with a worldwide prevalence of 2-5% [1], mostly occurring in children from 6 months to 60 months of age, though more commonly between the ages of 9 months to 18 months. To be labelled as febrile seizure, seizures shouldn’t be associated with a direct cause like Central Nervous System (CNS) infection, electrolyte imbalance or seizure disorder. The seizure lasts less than five minutes which is often of generalised tonic clonic type, with each episode occurring only once in a 24 hour period [1]. The risk factors for simple febrile seizures are varied and many; few of them include genetic factors, age, gender and family history of febrile seizure. Deficiency of iron can alter the neuronal activity in brain and predispose to seizures. This occurs by decrease in the GABA inhibitory neurotransmitters due to altered metabolism, reduction in enzymes such as monoamine and aldehyde oxidase, impairment in oxygenation and energy metabolism of the brain [2-4]. Moreover, children with anaemia are more susceptible to infections, leading to higher incidence of febrile seizure. Zinc deficiency and its role in febrile seizure have also been extensively studied. Zinc has role in the synthesis of gamma amino butyric acid, a predominant inhibitory neurotransmitter, which acts by regulating glutamic acid decarboxylase [5]. The calcium and phosphorous levels are reported to be normal in febrile seizure. Recent research shows that Vitamin D has major role in the development of CNS [6-8]. Lot of research is going on the role of Vitamin D in seizure. The neuronal cells and glial cells have vitamin D3 receptors and enzymes in them. Vitamin D is postulated to have anticonvulsant property by regulating the expression of genes through nuclear Vitamin D Receptors (VDR). Vitamin D also helps in absorption of calcium and reduces the excitability of CNS. It is also involved in regulation of the calcium and chloride currents across neuronal membranes [9]. Vitamin D synthesis depends on the amount of time spent outdoors, area of body exposed to sun and the skin colour of the individual. Children with dark skin with more melanin, synthesise less vitamin D than a person with lighter skin [10].
Parental stress due to febrile seizures is real and requires significant time to counsel on its cause, especially to clear doubts on possible antenatal causes and methods to prevent seizures. This study was undertaken to study the effects of antenatal influences, if any, nutrition, iron and vitamin D levels on febrile seizure.
Materials and Methods
A cross-sectional study was done in the Out Patient Department of Paediatrics at Saveetha Medical College and Hospital a tertiary care centre catering to suburban population. Institutional Ethics Committee clearance was obtained (Ethical approval: SMC/IEC/2019/01/019). This study was carried out from from February 2019 to January 2020. During the one year study period, 50 children with febrile seizures were enrolled consecutively. Children with seizure lasting less than five minutes, mostly generalised tonic clonic type, with each episode occurring only once in a 24 hour period was defined as febrile seizure in this study.
Inclusion Criteria
Developmentally normal children between ages of 9-60 months presenting with simple febrile seizures.
Exclusion Criteria
Children with developmental delay or children on antiepileptic drugs or any other drug that could affect Vitamin D levels.
After getting informed consent from the guardian, the data was collected in a pre-structured questionnaire, on antenatal nutritional status, supplement intake of mother, spacing of child birth, birth weight and breast-feeding history. Detailed nutritional history and nutritional supplementation of child was obtained. Time spent outdoor and type of clothing worn, family history of febrile seizure was documented.
The anthropometry of the child was noted and HAZ and WAZ score was plotted. Colour of the child was noted based on Fitzpatrick skin phototype [11]. CBC, Calcium, Electrolytes and Vitamin D levels were tested. Two mL of blood was collected in plain and Ethylenediaminetetraacetic Acid (EDTA) vacutainers for vitamin D and CBC, respectively using strict aseptic precautions. For vitamin D levels serum sample was tested in Cobas e411 machine by ECLIA (Electro chemiluminence immuno assay) and CBC by Veckman Coulter DXH500 photometric measurement by optical impedance. Vitamin D levels were classified as deficient, if blood levels were <10 IU; insufficient if between 10-30 IU and sufficient, if the levels were >30 IU.
Statistical Analysis
The data collected were analysed and compared using Sigma Plot 13 (Systat software, USA). Chi-square test was done and a p-value <0.05 was considered as statistically significant.
Results
A total of 50 children were enrolled in the study. The vitamin D levels of children based on age, sex and birth weight are depicted in [Table/Fig-1]. Total 52% of children were in the age group of 9 months to 24 months; with lesser number of children affected as age increased. Vitamin D deficiency was not seen, though one child had a value of 11.3 IU only. Total 34 (68%) children had vitamin D insufficiency with levels in the range of 10-30 IU; 16 (32%) children had normal levels of vitamin D >30 IU. The mean Vitamin D level of the study population was 29.06 IU.
Vitamin D levels based on age, sex and birth weight.
| Age in months | Boys | Girls |
|---|
| NBW | N VIT D | LBW | N VIT D | VLBW | N VIT D | ELBW | N VIT D | NBW | N VIT D | LBW | N VIT D | VLBW | N VIT D |
|---|
| I VIT D | I VIT D | I VIT D | I VIT D | I VIT D | I VIT D | I VIT D |
|---|
| 9-18 | 4 | 1 | - | - | - | - | - | - | 6 | 1 | 3 | 1 | - | - |
| 3 | - | - | - | 5 | 2 | - |
| 18-24 | 2 | 2 | 3 | 1 | - | - | - | - | 5 | 2 | 3 | - | - | - |
| - | 2 | - | - | 3 | 3 | - |
| 24-30 | 5 | 1 | - | - | - | - | - | - | 1 | 1 | - | - | - | - |
| 4 | - | - | - | - | - | - |
| 30-36 | - | - | 1 | 1 | - | - | 2 | 1 | 1 | - | 2 | 1 | - | - |
| - | - | - | 1 | 1 | 1 | - |
| 36-42 | 2 | - | - | - | 1 | - | - | - | 1 | 1 | - | - | - | - |
| 2 | - | 1 | - | - | - | - |
| 42-48 | 1 | - | - | - | - | - | - | - | - | - | - | - | - | - |
| 1 | - | - | - | - | - | - |
| 48-54 | 3 | 1 | - | - | - | - | - | - | 1 | - | - | - | - | - |
| 2 | - | - | - | 1 | - | - |
| 54-60 | 1 | - | - | - | - | - | - | - | 1 | 1 | - | - | 1 | - |
| 1 | - | - | - | - | - | 1 |
N Vit D: Normal Vitamin D >30 IU, I Vit D: Insufficient Vitamin D<30 IU, NBW: Normal Birth weight >2.5 Kg, LBW: Low Birth weight 1.5-2.5 Kg, VLBW: Very Low Birth weight 1-1.5 Kg, ELBW: Extremely Low Birth weight <1 Kg; None of the cases in the study group had Vitamin D deficiency so it is not included in the table
Based on seizure episode the vitamin D levels are shown in [Table/Fig-2]. Total 71% of children with first episode and 63% of children with recurrent febrile seizure had vitamin D insufficiency.
Vitamin D levels in comparison with seizure episode.
| Number | N Vit D | I Vit D | Statistical analysis |
|---|
| First episode | 31 | 9 | 22 | χ2=0.069p=0.793 |
| Recurrent episode | 19 | 7 | 12 |
N Vit D: Normal Vitamin D >30 IU; I Vit D: Insufficient Vitamin D<30 IU
Antenatal factors: Out of the 50 children, 38 were born of non-consanguineous marriage. The ideal antenatal weight gain in Indian antenatal women should be >10 Kg and between 8-10 Kg is acceptable, and <8Kg weight gain is considered as poor weight gain [12]. In mothers with poor weight gain, 80% of their children had vitamin D insufficiency, with mean value of 21.62 [Table/Fig-3].
Antenatal weight gain and vitamin D levels.
| Weight gain during pregnancy | Vit D Insufficiency | Normal Vitamin D | Statistical analysis |
|---|
| >10 kg | 11 (73%) | 4 (27%) | χ2=0.039p=0.843 |
| 8-10 kg | 19 (63%) | 11(37%) |
| <8 kg | 4 (80%) | 1 (20%) |
Forty two of the mothers had no medical problem during their pregnancy. PIH was present in six mothers, Gestational Diabetes Mellitus (GDM) and thyroid problem in one each. Thirty (60%) of the children with simple febrile seizures were first born; 18 (36%) children second born and third and fourth born were 1 (2%) each. The vitamin D levels in children based on birth spacing is depicted in [Table/Fig-4].
Vitamin D levels in association with spacing of child birth.
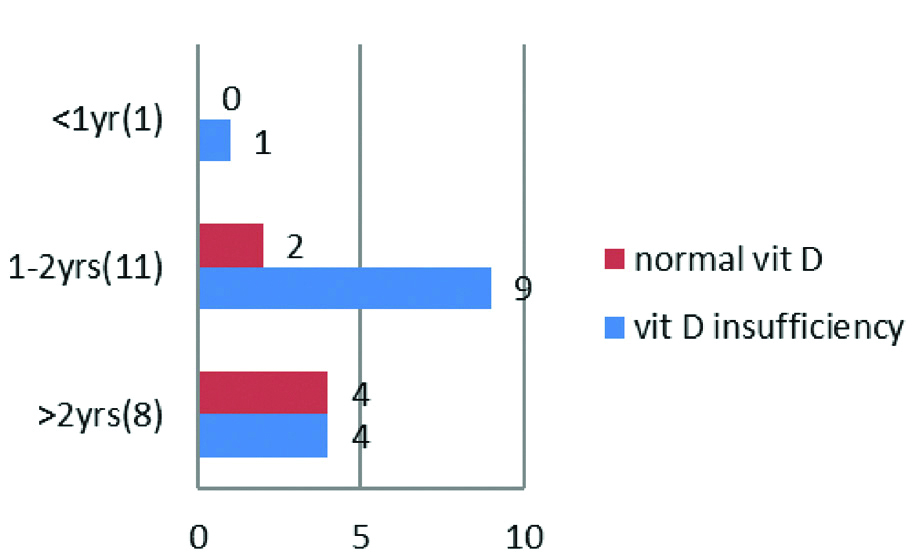
Nutrition and supplementation in the first six months of life: The association between duration of breast feeding and vitamin D levels is depicted in [Table/Fig-5]. Among babies that were breast fed exclusively for duration of <6 months, none of them had normal vitamin D levels except for 1 baby who was on formula feeds since birth.
Vitamin D levels in comparison with duration of exclusive breast feeding and total duration of breast feeding.
| Exclusive breast feeding duration | Total duration of breast feeding |
|---|
| Numbers | N Vit D | I Vit D | Statistical analysis | | Numbers | N Vit D | I Vit D | Statistical analysis |
|---|
| Not fed | 1 | 1 | 0 | χ2=0.768p=0.381(compared 6 months and <6 months duration) | <6 months | 2 | 1 | 1 | χ2=0.311p=0.856(compared >18 M, 12-18 M, <12 M) |
| <3 months | 2 | 0 | 2 | 6-9 months | 2 | 0 | 2 |
| 3-5 months | 5 | 0 | 5 | 9-12 months | 14 | 5 | 9 |
| 6 months | 42 | 15 | 27 | 12-18 months | 9 | 4 | 5 |
| | | | | >18 months | 23 | 6 | 17 |
N Vit D: >30IU, I Vit D: 10-30IU
[Table/Fig-6] Total 34% of children that took vitamin D supplements for >3 months had normal vitamin D levels as compared to 29% of children that did not take supplements or took it for <3 months.
Vitamin D levels in children based on intake of vitamin D supplements.
| Vit D Supplements | Numbers | N Vit D | I Vit D | Statistical analysis |
|---|
| >6 months | 20 | 6 | 14 | χ2=0.442p=0.802 |
| 3-6 months | 6 | 3 | 3 |
| <3 months | 1 | 0 | 1 |
| Nil | 23 | 7 | 16 |
N Vit D: >30 IU, I Vit D: 10-30 IU
Dietary habits, when comparing intake of eggs with Vitamin D levels, 66% of children who consumed >4 eggs per week had normal Vitamin D levels, whereas only 17% of children who consumed ≤4 eggs had normal Vitamin D levels [Table/Fig-7,8]. The only variable which was statistically significant with regards to diet was egg. Those children who consumed more eggs per week had more chance of having normal Vitamin D levels.
Vitamin D levels in comparison with intake of eggs.
| Eggs consumed | Number | N Vit D | I Vit D | Statistcal analysis |
|---|
| 0 | 4 | 1 | 3 | χ2=10.374p=0.006 |
| <2/wk | 13 | 2 | 11 |
| 2-4/wk | 18 | 3 | 15 |
| 4-6/wk | 9 | 5 | 4 |
| >6/wk | 6 | 5 | 1 |
N Vit D: >30IU, I Vit D: 10-30IU
Vitamin D levels based on nonvegetarian and nuts intake.
| Non Veg servings | | Nuts servings |
|---|
| Number | N Vit D | I Vit D | Statistical analysis | Number | N Vit D | I Vit D | Statistical analysis |
|---|
| 0 | 8 | 3 | 5 | χ2=0.002p=0.960 | 30 | 11 | 19 | χ2=0.310p=0.578 |
| <2/wk | 37 | 12 | 25 | 10 | 1 | 9 |
| 2-4/wk | 5 | 1 | 4 | 10 | 4 | 6 |
N Vit D: >30 IU, I Vit D: 10-30 IU
Family history of febrile seizure was present in 18 children. Father was the affected family member in 10 cases, sibling in five cases and mother in five cases. Two children had two members in the family with febrile seizure. Outdoor activity was present in 39 children. Most of the children were outdoors in the hours between 4.00-6.00 PM. Of the 24 children that went outdoors after 4.00 pm, only 4 (17%) had normal Vitamin D levels [Table/Fig-9].
Comparison of Vitamin D levels with outdoor activity.
| Outhoor activity | Vitamin D insufficiency | Normal Vitamin D | Statistical analysis |
|---|
| 9 AM-12 Noon | 4 (57%) | 3 (43%) | χ2=3.997p=0.136 |
| 12 Noon-4.00 PM | 5 (62%) | 3 (38%) |
| 4 PM-6 PM | 20 (83%) | 4 (17%) |
| NIL | 5 (54%) | 6 (46%) |
Thirty two children were generally clothed in half sleeves and shorts, 10 children were fully covered most of the time, and eight children wore sleeveless dress and shorts when outdoors. The relation between clothing and vitamin D levels is depicted in [Table/Fig-10].
Relationship between clothing practices and vitamin D levels.
| Vitamin D | Fully covered | Half sleeves | Sleeveless | Statistical analysis |
|---|
| Insufficiency vit D | 8 | 20 | 6 | χ2=1.287p=0.526 |
| Normal Vit D | 2 | 12 | 2 |
Anthropometric details of the children are depicted in [Table/Fig-11]. Six (12%) children had a mid-arm circumference less than 12.5 cm. Frontal bossing was seen in four children. Of these four children three children had low HAZ or WAZ score. One had normal HAZ and WAZ score. The study found that the majority of the children in the study population fall in the negative side of the normal curve. Nearly 58% of children were below the -1SD line with regards to HAZ and 62% with regards to WAZ.
Anthropometry details of study population.
| HAZ | Boys | Girls | Percentage | WAZ | Boys | Girls | Percentage |
|---|
| >2SD | - | - | - | >2SD | - | - | - |
| 0-2 SD | 4 | 5 | 18% | 0-2 SD | 3 | 2 | 10% |
| 0- (-1) SD | 6 | 6 | 24% | 0- (-1)SD | 8 | 6 | 28% |
| -1 SD- -2SD | 7 | 6 | 26% | -1 SD- -2SD | 7 | 8 | 30% |
| <-2SD | 8 | 8 | 32% | <-2SD | 7 | 9 | 32% |
HAZ: Height for Age Z; WAZ: Weight for Age Z; SD: Standard deviation
The relationship between skin colour and vitamin D levels is depicted in [Table/Fig-12]. The population in the study area were dark skinned as depicted in table with only skin colour coding as 4 or 5. Vitamin D level was not significantly affected by skin colour.
Skin colour and vitamin D levels.
| Skin colour coding | Number | N Vit D | I Vit D | Statistical analysis |
|---|
| 4 | 33 | 10 | 23 | χ2=0.001p=0.969 |
| 5 | 17 | 6 | 11 |
N Vit D: >30IU, I Vit D: 10-30IU
Investigations: The relation between haemoglobin levels, Mean Corpuscular Volume (MCV) and RDW with vitamin D levels is depicted in [Table/Fig-13]. Considering only haemoglobin, 45 (90%) children had haemoglobin >9 g%. It was found that 15 (30%) children had MCV less than 70fL and 28 (56%) children had RDW more than 14.5. Statistical analysis of the data did not show any significance.
CBC parameters with respect to Vitamin D levels.
| Hb | N Vit D | I Vit D | Statistical analysis | RDW | N Vit D | I Vit D | Statistical analysis | MCV | N Vit D | I Vit D | Statistical analysis |
|---|
| >12 | 2 | 5 | χ2=2.800p=0.247 | >14.5 | 9 | 19 | χ2=0.079p=0.779 | <70 | 4 | 11 | χ2=0.039p=0.843 |
| 9-12 gm | 14 | 24 | <14.5 | 7 | 15 | >70 | 12 | 23 |
| <9 gm | 0 | 5 | | | | | | |
N Vit D: >30IU, I Vit D: 10-30IU, RDW: Red cell distribution width, MCV: Mean corpuscular volume, Hb: Haemoglobin
The study was conducted over a period of one year and was based on the month that children presented with febrile seizures, it was found that the common season for febrile seizure was spring with 22 (44%) children presenting with febrile seizure. Rainy and winter season was the next common season with a total of 20 (40%) children presenting in this period. Only 8 (16%) children presented in summer season.
Discussion
A literature search done for analysing the research question gave only three studies [13-15] on vitamin D and febrile seizure. This paucity of literature in relation to vitamin D and nutritional status on febrile seizure prompted us to go ahead with the study to assess the same. Comparing the sex distribution of the study population with other studies, the present study found that distribution was similar in the study conducted by Bhat JA et al., in Haryana (834) with a ratio of 53.4:46.4 as compared to 50:50 in the present study [13]. In the study conducted by Singh V et al., in Jammu and Kashmir they found a ratio of 64:36 for male to female [14]. This could be due to the varying child sex ratio in different states. In the study conducted by Shariatpanahi G et al., in Iran the male:female sex distribution was 60:40 [15]. The child sex ratio in various states as per 2011 Indian census shows that the female per 1000 males are 830 in Haryana, 859 in JK and 946 in TN [16]. In the present study, the mean vitamin D level was 29.06 IU with a range of 11-50. Vitamin D insufficiency was seen in 68% and normal vitamin D levels in 32%. In the study done by Singh V et al., 13.5% of children with febrile seizure had Vitamin D deficiency, 59.4% had insufficiency and 27% normal vitamin D levels [14]. The values were comparable but with a slightly less vitamin D levels than the present study population. This could be due to the fact that the study was carried out in Jammu and Kashmir, a place with long winters and mild summers resulting in less Vitamin D production as against the hot summers in the southern India where the study was conducted. Vitamin D deficiency was present in 31%, insufficiency in 44% and normal in 25% in a study conducted by Bhat JA et al., in Haryana, India [13]. The results correlate with the present study and this could be because both the areas have hot and lengthy summers.
Shariatpanahi G et al., in their study found the mean vitamin D levels to be 24.41±11.21 with a range of 13-35 [15]. In the present study, the mean was 29.06 with range of 11-50. A 7.5% of their study population were deficient for vitamin D, 72.5% were in the insufficient range and only 20% had normal levels. The children in their study had less vitamin D levels as compared to study population. Vitamin D synthesis happens in the skin with the help of UV rays. In the present study, 15 (30%) of children were out door between 10.00AM-3.00PM the time when maximum vitamin D synthesis occurs [17]. Out of the 15 children, only seven children (45%) had normal vitamin D levels. This could be due to the dark skin and clothing habits of the study population preventing UVB ray absorption and vitamin D synthesis. Considering the clothing habits, the study found that 80% of children who were fully covered had Vitamin D insufficiency as compared to 60% in children who wore sleeveless or half sleeve dresses when out in the sun. Shariatpanahi G et al., found that only 25% of children spent time outdoors in the productive hours of 10.00 AM to 3.00 PM but they have not analysed the vitamin D levels with this variable [15].
Bhat JA et al., in their study compared Vitamin D levels in children with first episode and recurrent febrile seizure [13]. They found that 51% of children with first episode of seizures had Vitamin D insufficiency as compared to 70% in the present study. With regards to recurrent febrile seizure, 33% of children had vitamin D insufficiency as compared to 63% in the present study population. However, 62% of children with recurrent febrile seizure had vitamin D deficiency and there were none in the present study population. This could be due to poor nutrition in their study population. Regarding seasonal variation of vitamin D levels, a study done by Hansen L et al., says that there is variation in vitamin D levels in general population according to the season [18]. In their study, they found that vitamin D levels are higher in autumn than spring. Similarly, if the present study extrapolate the finding, it was find that most of the febrile seizure occurred during the spring, winter and rainy season when the vitamin D levels are generally low due to low UVB rays and less of sun exposure. Only 16% of children presented with febrile seizure in summer months when the study expect more vitamin D production by the skin, in present study.
Vaswani RK et al., in their study found that children with first episode of febrile seizure had significant less serum ferritin levels than normal children [19]. In present study, only 5 (10%) children had anaemia if haemoglobin was alone taken as criteria. There is lots of literature which supports the idea that haemoglobin alone is not sufficient to diagnose iron deficiency anaemia. The normal value of RDW is 13±1.5 [20]. In iron deficiency anaemia anisocytosis as manifested as increased RDW will be seen even before anaemia or microcytosis occurs. So, if RDW is taken into account there are 28 (56%) children with anaemia. If MCV is taken into account, 15 (30%) children have anaemia. The normal haemoglobin levels could be due to haemoconcentration occurring in sick children due to dehydration. So, in the present study it is found that children with simple febrile seizures have iron deficiency as manifested by low MCV and increased RDW. Iron deficiency is a known factor precipitating a febrile seizure as decrease in iron is known to increase the glutamate which is excitatory and decrease the GABA and monoamines which are inhibitory neurotransmitters. This coupled with the hypoxemia which may trigger a seizure episode in a child with Iron deficiency [4]. The major dietary sources of vitamin D are from nonvegetarian sources like, fish, cod liver oil, fortified milk and eggs [21]. In the present study, it was found that the diet of the study population is deficient in these vitamin D rich foods. This could be one of the contributing factors for presence of vitamin D insufficiency. The poor nutrition of the study population is further reinforced by the WAZ and HAZ scores. 62% and 58% of children were between the -1SD and -2SD curve with regards to WAZ and HAZ scores, respectively.
Limitation(s)
Results of this study require confirmation and repeatability by a larger cohort of children with febrile seizures. The present study had only 50 children satisfying the inclusion criteria.
Conclusion(s)
Vitamin D insufficiency is common in children with simple febrile seizures. Antenatal and diet factors affect the vitamin D levels of children. The dark skin, reduced time spent outdoors, clothing habits and diet contribute to this vitamin D insufficiency. Iron deficiency anaemia is also common in children with simple febrile seizures and may contribute to it. Most of the children have poor HAZ and WAZ scores in the study population.
N Vit D: Normal Vitamin D >30 IU, I Vit D: Insufficient Vitamin D<30 IU, NBW: Normal Birth weight >2.5 Kg, LBW: Low Birth weight 1.5-2.5 Kg, VLBW: Very Low Birth weight 1-1.5 Kg, ELBW: Extremely Low Birth weight <1 Kg; None of the cases in the study group had Vitamin D deficiency so it is not included in the table
N Vit D: Normal Vitamin D >30 IU; I Vit D: Insufficient Vitamin D<30 IU
N Vit D: >30IU, I Vit D: 10-30IU
N Vit D: >30 IU, I Vit D: 10-30 IU
N Vit D: >30IU, I Vit D: 10-30IU
N Vit D: >30 IU, I Vit D: 10-30 IU
HAZ: Height for Age Z; WAZ: Weight for Age Z; SD: Standard deviation
N Vit D: >30IU, I Vit D: 10-30IU
N Vit D: >30IU, I Vit D: 10-30IU, RDW: Red cell distribution width, MCV: Mean corpuscular volume, Hb: Haemoglobin