The concept of motivation is considered as a vital factor that plays a key role in students’ behaviour and performance. It has a very momentous function to play in one’s life, which enables and stimulates a person to make efforts to accomplish certain goals in a desired field of interest [1]. In other words, motivation can be termed as a core recipe of success for students as rightly argued that “motivation is what gets you going, keeps you going and determines where you’re trying to go” [2]. It explains why a person decides to do something [3].
Motivation has an immense impact on the psychology that decides the engagement and action of the learner to achieve certain objectives. The perception of motivation is serviceable in nature and its influences; hence it directs an individual to achieve desired targets [4]. There is a wide range of educational psychologists who are of the view that motivation is very much obligatory for proficient education and learning [5]. The conciliating motivation might result in mediocre or inadequate learning [6], and there can be various perspicacity to look at the concept of motivation, however, the core of all the discussions conclude with the fact that motivation keeps the ball rolling and sets means to accomplish targets [7]. Arguments can be made on the configuration and development of motivation in individual characters as they may get influenced by various factors.
The controlling influences may comprise of the demographic setups in which an individual was brought up in, the mentors which he/she got an opportunity to be exposed with, education, moral insights, or even clandestine perceptions about persons or objects around at large. Therefore, it is advisable too not to perceive the motivating influences in a straight line as drawn from various sets of psychosomatic practices resulting finally into actions [8]. Motivation to excel in academics has an undeviating rapport with the scholastic advancement of learners. Also, it is binding to possess consideration to central concern in forming a thriving enlightening structure. There is a strong and unswerving affiliation between motivation and educational attainment [9]. Motivation is, therefore considered to be a central clincher of scholastic progression. It is not something that is to be viewed separately, rather, there has to be a comprehensive perception about viewing the motivation which may comprise multiple aspects like conviction, attainment intention, assignment ideas, and objective etc., [10].
Motivation has been defined and argued by various theorists in their works. The primary division of motivation can be seen as quantitative motivation and qualitative motivation. The variation in degree in terms of quantitative motivation is very obvious. That could be high, low, or moderate. On the other side, qualitative motivation is very much dependent upon the various type of motivation one is influenced with. The source of qualitative motivation could either be internal or drawn from external sources. The type of motivation can be measured by another practice too which is marked as self-determination. This practice could be associated as an extension of the qualitative motivation [11]. Qualitative motivation largely influences the being of an individual and directs to proceed in the indented direction to attain a goal. Keeping in view the significance of motivation and its influence on learners, this work aims at bringing out the impact of motivation on academic excellence as well as the liaison of motivation with the scholastic performance amongst the students of the college of Medicine, Majmaah University, Majmaah, Saudi Arabia. Very few studies are carried out in Saudi Arabia and there was a need to assess the motivation level among medical students, who go through a long duration of course and require controlled and autonomous motivation for academic excellence.
Materials and Methods
The cross-sectional study was carried out among pre-medical and medical students of Majmaah University, Majmaah, Saudi Arabia in May-June 2020. The course in the school of Medicine, Majmaah University is of six years span which incorporates pre-clinical courses (preliminary year) of one year. This is trailed by two years of fundamental clinical sciences, three years of clinical and one year of pivoting entry-level position. The co-ordinated educational plan is instructed in every one of the six years with two semesters for one year. Every semester has the credit of 16 to 18 hours with mid and end module tests. These students are evaluated depending on the summative and developmental appraisal methods. A total of 250 participants were chosen from a general pool of students from each class randomly by using simple random sampling by lottery method, out of which 235 participants consented to be part of the examination. Students who gave consent and completed the questionnaire were included in the study. Some students were excluded from the study based on their incomplete questionnaire and unwillingness.
An informed consent was taken from the participant, after which they were asked to fill the questionnaire. The class representative from each year was asked to inform all their respective batch mates one day prior to the survey regarding timing of distribution of questionnaire. A unique ID number was given to the selected students who agreed to participate in this study; this was done to maintain the anonymity and the privacy of the participants.
In present study, AMS [12] English version, which was derived initially from French Motivation questionnaire, Echelle De Motivation en Education (EME) [13], was used to assess motivation among the participants. The questionnaire comprised of 28 items, which were subdivided into six subscales evaluating three types of motivation namely, Intrinsic Motivation (IM), Extrinsic Motivation (EM) and Amotivation. The AMS had satisfactory internal validity and consistency with Cronbach’s alpha value of 0.79 [12]. Each of the subscale to measure motivation relates to different dimensions of psychosocial concept in education. IM refers to doing the activity by himself or herself and derives satisfaction from participation. The IM with the subscale of IM to know, IM towards accomplishments and IM to experience stimulation had four items each. IM to know assesses the constructs like intrinsic intellectuality and curiosity to learn and IM towards accomplishments relates to individuals interaction with the surrounding environment to feel competent and accomplish things. Whereas, IM to experience stimulation operates when someone engages in activities leading to stimulating sensation to one self and has four items to evaluate.
Diametric to internal motivation, EM is governed by rewards and constraints and is assessed by four items each in three subdomains such as EM identification, EM introjection and External regulation. Lastly Amotivation, which is also a vital domain for understanding human behaviour. People are amotivated when they don’t see possibilities among results and their own activities. They are not intrinsically nor extraneously motivated and is assessed by last four items in AMS. The questionnaire included 7 point Likert scale with scores of indicating 1=Does Not correspond at all, 2-3=Corresponds a little, 4=Corresponds moderately, 5-6=Corresponds a lot and 7=Corresponds exactly was used to scale to what extent students believe reasons why they go to college across different dimensions.
All participants were well briefed in advance before the circulation of the questionnaire. In order to execute the study, proper approval was sought from the Ethical approval committee of Majmaah University with Ethical approval No. MUREC-17/COM-2020/33-4. Out of 235 students who gave consent and participated in study, two students dropped out in between study and the analysis was done on 233 students.
Statistical Analysis
The responses were recorded and analysed on SPSS version 25.0 for all statistical computation. Comparison of scores between students who repeated and not repeated in any year in college were analysed. Mean, and standard deviation were calculated and independent student’s t-test was applied to know the difference between means of groups. To compare mean motivational scores between students studying in different academic years for all different domains, ANOVA test was applied. The p-value <0.05 was considered statistically significant.
Results
There were 233 students who participated in the study out of which there were 147 males and 86 females. Majority of the students were single 227 (97.4%), 3 (1.3%) were married, 2 (0.9%) divorced and 1 (0.4%) widowed. Mean age was 22.07±1.92. Majority of the students who participated were 3rd year students 47 (20.2%). Out of the total 233 students, 63 (27%) students were repeaters and of the repeaters, 43 (68.3%) had repeated only once and 17 (27%) repeated twice. The graduation grades from high school of majority of the students were between 97-99 (70.8%) [Table/Fig-1].
General characteristics of study participants.
| Characteristics | Frequency | Percent |
|---|
| Gender | Male | 147 | 63.1 |
| Female | 86 | 36.9 |
| Marital status | Single | 227 | 97.4 |
| Married | 3 | 1.3 |
| Widowed | 1 | 0.4 |
| Divorced | 2 | 0.9 |
| Mean age±SD | | 22.07±1.92 |
| Region of origin | Majmaah city | 84 | 36.1 |
| Outside Majmaah city | 149 | 63.9 |
| Academic year | 1st year (Premedical) | 6 | 2.6 |
| 2nd year (1st Basic sciences preclinical year) | 41 | 17.6 |
| 3rd year (2nd Basic sciences preclinical year) | 47 | 20.2 |
| 4th year (1st Clinical year) | 38 | 16.3 |
| 5th year (2nd Clinical year) | 31 | 13.3 |
| 6th year (3rd Clinical year) | 34 | 14.6 |
| Internship | 36 | 15.5 |
| Have you repeated any year in college | No | 170 | 73.0 |
| Yes | 63 | 27.0 |
| If yes, specify how many | 1 | 43 | 68.3 |
| 2 | 17 | 27.0 |
| 3 | 3 | 4.8 |
| Graduation grade from high school | 90-91 | 4 | 1.7 |
| 91-92 | 2 | 0.9 |
| 92-93 | 1 | 0.4 |
| 93-94 | 8 | 3.4 |
| 94-95 | 7 | 3.0 |
| 95-96 | 15 | 6.4 |
| 96-97 | 18 | 7.7 |
| 97-98 | 37 | 15.9 |
| 98-99 | 128 | 54.9 |
| 100 | 13 | 5.6 |
*SD: Standard deviation
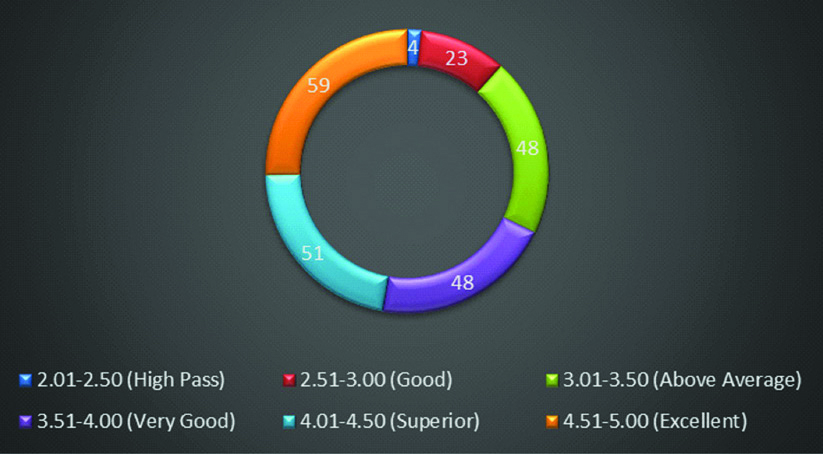
GPA (Grade Point Average) grades of 59 students were excellent {(4.51-5.00), 25.3%} [Table/Fig-2]. A total of 51 students were Superior {(4.01-4.50), 21.9%} and only four students had GPA grade of {(2.01-2.50), 1.7%}. The overall average GPA score of all the students was 3.91±0.70. Most of the students have not published any paper 170 (73%) while 42 of them had published one paper (18%) and five students published 5 (2.1%) or more.
Distribution of students based on GPA score.
In present study, for under IM to know, IM towards accomplishments and IM to experience stimulation were found to be 20.28±5.87, 18.81±7.16 and 18.69±6.87, respectively (p<0.05). The mean scores of most of the dimensions under ‘IM’ between those students who repeated in any academic year and those who did not repeat were found significantly different (p<0.05) [Table/Fig-3]. No significant differences were obtained between the mean total scores of extrinsic motivation and amotivation [Table/Fig-4,5].
Comparison of Intrinsic Motivation (IM) between students who repeated in college and students who never repeated.
| Have you repeated any year in college | No(N=170) | Yes(N=63) | Total(N=233) | t-value | p-value |
|---|
| Mean | SD | Mean | SD | Mean | SD |
|---|
| Intrinsic motivation - To know |
| 1. Because I experience pleasure and satisfaction while learning new things | 5.16 | 1.70 | 4.54 | 1.84 | 4.99 | 1.76 | 2.411 | 0.017 |
| 2. For the pleasure I experience when I discover new things never seen before | 5.24 | 1.67 | 5.06 | 1.75 | 5.19 | 1.69 | 0.711 | 0.478 |
| 3. For the pleasure that I experience in broadening my knowledge about subjects which appeal to me | 5.14 | 1.64 | 4.63 | 1.83 | 5.00 | 1.70 | 2.009 | 0.046 |
| 4. Because my studies allow me to continue to learn about many things that interest me | 5.24 | 1.64 | 4.73 | 1.85 | 5.10 | 1.71 | 2.041 | 0.042 |
| Intrinsic motivation- To know - Total | 20.77 | 5.64 | 18.97 | 6.31 | 20.28 | 5.87 | 2.098 | 0.037 |
| Intrinsic motivation - Toward accomplishment |
| 5. For the pleasure I experience while surpassing myself in my studies | 4.96 | 1.72 | 4.24 | 1.76 | 4.76 | 1.75 | 2.827 | 0.005 |
| 6. For the pleasure that I experience while I am surpassing myself in one of my personal accomplishments | 5.05 | 1.72 | 4.46 | 1.77 | 4.89 | 1.75 | 2.296 | 0.023 |
| 7. For the satisfaction I feel when I am in the process of accomplishing difficult academic activities | 5.06 | 1.77 | 4.41 | 1.93 | 4.89 | 1.83 | 2.435 | 0.016 |
| 8. Because college allows me to experience a personal satisfaction in my quest for excellence in my studies | 4.44 | 1.80 | 3.79 | 1.82 | 4.27 | 1.83 | 2.430 | 0.016 |
| Intrinsic motivation - Toward accomplishment-Total | 19.51 | 7.01 | 16.9 | 7.28 | 18.81 | 7.16 | 2.498 | 0.013 |
| Intrinsic motivation- To experience stimulation |
| 9. For the intense feelings I experience when I am communicating my own ideas to others | 4.86 | 1.71 | 4.52 | 1.79 | 4.77 | 1.73 | 1.336 | 0.183 |
| 10. For the pleasure that I experience when I read interesting authors | 4.71 | 1.73 | 4.19 | 1.87 | 4.57 | 1.78 | 1.975 | 0.049 |
| 11. For the pleasure that I experience when I feel completely absorbed by what certain authors have written | 4.59 | 1.67 | 4.24 | 1.78 | 4.49 | 1.71 | 1.393 | 0.165 |
| 12. For the “high” feeling that I experience while reading about various interesting subjects | 4.97 | 1.65 | 4.56 | 1.61 | 4.86 | 1.65 | 1.714 | 0.088 |
| Intrinsic motivation-To experience stimulation-Total | 19.13 | 6.76 | 17.51 | 7.05 | 18.69 | 6.87 | 2.685 | 0.008 |
*SD: Standard deviation; p<0.05 considered statistically significant
Comparison of Extrinsic Motivation between students who repeated in college and students who never repeated.
| Have you repeated any year in college | No(N=170) | Yes(N=63) | Total(N=233) | t-value | p-value |
|---|
| Mean | SD | Mean | SD | Mean | SD |
|---|
| Extrinsic motivation - Identified |
| 13. Because I think that a college education will help me better prepare for the career I have chosen | 5.12 | 1.77 | 4.83 | 1.69 | 5.04 | 1.75 | 1.133 | 0.258 |
| 14. Because eventually it will enable me to enter the job market in a field that I like | 5.18 | 1.73 | 4.95 | 1.74 | 5.12 | 1.73 | 0.877 | 0.382 |
| 15. Because this will help me make a better choice regarding my career orientation | 5.10 | 1.73 | 5.03 | 1.80 | 5.08 | 1.74 | 0.265 | 0.791 |
| 16. Because I believe that a few additional years of education will improve my competence as a worker | 4.96 | 1.75 | 4.79 | 1.81 | 4.92 | 1.77 | 0.656 | 0.513 |
| Extrinsic motivation - Identified - Total | 20.36 | 6.07 | 19.60 | 6.05 | 20.15 | 6.06 | 0.844 | 0.399 |
| Extrinsic motivation - Introjected |
| 17. To prove to myself that I am capable of completing my college degree | 5.07 | 1.75 | 4.63 | 1.89 | 4.95 | 1.80 | 1.648 | 0.101 |
| 18. Because of the fact that when I succeed in college I feel important | 4.89 | 1.82 | 4.76 | 1.78 | 4.86 | 1.81 | 0.496 | 0.621 |
| 19. To show myself that I am an intelligent person | 4.65 | 1.85 | 4.76 | 1.81 | 4.68 | 1.83 | -0.424 | 0.672 |
| 20. Because I want to show myself that I can succeed in my studies | 4.90 | 1.86 | 4.78 | 1.90 | 4.87 | 1.87 | 0.442 | 0.659 |
| Extrinsic motivation - Introjected - Total | 19.51 | 6.13 | 18.94 | 6.43 | 19.36 | 6.21 | 0.628 | 0.531 |
*SD: Standard deviation; p<0.05 considered statistically significant
Comparison of motivation between students who repeated in college and students who never repeated.
| Have you repeated any year in college | No(N=170) | Yes(N=63) | Total (N=233) | t-value | p-value |
|---|
| Mean | SD | Mean | SD | Mean | SD |
|---|
| Extrinsic motivation - External regulation |
| 21. Because with only a high-school degree I would not find a high-paying job later on | 4.81 | 1.92 | 4.11 | 1.83 | 4.62 | 1.92 | 2.503 | 0.013 |
| 22. In order to obtain a more prestigious job later on | 4.79 | 1.85 | 4.30 | 1.60 | 4.66 | 1.80 | 1.867 | 0.063 |
| 23. Because I want to have “the good life” later on | 5.24 | 1.80 | 5.22 | 1.66 | 5.23 | 1.76 | 0.050 | 0.960 |
| 24. In order to have a better salary later on | 4.99 | 1.87 | 4.68 | 1.73 | 4.91 | 1.84 | 1.130 | 0.260 |
| Extrinsic motivation - External regulation - Total | 19.83 | 6.05 | 18.32 | 5.74 | 19.42 | 5.99 | 1.718 | 0.087 |
| Amotivation |
| 25. Honestly, I don’t know; I really feel that I am wasting my time in school | 2.91 | 2.05 | 2.81 | 1.93 | 2.88 | 2.02 | 0.343 | 0.732 |
| 26. I once had good reasons for going to college; however, now I wonder whether I should continue | 3.09 | 2.06 | 3.37 | 2.07 | 3.17 | 2.06 | -0.892 | 0.373 |
| 27. I can’t see why I go to college and frankly, I couldn’t care less | 2.91 | 2.06 | 2.87 | 2.02 | 2.90 | 2.05 | 0.109 | 0.914 |
| 28. I don’t know; I can’t understand what I am doing in school | 2.84 | 2.10 | 2.78 | 1.93 | 2.82 | 2.06 | 0.209 | 0.835 |
| Amotivation - Total | 11.75 | 7.26 | 11.83 | 7.07 | 11.77 | 7.20 | -0.068 | 0.946 |
*SD: Standard deviation; p<0.05 considered statistically significant
Intrinsic Motivation (IM)- To Know
The IM factors for the students to go to college were ‘The pleasure they experience when they discover new things never seen before’ were 166 (71.2%), followed by ‘Because their study allow them to continue to learn about many things that interest them,’ 151 (64.8%).
IM-Towards Accomplishment and Experience Stimulation
Major IM factors- towards accomplishment were ‘The satisfaction they feel when they are in the process of accomplishing difficult academic activities was 143 (61.4%). ‘The pleasure that they experience while they are surpassing themselves in one of their personal accomplishments, 140 (60.1%) and ‘The intense feelings they experience when they are communicating their own ideas to others’ was 140 (60.1%) [Table/Fig-6].
Motivation levels across different dimensions (Intrinsic, Extrinsic and Amotivation).
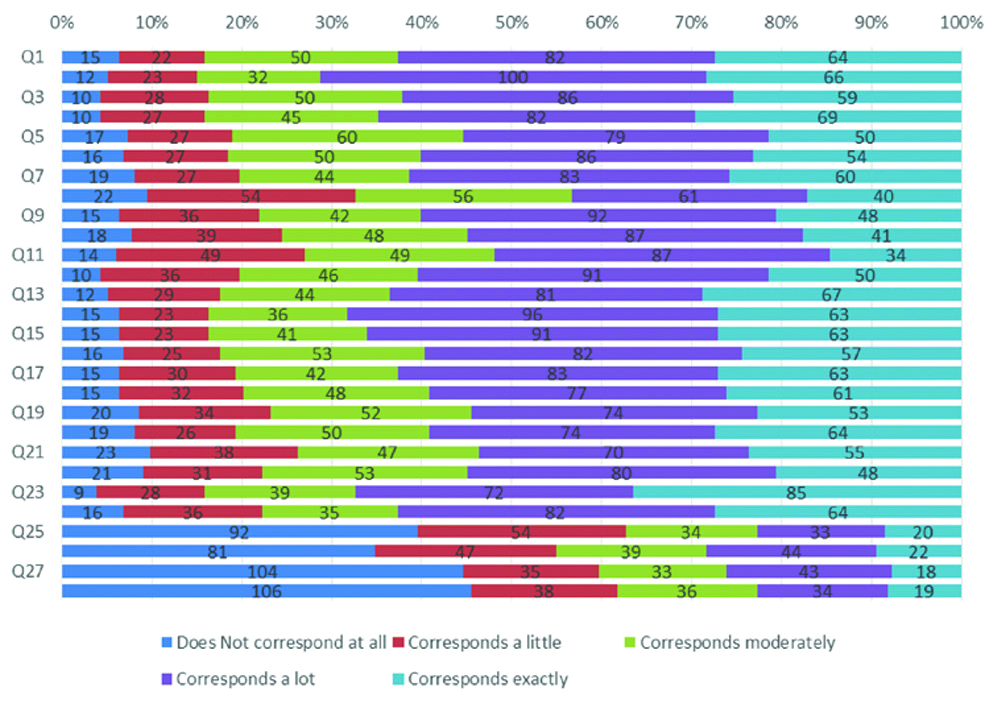
Extrinsic Motivation- Identified
Most of the students, 159 (68.2%) were of the opinion that ‘It will enable them to enter the job market in a field that they like’ and 154 (66.1%) students said ‘This will help them make a better choice regarding their career orientation. A small proportion of students 41 (17.60%) said it either ‘does not correspond at all’ or corresponds a little when it comes to ‘Think that a college education will help them better prepare for the career they have chosen’.
Extrinsic Motivation- Introjected
Major extrinsic motivational factors were ‘To prove to themselves that they are capable of completing their college degree’ in 146 (62.6%) students. They want to show themselves that they can succeed in their studies’ in 138 (59.30%) and 34 students believe that, the factor ‘To show themselves that they are intelligent person’ corresponds a little 34 (14.6%).
Extrinsic Motivation-External Regulation
The factors that ‘They want to have “the good life” later on’ and’ To have a better salary later on’ corresponds a lot with 157 (67.4%) and 146 (62.7%) respectively for the students.
Amotivation
It does not correspond at all for students that ‘They can’t see why they go to college and frankly, they couldn’t care less’ 104 (44.6%) and ‘They don’t know; they can’t understand what I am doing in school’ in 106 (45.5%) [Table/Fig-6].
Analysis showed that, there was no significant difference in the mean scores of motivations in all dimensions except ‘Extrinsic Motivation-Regulation’ p-value=0.006. There was a mean score of 16.63 in the 2nd year and it increases over the years. The mean score at 6th year was 22.03 and it decreases during internship with mean score of 20.58 [Table/Fig-7,8].
Comparison of Motivational scores between students studying in different academic years across different dimensions.
| Dimensions | Academic year | N | Mean | Std. deviation | F-value | p-value |
|---|
| Intrinsic motivation -To know | 1st year (Pre-medical) | 6 | 20.67 | 6.250 | 1.233 | 0.290 |
| 2nd year (1st Basic sciences preclinical year) | 41 | 19.29 | 5.989 |
| 3rd year (2nd Basic sciences preclinical year) | 47 | 19.40 | 6.279 |
| 4th year (1st Clinical year) | 38 | 21.11 | 6.281 |
| 5th year (2nd Clinical year) | 31 | 19.65 | 5.219 |
| 6th year (3rd Clinical year) | 34 | 22.29 | 4.296 |
| Internship | 36 | 20.28 | 6.336 |
| Total | 233 | 20.28 | 5.868 |
| Intrinsic motivation -Towards accomplishment | 1st year (Pre-medical) | 6 | 42.67 | 10.270 | 0.631 | 0.706 |
| 2nd year (1st Basic sciences preclinical year) | 41 | 36.22 | 10.841 |
| 3rd year (2nd Basic sciences preclinical year) | 47 | 37.43 | 11.049 |
| 4th year (1st Clinical year) | 38 | 36.03 | 12.740 |
| 5th year (2nd Clinical year) | 31 | 37.90 | 9.565 |
| 6th year (3rd Clinical year) | 34 | 39.47 | 9.897 |
| Internship | 36 | 37.53 | 10.533 |
| Total | 233 | 37.50 | 10.819 |
| Extrinsic motivation -identified | 1st year (Pre-medical) | 6 | 22.83 | 5.154 | 1.158 | 0.330 |
| 2nd year (1st Basic sciences preclinical year) | 41 | 19.51 | 5.754 |
| 3rd year (2nd Basic sciences preclinical year) | 47 | 19.17 | 6.141 |
| 4th year (1st Clinical year) | 38 | 21.11 | 6.559 |
| 5th year (2nd Clinical year) | 31 | 21.35 | 4.454 |
| 6th year (3rd Clinical year) | 34 | 20.91 | 5.895 |
| Internship | 36 | 18.97 | 7.073 |
| Total | 233 | 20.15 | 6.064 |
*p<0.05 considered statistically significant
Comparison of Motivational scores between students studying in different academic years across different dimensions.
| Dimensions | Academic year | N | Mean | Std. deviation | F-value | p-value |
|---|
| Extrinsic motivation-Introjected | 1st year (Pre-medical) | 6 | 20.67 | 4.320 | 0.613 | 0.719 |
| 2nd year (1st Basic sciences preclinical year) | 41 | 18.63 | 6.131 |
| 3rd year (2nd Basic sciences preclinical year) | 47 | 19.96 | 4.903 |
| 4th year (1st Clinical year) | 38 | 18.55 | 6.892 |
| 5th year (2nd Clinical year) | 31 | 19.42 | 6.816 |
| 6th year (3rd Clinical year) | 34 | 20.65 | 6.119 |
| Internship | 36 | 18.75 | 6.979 |
| Total | 233 | 19.36 | 6.207 |
| Extrinsic motivation- External regulation | 1st year (Premedical) | 6 | 20.00 | 6.870 | 3.118 | 0.006 |
| 2nd year (1st Basic sciences preclinical year) | 41 | 16.63 | 5.200 |
| 3rd year (2nd Basic sciences preclinical year) | 47 | 18.89 | 5.506 |
| 4th year (1st Clinical year) | 38 | 18.97 | 6.149 |
| 5th year (2nd Clinical year) | 31 | 20.13 | 5.982 |
| 6th year (3rd Clinical year) | 34 | 22.03 | 6.113 |
| Internship | 36 | 20.58 | 6.030 |
| Total | 233 | 19.42 | 5.991 |
| Amotivation | 1st year (Premedical) | 6 | 14.00 | 9.633 | 0.729 | 0.627 |
| 2nd year (1st Basic sciences preclinical year) | 41 | 12.07 | 6.922 |
| 3rd year (2nd Basic sciences preclinical year) | 47 | 12.17 | 6.982 |
| 4th year (1st Clinical year) | 38 | 10.66 | 7.049 |
| 5th year (2nd Clinical year) | 31 | 12.35 | 7.378 |
| 6th year (3rd Clinical year) | 34 | 10.12 | 7.729 |
| Internship due | 36 | 12.78 | 7.011 |
| Total | 233 | 11.77 | 7.196 |
*p<0.05 considered statistically significant
Discussion
Overall, it becomes clear from the study that both intrinsic and extrinsic factors of motivation play an important role on academic performance of students. The results of this study support the previous studies that showed such a relation between motivation and academic performance [14-17]. In observations, it has been established that the score of motivation was slightly over than the mediocre range. The learners having extrinsic type of motivation have been observed to have good scores which indicates a behavioural pattern for the individual academic gains [18]. The core objective behind the work lies in establishing the relation between the motivation and academic performances of the students. There have been resemblances with the studies conducted earlier in this regard [19].
A similar study done in University of Brasilia on 297 medical students from consecutive classes in four year time frame using AMS showed similar values for subdomains of internal motivation and EM, except for Amotivation which was found to be less 5.68±2.63 compared to Amotivation in present study (11.77±7.19). Classification analysis identified distinct pattern of motivation across classes which is in congruous with present study, where there was high levels of Intrinsic and extrinsic motivation on entering the medical course which fluctuates as students’ progress to higher grades and strikingly low in internship. One of the reason for plummeting of motivation in internship can be attributed to absence of evaluation exams [20]. The current study adds to the existing study by Christopher OW et al., in Oklahoma which used AMS, noted IM, EM and Amotivation to be 4.04±0.85, 4.19±1.87 and 4.39±0.73, respectively [21].
There might be different opinion about the results found in the study. However, facts remain consistent that there are various influencing factors which affect motivational levels, learning and the desired outcomes of the study. There can be data differences in this regard too [20]. Nonetheless, whatsoever the case be, after all the finding remains intact that the gender differences too play a significant role in motivation and its impact on learning.
Limitation(s)
Present study attempted to know the different motivational dimensions across students in different years of college and between students who repeated any year and didn’t repeat, but fails to compare different motivations dimensions with respect to gender. Study findings did not correlate distinct patterns of motivation with GPA levels.
Conclusion(s)
The present study supplies an insight on motivation and its influence on academic gains in the academic career of students. There are various stimulators which affect the learning experience of the student. This research enables to identify the possible barriers in the entire process of the learning experience of the student. The psychological research into educational motivation focuses on mainly improving the students’ academic performance based on either need based analysis or behavioural approach. Subjective differences are crucial for understanding motivation. Prompt efforts are needed with further research on micro level behaviour to compliment their academic grades and macro level analysis.
*SD: Standard deviation
*SD: Standard deviation; p<0.05 considered statistically significant
*SD: Standard deviation; p<0.05 considered statistically significant
*SD: Standard deviation; p<0.05 considered statistically significant