Estimation of Glycated Haemoglobin by Nephelometry, Ion Exchange Resin and High Performance Liquid Chromatography: A Cross-sectional Study
Mangalore Balakrishna Prathima1, Shridhar Reshma2, Sushith3, Prathiksha Shetty4, D’Sa Janice5, Bhuvanesh Sukhlal Kalal6, Gopal R Madan7
1 Associate Professor, Department of Biochemistry, A. J. Institute of Medical Sciences and Research Centre, Mangaluru, Karnataka, India.
2 Associate Professor, Department of Biochemistry, A. J. Institute of Medical Sciences and Research Centre, Mangaluru, Karnataka, India.
3 Professor and Head, Department of Biochemistry, A. J. Institute of Medical Sciences and Research Centre, Mangaluru, Karnataka, India.
4 Postgraduate, Department of Biochemistry, A. J. Institute of Medical Sciences and Research Centre, Mangaluru, Karnataka, India.
5 Assistant Professor, Department of Biochemistry, A. J. Institute of Medical Sciences and Research Centre, Mangaluru, Karnataka, India.
6 Assistant Professor, Department of Pharmacology, A. J. Research Centre, A. J. Institute of Medical Sciences and Research Centre, Mangaluru, Karnataka, India.
7 Assistant Professor, Department of Biochemistry, A. J. Institute of Medical Sciences and Research Centre, Mangaluru, Karnataka, India.
NAME, ADDRESS, E-MAIL ID OF THE CORRESPONDING AUTHOR: Dr. Bhuvanesh Sukhlal Kalal, Assistant Professor, Department of Pharmacology, A. J. Research Centre, A. J. Institute of Medical Sciences and Research Centre, Mangaluru-575004, Karnataka, India.
E-mail: bhuvanesh611@gmail.com
Introduction
Diabetes mellitus cases are continually rising all over the world. Glycated haemoglobin (HbA1c) used as a diagnostic test to measure long-term average glycaemic control in diabetic patients.
Aim
To assess the precision and reproducibility of the Ion Exchange Column Chromatography Resin (IECR) method and nephelometry in comparison to High-Performance Liquid Chromatography (HPLC) with respect to the estimation of HbA1c.
Materials and Methods
A cross-sectional comparative study was conducted on 50 blood samples, collected from the diabetic subjects at the Department of Biochemistry and their HbA1c values were estimated by HPLC based BioRad D-10, nephelometry and IECR techniques. HPLC was used as a gold standard method, to evaluate the sensitivity and specificity of nephelometry and IECR techniques. Data were expressed as mean±standard deviation and intraclass Correlation Coefficient and Pearson correlation were calculated.
Results
The mean age of the study subjects was 53.06±7.67 years. The mean plasma HbA1c levels were 8.16±2.9, 7.62±2.5 and 7.84±2.5 and mean estimated Average Glucose (eAG) was 187.00±84.4, 172.0±76.8, and 289.46±199.9 by HPLC, Nephelometry and IECR, respectively. Compared with HPLC, nephelometry had excellent correlation (r-value 0.925); p<0.001) and IECR (r-value 0.869; p<0.001).
Conclusion
Nephelometry and IECR both had better performance and showed a greater concordance with gold standard HPLC. Therefore, nephelometry and IECR can be used as an alternative assay for HbA1c estimation.
Diabetes mellitus, Enzymatic assay, India, Test performance
Introduction
Diabetes mellitus is a chronic metabolic disease characterised by high blood glucose (hyperglycaemia) resulting from insufficient insulin production or defects in insulin action, or both. It affects almost all the body organs and prolongs hyperglycaemia can lead to life-threatening complications and defects [1].
HbA1c is a haemoglobin-glucose complex that is formed non-enzymatically inside the cell [2]. Determination of HbA1c is a good index of blood glucose in a given past period. HbA1c levels are the means of blood sugar of last 8-12 week., therefore it is used as gold standard for monitoring patients’ blood sugar level [3]. Results of HbA1c measuring are used in the management of diabetic patients. Hence, the agreement of results between different HbA1c measuring methods and kits is critical in medical decision making [4].
A single glucose determination gives a value which is true only at the time when the blood sample is drawn and measurement of HbA1c correlated with an individual’s mean blood glucose over the preceding eight to 12 weeks [5]. HbA1c is unaffected by diet, Insulin or exercise on the day of testing and thus reflects the average glucose level over the last several weeks thereby, giving a status of the long term metabolic control of glucose in individuals [6]. HbA1c is now widely recognised as an important test for the diagnosis of diabetes mellitus and is a reliable indicator of the efficacy of therapy. Increased levels of HbA1c are directly linked with a greater risk of complications from diabetes. Therefore, the guidelines also recommend the monitoring of HbA1c [7].
Clinical laboratories use different techniques such as liquid chromatography, electrophoresis, boronate affinity, and ion-exchange chromatography, immunoassay and spectrophotometry are used for accurate measurement of HbA1c [8,9]. These methods are based on molecular charge or structure or chemical formulation. HPLC is considered “gold standard” and routinely used methods that have high validity, accuracy, and stability [10]. However, the different types of haemoglobin variants on HbA1c can influence the results [11]. Additionally, the cost of HPLC device, tedious and time-consuming sample processing which requires skilled personal, professionals are looking for an alternative method to detect and monitor HbA1c which is cheaper and cost-effective for all laboratories [12]. Several studies have compared different methods with HPLC however, results are still not well satisfied due to the inconsistency of HbA1c [4,13-16]. A rather alternate validated method is required to detect HbA1c.
The nephelometry methodology is a reliable, time-saving and non-tedious and is for estimation of HbA1c following National Glycohaemoglobin Standardisation Program guidelines [17,18]. It measures the scattered light from the surface of latex particles [19]. The analyser provides direct results in percentage HbA1c and it does not need haemoglobin measurement. Hence, the automated system has been adopted and it results in excellent reproducibility among laboratory settings. It has the advantages of accuracy, sensitivity and low cost compared to HPLC [20]. IECR is a method of molecular separation based on their charge. It is less time consuming and considered a more reliable method of HbA1c detection [21].
Therefore, the present study was taken up to evaluate the analytical performance of the most common cost-effective technique i.e., nephelometry, and ion-exchange chromatography, in comparison with the gold standard HPLC method for estimation of glycated HbA1c.
Materials and Methods
A cross-sectional comparative study between three methods HPLC, Nephelometry and IECR was conducted on diabetic patients who were referred to the central diagnostic laboratory facility of hospital, AJ Institute of Medical Sciences and Research Centre, Mangaluru, Karnataka, India, for HbA1c estimation from April 2016 to October 2016. The study was approved by the Institutional Ethics Committee (AJEC/REV/12/2016). Sample size was calculated using formula: n= {n0/(1+((n0-1)/N))}. Where, n-adjusted sample size; n0-the initial sample size; N-the population size. Using this sample size minimum sample required to obtain 80% power was 34 and present study sample size was 50.
Diabetic patients, aged above 20 years, without any history of long-term complications were included in the study. Pregnant women and patients with anemia, renal diseases, hepatic diseases, cardiac diseases, and hypertension were excluded from the study. The informed consent was obtained from each subject and a blood sample (2 mL) was collected in EDTA vacutainer and stored at -4°C.
Biochemical Parameters
HbA1c was estimated by HPLC D-10 (Bio-Rad Laboratories, Hercules, CA, USA), nephelometry (MISPA i2, AGAPPE Diagnostics GmbH, Switzerland) and the IECR method. HPLC D-10 system works on chromatographic separation of haemoglobin fractions. It is an automated system where the samples are loaded directly, diluted, and injected into the analytical cartridge. The separation of haemoglobin-based on its ionic interactions with the cartridge and the analytical flow path is measured at 415 nm [22].
Nephelometry utilises an antigen-antibody interaction method to determine HbA1c in whole blood. Non-specific adsorption of HbA1c to latex particle forms a complex with mouse anti-human HbA1c monoclonal antibodies. Anti-mouse IgG antibody interacts with the monoclonal antibodies and agglutination occurs. The quantity of agglutination is measure by nephelometry, standard curve are made and used to measure the percentage of HbA1c [23,24].
In the IECR method, the IECR separator is used to separate charged amino acid side chains based on its electrostatic interactions and HbA1c and non-glycosylated fraction is eluted out [25]. Maintaining the HPLC as a gold standard method, IECR and nephelometry method were evaluated in the terms of sensitivity and specificity. The subjects were grouped based on their HbA1c levels as follows: Group 1: Below 6%; Group 2: 6-9%; and Group 3: Above 9% [4]. estimated Average Glucose (eAG) was calculated using previously reported formula eAG=(28.7×HbA1c-46.7]) mg/dL [26].
Statistical Analysis
Statistical analysis were done using Statistical Package for the Social Sciences (SPSS Inc, Chicago, IL) version 11.0. All quantitative data were expressed as mean±Standard Deviation (SD). Intraclass Correlation Coefficient and Pearson correlation were calculated. Receiver Operating Characteristic (ROC) curve, sensitivity, and specificity were calculated for all three methods. The p-value <0.05 was considered to be statistically significant.
Results
The mean age of the study subjects were 53.06±7.67 years. Majority of the study subjects were between the age group of 51-60 years [Table/Fig-1]. The biochemical parameters of the study group are shown in [Table/Fig-2]. Most of these parameters fall under normal category with no significant differences.
Age distribution in the cases.
| Age (years) | Male | Female | Frequency |
|---|
| 40 and below | 3 | 2 | 5 |
| 41-50 | 4 | 8 | 10 |
| 51-60 | 21 | 12 | 35 |
| Total | 28 | 22 | 50 |
Clinical and biochemical parameters of the overall study group.
| Parameter | Mean±Standard deviation | Normal reference range |
|---|
| Pulse rate (bpm) | 76.8±8.9 | 60-100 |
| Systolic BP (mmHg) | 124.5±19.8 | Upto 120 |
| Diastolic BP (mmHg) | 76.4±8.5 | Upto 80 |
| Hb (%) | 11.4±2.2 | Males:13.8 -17.2; Females:12.1-15.1 |
| FBS (mg/dL) | 150.2±76.4 | 70-110 |
| RBS (mg/dL) | 152.5±62.8 | 70-140 |
| PPBS (mg/dL) | 200±81.9 | Upto 140 |
| Blood Urea (mg/dL) | 27.4±14.5 | 12-40 |
| Serum Creatinine (mg/dL) | 1.2±1.0 | Males: 0.7-1.4; Females: 0.6-1.2 |
| Serum uric acid (mg/dL) | 4.5±1.7 | Males: 3.4-7; Females: 2.5-6 |
| Sodium (mEq/L) | 131.0±7.3 | 135-145 |
| Potassium (mEq/L) | 4.1±0.5 | 3.5 -5 |
| Chloride (mEq/L) | 97.7±6.5 | 95-105 |
| Total bilirubin (mg/dL) | 0.9±0.9 | Upto 1.2 |
| Direct bilirubin (mg/dL) | 0.3±0.5 | <0.3 |
| Total protein (g/dL) | 6.5±0.6 | 6-8 |
| Serum albumin (g/dL) | 3.6±0.4 | 3.5-5.5 |
| Serum globulin (g/dL) | 2.9±0.6 | 2.0-3.5 |
| AST (IU/L) | 33.6±21.3 | 5-40 |
| ALT (IU/L) | 24.9±14.7 | 5-40 |
| ALP (IU/L) | 239.5±165.5 | 20-140 |
Hb: Haemoglobin; FBS: Fasting blood sugar; RBS: Random blood sugar; PPBS: Post Prandial blood sugar; AST: Aspartate transaminase; ALT: Alanine transaminase; ALP: Alkaline phosphatase
The mean of HbA1c by the HPLC method was higher than that of nephelometry and IECR. The mean HbA1c of group 1 was higher (p<0.05) when it was estimated by the IECR method, whereas it was found that the HbA1c measured in groups 2 and 3 was higher when estimated by HPLC. The mean eAG was significantly higher in all groups when it was estimated by the IECR method [Table/Fig-3].
Mean HbA1c and eAG of three methods amongst HPLC, nephelometry, and IECR.
| Parameter | Method | Mean±SD<6% (Group 1) | Mean±SD6-9% (Group 2) | Mean±SD>9% (Group 3) | Mean±SDOverall |
|---|
| HbA1c | HPLC% | 5.16±0.5 | 7.38±0.7 | 11.63±1.3 | 8.16±2.9 |
| Nephelometry% | 4.97±0.5 | 7.22±0.76 | 10.47±1.65 | 7.62±2.5 |
| Ion exchange resin% | 5.99±0.8 | 7.18±1.57 | 10.13±2.71 | 7.84±2.5 |
| eAG | HPLC% | 101.0±14.4 | 164.73±22.3 | 286.78±39.7 | 187.00±84.4 |
| Nephelometry% | 95.64±14.3 | 160.0±22.1 | 270.60±32.43 | 172.0±76.8 |
| Ion exchange resin% | 108.0±24.7* | 215.73±39.1** | 522.22±135.3** | 289.46±199.9** |
*p<0.05; **p<0.01; HPLC: High performance liquid chromatography; HbA1c: Glycated haemoglobin; eAG: Estimated average glucose; SD: Standard deviation; Group 1, 2, 3 are based on HbA1c concentration
Considering a cut-off of 6.5% the sensitivity, the specificity of HPLC, Nephelometry, and IECR was calculated using the Receiver Operator Curve (ROC). Area Under Curve (AUC) for HPLC was 1 (95% confidence interval (CI) 0.93 to 1); for nephelometry 1 (95% CI 0.93 to 1); and for IECR was 0.863 (95% CI 0.73 to 0.94) [Table/Fig-4,5].
Receiver Operator Curve (ROC) of HbA1c estimation by HPLC and IECR method.
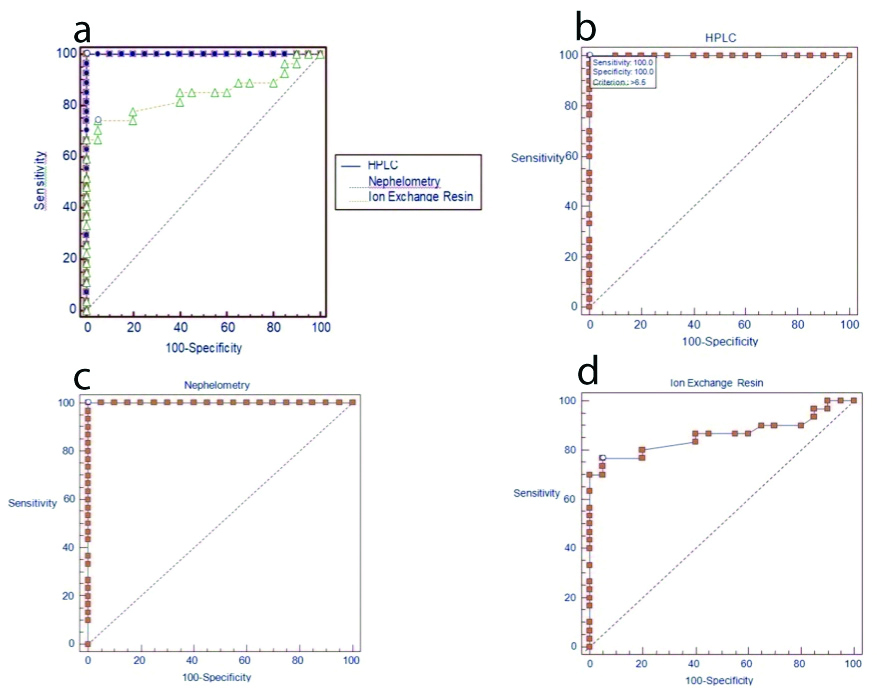
ROC of HbA1c% estimation by HPLC, nephelometry and IECR.
| Method | The area under the curve | Standard error | Asymptotic significance* | Asymptotic 95% confidence interval |
|---|
| Lower bound | Upper bound |
|---|
| HPLC | 1 | 0 | <0.001 | 0.929 | 1.000 |
| Nephelometry | 1 | 0 | <0.001 | 0.929 | 1.000 |
| Ion exchange resin | 0.863 | 0.0545 | <0.001 | 0.733 | 0.942 |
*p-value<0.001 is considered statistically significant
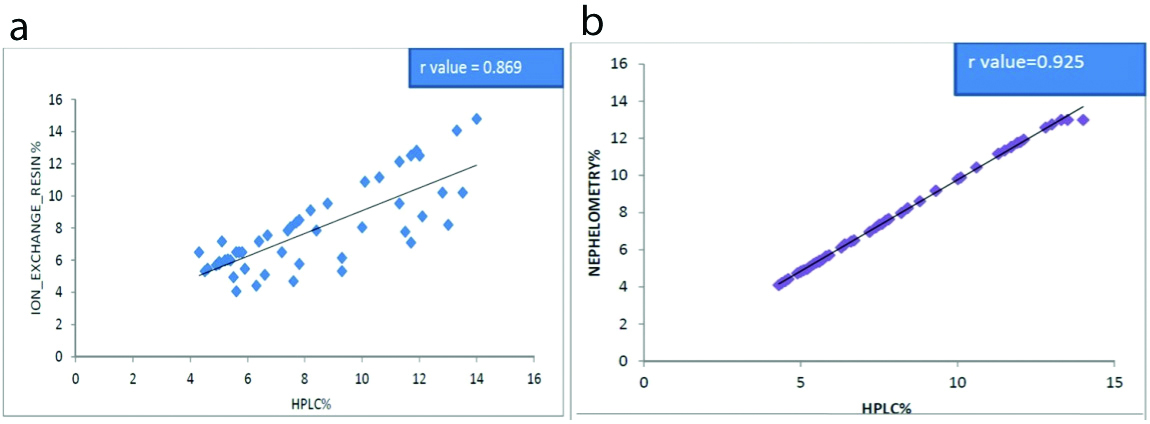
The intra-class correlation was performed to determine the reliability of HPLC and IECR [Table/Fig-6a,7]. High similarity was observed between HPLC and nephelometry (r-value 0.925) [Table/Fig-6b]. Nephelometry percentage shows significant fair agreement (r-value 0.756) with IECR% (p-value is <0.001) which was statistically highly significant [Table/Fig-7]. A high similarity was observed between nephelometry and the IECR method. Pearson correlation of Fasting Blood Sugar (FBS) showed a significant positive correlation with HbA1c estimated with HPLC (r=0.562; p-value <0.001), nephelometry (r=0.556; p-value <0.001), and IECR method (r=0.538; p-value <0.001). The sensitivity and specificity were 100% and 95%, 100% and 81% and 97% and 80% for HPLC, Nephelometry, and IECR respectively [Table/Fig-8].
The intra-class correlation coefficient between (a) HPLC and ion exchange resin, (b) HPLC and nephelometry method.
HPLC: High-performance liquid chromatography
Intra-class correlation coefficient between nephelometry and ion exchange resin.
| Intra-class correlation* | F value | 95% confidence interval | p-value |
|---|
| Lower bound | Upper bound |
|---|
| HPLC-Ion exchange resin | 0.869 | 7.706 | 0.771 | 0.926 | <0.001 |
| Nephelometry-Ion exchange resin | 0.756 | 4.062 | 0.570 | 0.862 | <0.001 |
| HPLC-Nephelometry | 0.925 | 14.819 | 0.856 | 0.959 | <0.001 |
Sensitivity, specificity, positive and negative predictive values, and accuracy of three tests.
| Test | HPLC | Nephelometry | Ion exchange resin |
|---|
| Sensitivity | 100% | 100% | 97% |
| Specificity | 95% | 81% | 80% |
| Positive predictive value | 97% | 89% | 80% |
| Negative predictive value | 100% | 100% | 97% |
| Accuracy | 98% | 93% | 89% |
Discussion
HbA1c has been used as a gold standard for assessing mean glycaemia and also a measure of risk for the development of diabetes mellitus related complications [10]. The study compared the analytical performance of the estimation of HbA1c by three different methods that are currently in practice. It shows the agreement between the HPLC, nephelometry, and IECR method in measuring HbA1c and was found to be good but there was variability amongst HbA1c values measured in the IECR method.
IECR correlated well with HPLC, with a 97% sensitivity and 80% specificity which probably reflects the decreased precision of the IECR method, although even in this case the relationship was highly significant which was similar to Hamwi A et al., study [27]. The best correlation with HPLC was found with nephelometry with a sensitivity of 100% and a specificity of 81%. The present study results were consistent with the Rukmini MS et al., [25], where the HPLC and IECR were compared for HbA1c quantification and showed sensitivity and specificity of 94% and 62.4% as in present study it was 97% and 80%, respectively [Table/Fig-8].
Amongst the subjects, the mean and standard deviation of the HbA1c value was found to be higher for group 1 when estimated by the IECR method. Whereas, the mean and standard deviation of HbA1c measured in groups 2 and 3 were higher when measured by HPLC. These findings were in accordance with a study done by Gautam N et al., [28]. This indicates that maximum patients were under the risk of developing complications related to diabetes mellitus and also reflect poor management of diabetic patients in this region because of ignorance, poverty, poor health education, unawareness about diabetes control programs, etc., [29,30].
The present study showed a better function and excellent agreement of nephelometry to HPLC compared with the IECR method. Nephelometry showed significant fair agreement with IECR (p<0.001). The findings were in accordance with the studies of Al-Lawati JA and Al-Lawati AM and Ankush RD et al., [31,32]. Good relationship and concordance between the different methods as indicated in other studies support the reliability of properly used different methods. Nephelometry shows excellent correlation with the reference HPLC method (r=0.925; p<0.001). IECR shows good correlation with reference HPLC (r=0.869; p<0.001). Eckerbom S et al., showed an even better correlation, when they analysed 131 patient samples analysed on the Bio-Rad Diamat system and with the Mono S column for HbA1c show that higher levels of HbA1c are achieved with the Diamat system [21]. These could be due to different chromatographic efficiency among HPLC and Diamat system.
Although HPLC is considered as “gold standard” for the measurement of HbA1c, it has several disadvantages such as cost, assay times and requirement of special laboratory skill [11]. Therefore, the alternate reliable method is needed which has a close strong correlation with HPLC. This quick method is helpful to obtain the report during patients’ visits without any delay and that gives better opportunities for clinical decision-making and changes in the treatment regimen [26].
Limitation(s)
Small sample size, variables confounding factors that affect HbA1c in patients with diabetes such as diabetic stage, residual insulin and age factor. In addition, sensitivity and specificity of each equipment may affects the results.
Conclusion(s)
Although HPLC is considered to be the gold standard method for the estimation of HbA1c, the present study shows an excellent correlation of nephelometry and IECR method with HPLC. Compare with, HPLC, both methods are fast, cheaper, reliable, and non-tedious methods compared to HPLC. It may be useful to make early clinical decision-making and changes in the treatment regimen thereby can reduce the huge economic burden of diabetes patients with lower socioeconomic status.
Hb: Haemoglobin; FBS: Fasting blood sugar; RBS: Random blood sugar; PPBS: Post Prandial blood sugar; AST: Aspartate transaminase; ALT: Alanine transaminase; ALP: Alkaline phosphatase
*p<0.05; **p<0.01; HPLC: High performance liquid chromatography; HbA1c: Glycated haemoglobin; eAG: Estimated average glucose; SD: Standard deviation; Group 1, 2, 3 are based on HbA1c concentration
*p-value<0.001 is considered statistically significant
Author Declaration:
Financial or Other Competing Interests: None
Was Ethics Committee Approval obtained for this study? Yes
Was informed consent obtained from the subjects involved in the study? Yes
For any images presented appropriate consent has been obtained from the subjects. NA
Plagiarism Checking Methods: [Jain H et al.]
Plagiarism X-checker: Mar 23, 2020
Manual Googling: Jun 02, 2020
iThenticate Software: Aug 04, 2020 (20%)
[1]. Diagnosis and classification of diabetes mellitusDiabetes care 2013 36(Suppl 1):S67-74.Epub 2013/01/0410.2337/dc13-S06723264425 [Google Scholar] [CrossRef] [PubMed]
[2]. Little RR, Roberts WL, A review of variant haemoglobins interfering with haemoglobin A1c measurementJ Diabetes Sci Technol 2009 3(3):446-51.Epub 2010/02/1110.1177/19322968090030030720144281 [Google Scholar] [CrossRef] [PubMed]
[3]. Kojic Damjanov S, Deric M, Eremic Kojic N, Glycated haemoglobin A1c as a modern biochemical marker of glucose regulationMedicinski Pregled 2014 67(9-10):339-44.Epub 2014/12/3110.2298/MPNS1410339K25546982 [Google Scholar] [CrossRef] [PubMed]
[4]. Sherwani SI, Khan HA, Ekhzaimy A, Masood A, Sakharkar MK, Significance of HbA1c test in diagnosis and prognosis of diabetic patientsBiomarker Insights 2016 11:95-104.Epub 2016/07/1210.4137/BMI.S3844027398023 [Google Scholar] [CrossRef] [PubMed]
[5]. Chehregosha H, Khamseh ME, Malek M, Hosseinpanah F, Ismail-Beigi F, A view beyond HbA1c: Role of continuous glucose monitoringDiabetes therapy: Research, treatment and education of diabetes and related disorders 2019 10(3):853-63.Epub 2019/05/0110.1007/s13300-019-0619-131037553 [Google Scholar] [CrossRef] [PubMed]
[6]. Bacchi E, Negri C, Trombetta M, Zanolin ME, Lanza M, Bonora E, Differences in the acute effects of aerobic and resistance exercise in subjects with type 2 diabetes: Results from the RAED2 randomized trialPloS one 2012 7(12):e49937Epub 2012/12/1210.1371/journal.pone.004993723227155 [Google Scholar] [CrossRef] [PubMed]
[7]. Bajaj S, RSSDI clinical practice recommendations for the management of type 2 diabetes mellitus 2017Int J Diabetes Dev C 2018 38(Suppl 1):01-115.Epub 2018/03/1310.1007/s13410-018-0604-729527102 [Google Scholar] [CrossRef] [PubMed]
[8]. Weykamp C, HbA1c: A review of analytical and clinical aspectsAnnals of Laboratory Medicine 2013 33(6):393-400.Epub 2013/11/1010.3343/alm.2013.33.6.39324205486 [Google Scholar] [CrossRef] [PubMed]
[9]. Jia W, Standardising HbA1c-based diabetes diagnosis: Opportunities and challengesExpert Review of Molecular Diagnostics 2016 16(3):343-55.Epub 2015/12/1910.1586/14737159.2016.113329926680319 [Google Scholar] [CrossRef] [PubMed]
[10]. Davis JE, McDonald JM, Jarett L, A high-performance liquid chromatography method for haemoglobin A1cDiabetes 1978 27(2):102-07.Epub 1978/02/0110.2337/diab.27.2.102624438 [Google Scholar] [CrossRef] [PubMed]
[11]. Dam AR, Ahuja AJ, Singh M, Singh R, Limitation of HPLC methodology for HBA1c estimationIndian J Pathol Microbiol 2013 56(4):483-84.Epub 2014/01/2110.4103/0377-4929.12541324441262 [Google Scholar] [CrossRef] [PubMed]
[12]. Shetty R, Rai M, Chandrashekar R, Kalal BS, Diabetogenic effect of gluten in Wistar albino rats: A preliminary preclinical screeningMedicine and Pharmacy Reports 2020 93(1):47-52.Epub 2020/03/0710.15386/mpr-137332133446 [Google Scholar] [CrossRef] [PubMed]
[13]. Özçelik F, Yiğiner O, Serdar MA, Kurt I, Öztosun M, Arslan E, Comparison of three methods for measurement of HbA1cTürk Biyokimya Dergisi (Turkish Journal of Biochemistry-Turk J Biochem) 2010 35(4):344-49. [Google Scholar]
[14]. Karami A, Baradaran A, Comparative evaluation of three different methods for HbA1c measurement with high-performance liquid chromatography in diabetic patientsAdvanced Biomedical Research 2014 3:94Epub 2014/05/0710.4103/2277-9175.12936424800183 [Google Scholar] [CrossRef] [PubMed]
[15]. Razi F, Rahnamaye Farzami M, Ebrahimi SA, Nahid M, Bigdeli MG, Sheidaei A, Comparative analytical performance of various HbA1c assays in IranArchives of Iranian Medicine 2016 19(6):414-19.Epub 2016/06/14 [Google Scholar]
[16]. Tesija Kuna A, Dukic K, Nikolac Gabaj N, Miler M, Vukasovic I, Langer S, Comparison of enzymatic assay for HBA1C measurement (Abbott Architect) with capillary electrophoresis (Sebia Minicap Flex Piercing Analyser)Laboratory Medicine 2018 49(3):231-38.Epub 2018/03/1310.1093/labmed/lmx09029528429 [Google Scholar] [CrossRef] [PubMed]
[17]. Barrot A, Dupuy AM, Badiou S, Bargnoux AS, Cristol JP, Evaluation of three turbidimetric assays for automated determination of haemoglobin A1cClinical Laboratory 2012 58(11-12):1171-77.Epub 2013/01/08 [Google Scholar]
[18]. Hoelke B, Gieringer S, Arlt M, Saal C, Comparison of nephelometric, UV-spectroscopic, and HPLC methods for high-throughput determination of aqueous drug solubility in microtiter platesAnalytical Chemistry 2009 81(8):3165-72.Epub 2009/03/2610.1021/ac900008919317458 [Google Scholar] [CrossRef] [PubMed]
[19]. Ackerman E, Rosevear JW, Immunonephelometric assaysMedical Progress Through Technology 1979 6(2):81-90.Epub 1979/01/30 [Google Scholar]
[20]. Armbruster DA, Overcash DR, Reyes J, Clinical chemistry laboratory automation in the 21st Century-Amat Victoria curam (Victory loves careful preparation)The Clinical Biochemist Reviews 2014 35(3):143-53.Epub 2014/10/23 [Google Scholar]
[21]. Eckerbom S, Bergqvist Y, Jeppsson JO, Improved method for analysis of glycated haemoglobin by ion exchange chromatographyAnnals of Clinical Biochemistry 1994 31(Pt 4):355-60.Epub 1994/07/0110.1177/0004563294031004097979102 [Google Scholar] [CrossRef] [PubMed]
[22]. Chandrashekar V, Hb A1c Separation by high performance liquid chromatography in haemoglobinopathiesScientifica 2016 2016:2698362Epub 2016/03/1910.1155/2016/2698362 [Google Scholar] [CrossRef]
[23]. Sun Q, Zheng W, Lin C, Shen D, A Low-cost micro-volume nephelometric system for quantitative immunoagglutination assaysSensors (Basel) 2019 19(20)Epub 2019/10/1210.3390/s1920435931600932 [Google Scholar] [CrossRef] [PubMed]
[24]. Koivunen ME, Krogsrud RL, Principles of immunochemical techniques used in clinical laboratoriesLaboratory medicine 2006 37(8):490-97.10.1309/MV9RM1FDLWAUWQ3F [Google Scholar] [CrossRef]
[25]. Rukmini MS, Ashritha Nishmitha P, Yalla D, Christy A, Manjrekar P, Analytical calibre of high performance liquid chromatography and ion exchange chromatography resin methods in estimation of glycated haemoglobin: A comparitive studyBiomed Res 2017 28(4):1765-69. [Google Scholar]
[26]. Nathan DM, Kuenen J, Borg R, Zheng H, Schoenfeld D, Heine RJ, Translating the A1C assay into estimated average glucose valuesDiabetes Care 2008 31(8):1473-78.Epub 2008/06/1010.2337/dc08-054518540046 [Google Scholar] [CrossRef] [PubMed]
[27]. Hamwi A, Schweiger CR, Veitl M, Schmid R, Quantitative measurement of HbA1c by an immunoturbidimetric assay compared to a standard HPLC methodAm J Clin Pathol 1995 104(1):89-95.Epub 1995/07/0110.1093/ajcp/104.1.897611190 [Google Scholar] [CrossRef] [PubMed]
[28]. Gautam N, Dubey RK, Jayan A, Nepaune Y, Padmavathi P, Chaudhary S, Comparative study of glycated haemoglobin by ion exchange chromatography and affinity binding nycocard reader in type 2 diabetes mellitusNepal Med Coll J: NMCJ 2014 16(2-4):103-08.Epub 2014/12/01 [Google Scholar]
[29]. Shah S, Kalal BS, Oxidative stress in cervical cancer and its response to chaemoradiationTurk J Obstet Gynecol 2019 16(2):124-28.Epub 2019/07/3110.4274/tjod.galenos.2019.1957731360587 [Google Scholar] [CrossRef] [PubMed]
[30]. Nishana E, Bhat SS, Sahana KS, Hegde SK, Bhat V, Kalal BS, Estimation of salivary sCD14 in children with early childhood caries in association with pneumoniaReports of Biochemistry & Molecular Biology 2019 8(2):132-38.Epub 2019/12/14 [Google Scholar]
[31]. Al-Lawati JA, Al-Lawati AM, The utility of fasting plasma glucose in predicting glycosylated haemoglobin in type 2 diabetesAnnals of Saudi Medicine 2007 27(5):347-51.Epub 2007/10/0910.5144/0256-4947.2007.34717921686 [Google Scholar] [CrossRef] [PubMed]
[32]. Ankush RD, Suryakar AN, Ankush NR, Hypomagnesaemia in type-2 diabetes mellitus patients: A study on the status of oxidative and nitrosative stressIndian J Clin Biochem: IJCB 2009 24(2):184-89.Epub 2009/04/0110.1007/s12291-009-0033-y23105830 [Google Scholar] [CrossRef] [PubMed]