According to WHO GLOBOCAN 2018 database, CRC is the third most frequently diagnosed cancer worldwide (1.8 million new cases per year, 10.2%) [1]. Mostly prevalent in developed countries with two-third of cases and around 60% mortality rate till recently, there has been a gradual shift in CRC demography in developing nations with rapid rise in incidence [2].
Genomic alterations in proto-oncogenes and suppressor genes play fundamental role in initiation and progression of neoplasms. Several such genes are implicated in CRC. p53 is one such tumour suppressor gene, known to be regulator of cell growth, repair and apoptosis. In CRC, point missense mutations in p53 leads to loss of tumour suppressor function and provide additional growth advantage [3]. Mutation in p53 gene also triggers angiogenesis by activating pro angiogenic factors like VEGF, Transforming Growth Factor β (TGF β) and TGF α creating an angiogenic micro-environment for tumour survival and progression [4,5]. MVD acting as a surrogate marker of angiogenesis, is assessed by counting number of vessels per field in most active areas of neovascularisation (hotspots) through IHC staining (CD34 or CD31) of endothelial cells [6]. So p53, VEGF and MVD are biological prognostic markers helpful in predicting risk of recurrence, probability of distant metastasis and survival rate in CRC.
The aim of the study was to analyse expression and association of p53, VEGF and MVD in colorectal carcinomas and comparison with clinicopathologial factors. Objectives were: 1) Assessment of p53, VEGF and CD34 (to assess MVD) in CRC; 2) comparison of these three with clinicopathologial factors; 3) comparison among p53, VEGF and MVD; 4) To study expression of p53, VEGF and MVD in colorectal adenomas. The study was conducted through manual tissue microarray method which proposes a way of obtaining an easier, cost-effective and less time consuming method of Immunohistochemistry (IHC) analysis in larger scale studies using multiple IHC parameters.
Materials and Methods
The ambispective study was conducted in the Department of Pathology, Kalinga Institute of Medical Sciences and PBMH, Bhubaneswar for 2 year duration from September 2015 to July 2017. IEC no was KIMS/KIIT/IEC/120/2015.
Inclusion criteria: Histologically, staged and graded (AJCC and WHO) CRC resection specimens and archival tissue blocks were included in study group.
Exclusion criteria: patients with prior history of chemotherapy and radiotherapy, endoscopic biopsies, cell blocks, mucinous and metastatic adenocarcinomas were excluded.
Out of total 70 cases, 58 (82.9%) were adenocarcinomas and 12 (17.1%) were adenomas. Tissue microarray blocks were prepared manually using adult bone marrow biopsy needle [6]. IHC was done in standard streptavidin-biotin method. For IHC anti-human p53 (clone D07) mouse monoclonal antibody, human recombinant VEGF165 rabbit polyclonal antibody, anti-human CD34 (clone QBEND/10) mouse monoclonal antibody, all from BioGenex were used. For p53, cases of breast carcinoma, for VEGF and CD34, capillary haemangioma cases were used as external positive controls. Negative control was taken from CRC tissue omitting the primary antibody.
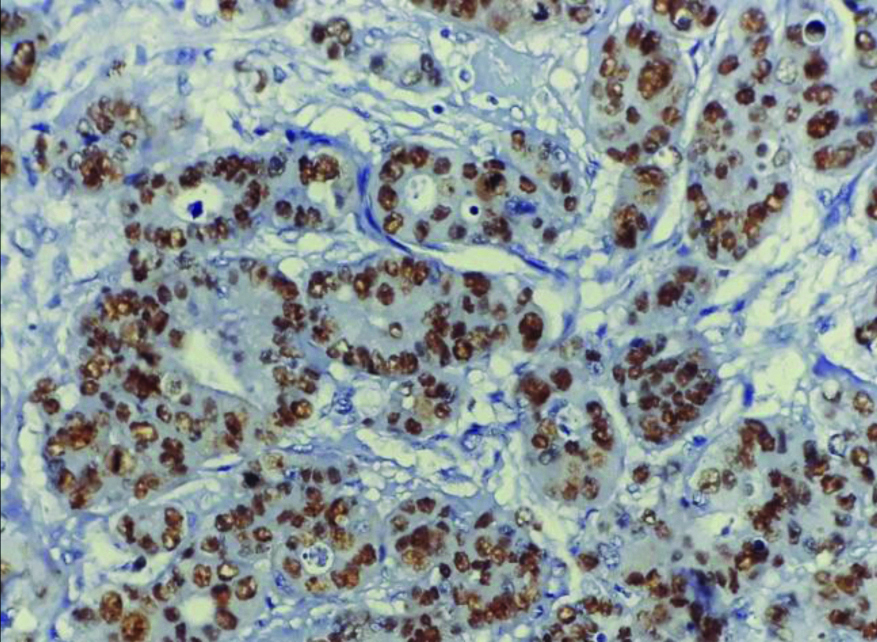
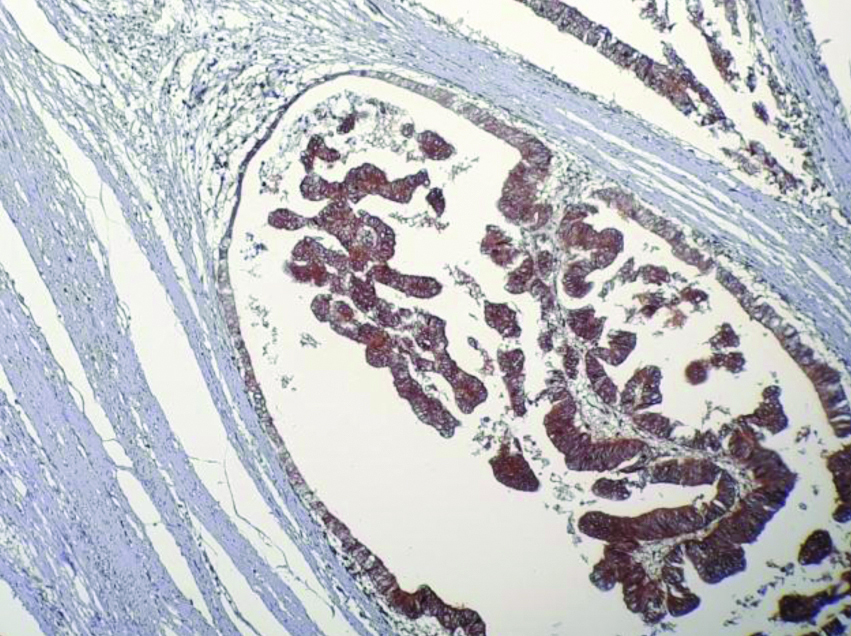
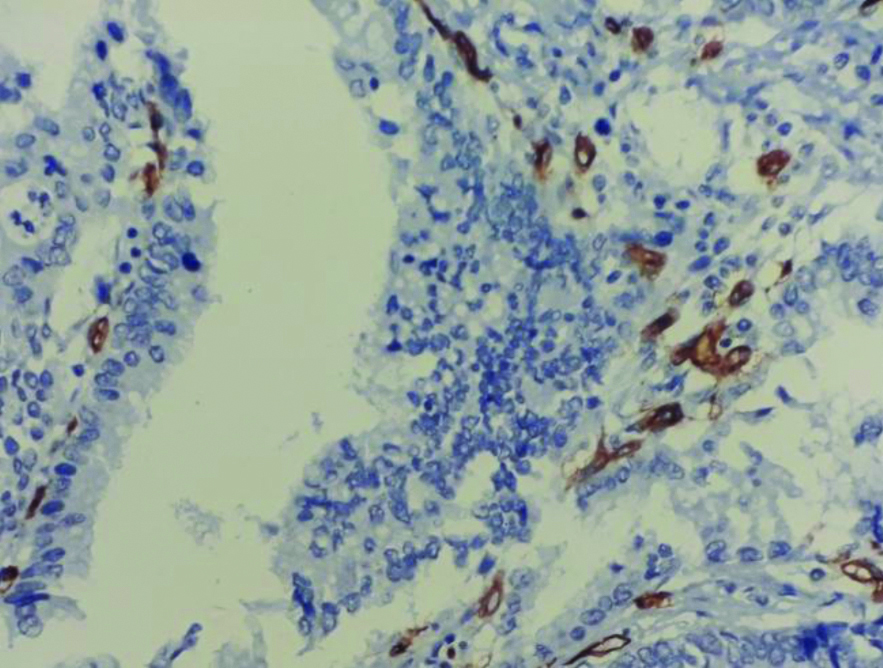
For interpretation, only intense nuclear staining was taken as positive P53 expression. P53 staining was graded on a scale from 0 to 3 according to Takahashi Y et al., [Table/Fig-1a] [7]. So 0% positivity was negative, 1-20% positive cells were graded 1, 21-50% positive cells were graded 2 and 50-100% positive cells were graded 3. VEGF strong cytoplasmic expression was graded as followed: Less than 5% negative, 5 to 25% positive grade 1, 26-50% positive grade 2 and <50% positive grade 3 [Table/Fig-1b] [7]. Any single brown cell or a cluster of cells with cytoplasmic or membrane positivity that were distinct from a large vessel were taken CD34 positive [Table/Fig-1c] [8]. MVD was graded in X400. In each case, mean of five fields were taken as mean MVD. Taking 31 microvessels as a cut-off cases were graded into hypo-vascular (MVD-Low) and hyper-vascular type (MVD-High) [9,10].
Strong nuclear positivity in tumour cells (p53 IHC; X400).
Cytoplasmic positivity in tumour cells (VEGF IHC; X400).
Microvascular density in hotspots (CD34 IHC, X400).
Statistical Analysis
For statistical analysis Pearson chi-square test and fisher’s-exact method were used in SPSS 22. A p-value <0.05 was considered statistical significant.
Results
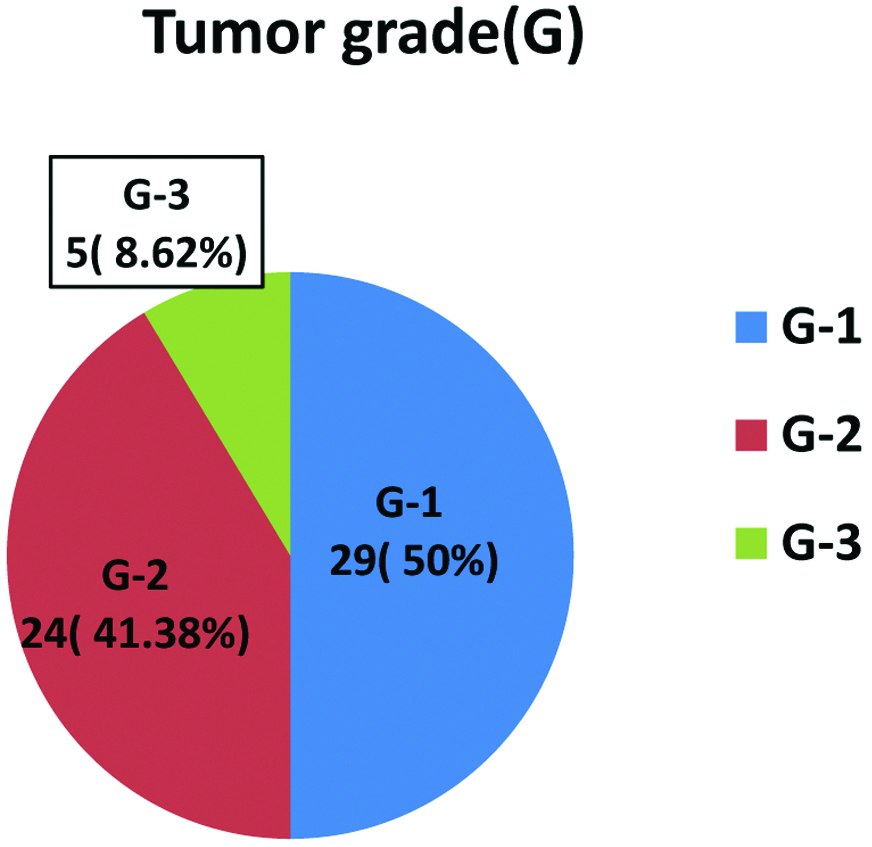
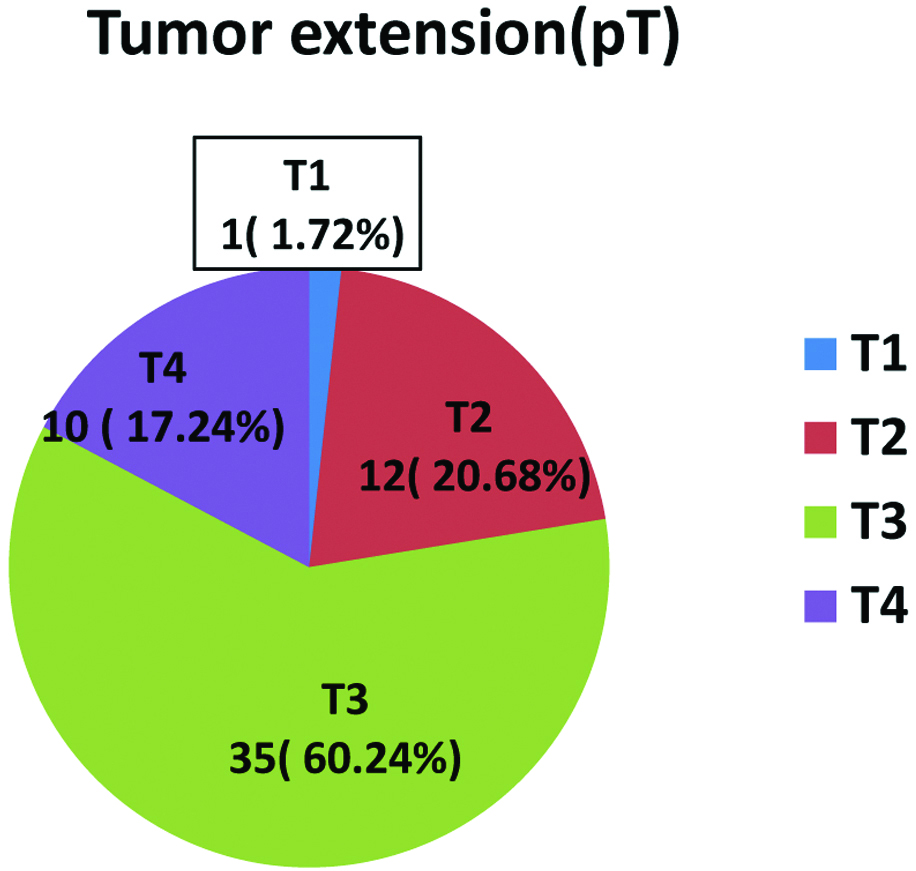
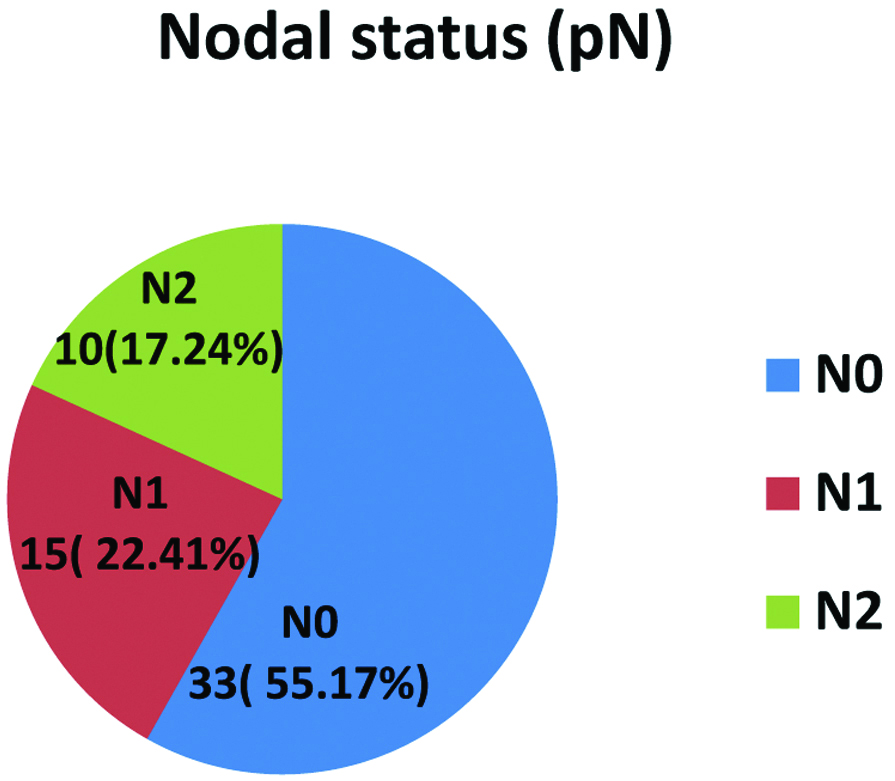
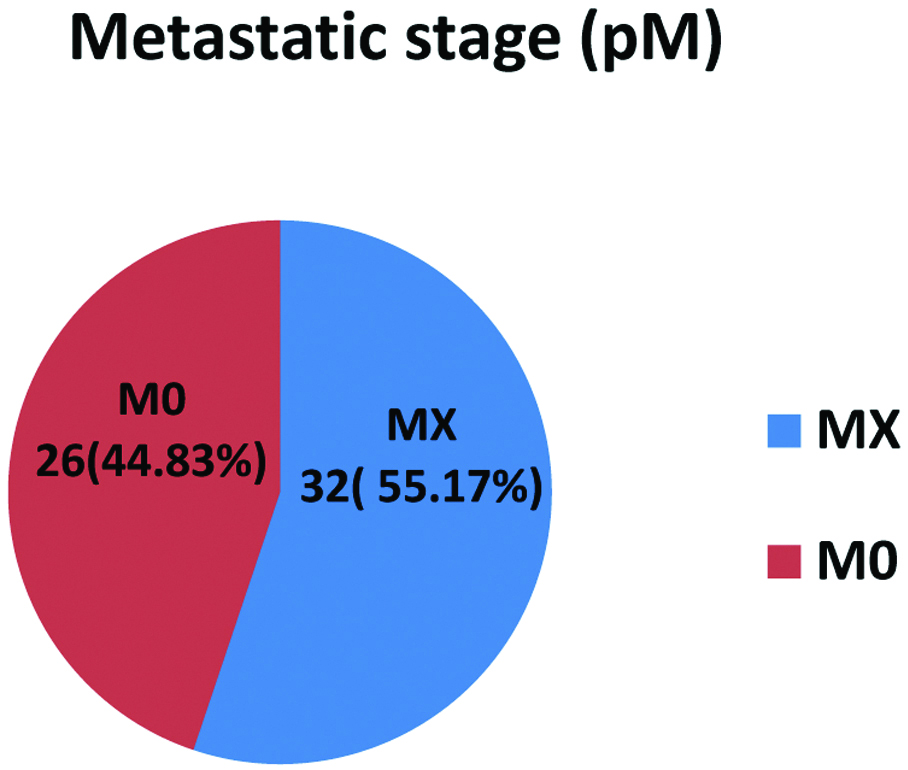
Out of 70 cases, 43 (61.42%) were males and 27 (38.58%) were females. Most of the adenocarcinomas (36, 62.06%) as well as adenoma cases (5, 41.67%) were in range of 40-59 years of age. Age and sex did not correlate with any of the IHC markers. Maximum 11 cases of adenomas (91.67%) and 29 cases of adenocarcinomas (50%) were seen in sigmoid colon and rectum region [Table/Fig-2]. Out of 58 adenocarcinomas, 29 cases (50%) were grade 1 (G1) and 24 cases (41.38%) were grade 2 (G2) and 5 (8.62%) were grade 3 (G3) [Table/Fig-3a]. Maximum cases belonged to stage 3 (60.24%) based on tumour extension (pT) [Table/Fig-3b]. Only 10 (17.24%) had pN2 status [Table/Fig-3c], metastatic status (pM) could only be assessed in 26 (44.83%) cases [Table/Fig-3d].
Adenocarcinoma and adenoma with respect to tumour site.
| Site | Adenocarcinoma | Adenoma |
|---|
| Case No (n) | Percentage (%) | Case No (n) | Percentage (%) |
|---|
| Ascending colon | 22 | 37.93 | 1 | 8.33 |
| Transverse colon | 5 | 8.62 | 0 | 0 |
| Descending colon | 2 | 3.45 | 0 | 0 |
| Sigmoid colon and rectum | 29 | 50 | 11 | 91.67 |
| Total cases | 58 | 100 | 12 | 100 |
Percentage distribution of Adenocarcinoma cases with tumour grade (G).
Percentage distribution of Adenocarcinoma cases with tumour extension (pT).
Percentage distribution of Adenocarcinoma cases with nodal status (pN).
Percentage distribution of adenocarcinoma cases with metastatic status (pM).
Majority of the 39 cases (67.24%) were p53 positive. Only 2 out of 12 adenoma cases had focal p53 positivity. There was significant statistical association (p=0.01) between p53 graded expression and diagnosis in the present study [Table/Fig-4]. But no statistical significance noted in VEGF grades with respect to adenomas and adenocarcinomas except a trend of association (p=0.14) [Table/Fig-5]. Majority of adenocarcinomas, 41 (70.69%) cases were hypervascular (MVD-H), whereas 9 (75%) adenomas were hypovascular (MVD-L) with significant statistical association (p=0.003) [Table/Fig-6]. On comparison of p53 with various clinicopathological factors in adenocarcinomas, majority 26 cases (44.82%) had grade 3 expression, out of which 16 (27.58%) were located in sigmoid colon and rectum. A trend of association noted between tumour location and p53 expression. (p=0.17) as well as between tumour stage (pT) and p53 expression (p=0.10). p53 did not show any significant statistical association with tumour grade (G) and nodal status (pN). VEGF and tumour site had significant statistical association. Out of 50 (86.2%) cases with grade 3 VEGF expressions, 36 (62.06%) were located in Sigmoid colon and rectum. No statistical significance noted between VEGF and tumour grade, nodal status or tumour stage. But out of 50 (86.2%) cases that showed VEGF grade 3 expression, 30 (51.72%) had T3 tumour stage [Table/Fig-7].
p53 expression in tumour.
| Diagnosis | p53 grades, n(%) | p-value |
|---|
| Grade 0 | Grade 1 | Grade 2 | Grade 3 | Total |
|---|
| Adenocarcinoma | 19 (32.76) | 8 (13.79) | 5 (8.62) | 26 (44.83) | 58 (100) | 0.01 |
| Adenoma | 10 (83.3) | 1 (8.3) | 0 (0.00) | 1 (8.33) | 12 (100) |
| Total | 29 (41.4) | 9 (12.8) | 5 (7.1) | 27 (38.5) | 70 (100) |
Comparison of VEGF graded expression and diagnosis.
| Diagnosis | VEGF grades, n(%) | p-value |
|---|
| Grade 0 | Grade 1 | Grade 2 | Grade 3 | Total |
|---|
| Adenocarcinoma | 0 (0.00) | 3 (5.17) | 5 (8.62) | 50 (86.21) | 58 (100) | 0.14 |
| Adenoma | 1 (8.33) | 0 (0.00) | 1 (8.33) | 10 (83.33) | 12 (100) |
| Total | 1 (1.42) | 3 (4.28) | 6 (8.57) | 60 (85.71) | 70 (100) |
Distribution of cases with respect to MVD.
| Diagnosis | MVD-L n(%) | MVD-H n(%) | Total n(%) | p-value |
|---|
| Adenocarcinoma | 17 (29.31) | 41 (70.69) | 58 (100) | 0.003 |
| Adenoma | 9 (75.00) | 3 (25.00) | 12 (100) |
| Total | 26 (37.1) | 44 (62.8) | 70 (100) |
Comparison of VEGF with various clinico-pathological factors in adenocarcinoma.
| Clinico-pathological parameters | | VEGF grades n(%) | | p-value |
|---|
| Grade 0 | Grade 1 | Grade 2 | Grade 3 | Total cases |
|---|
| Tumour site | AC* | 0 (0.00) | 1 (1.72) | 3 (5.17) | 19 (32.75) | 23 (39.65) | 0.05 |
| TC† | 0 (0.00) | 1 (1.72) | 0 (0.00) | 4 (6.89) | 5 (8.62) |
| DC‡ | 0 (0.00) | 1 (1.72) | 0 (0.00) | 1 (1.72) | 2 (3.45) |
| SC&R§ | 1 (1.72) | 0 (0.00) | 3 (5.17) | 36 (62.06) | 40 (68.96) |
| Tumour grade (G) | G1 | 0 (0.00) | 3 (5.17) | 3 (5.17) | 23 (39.65) | 29 (50.00) | 0.42 |
| G2 | 0 (0.00) | 0 (0.00) | 2 (3.45) | 22 (37.93) | 24 (41.38) |
| G3 | 0 (0.00) | 0 (0.00) | 0 (0.00) | 5 (8.62) | 5 (8.62) |
| Tumour stage (Pt) | T1 | 0 (0.00) | 0 (0.00) | 0 (0.00) | 1 (1.72) | 01 (1.72) | 0.56 |
| T2 | 0 (0.00) | 1 (1.72) | 0 (0.00) | 11 (18.96) | 12 (20.69) |
| T3 | 0 (0.00) | 2 (3.45) | 3 (5.17) | 30 (51.72) | 35 (60.34) |
| T4 | 0 (0.00) | 0 (0.00) | 2 (3.45) | 8 (13.79) | 10 (17.24) |
| Nodal status (Pn) | N0 | 0 (0.00) | 1 (1.72) | 3 (5.17) | 28 (48.27) | 32 (55.17) | 0.19 |
| N1 | 0 (0.00) | 2 (3.45) | 2 (3.45) | 9 (15.51) | 13 (22.41) |
| N2 | 0 (0.00) | 0 (0.00) | 0 (0.00) | 13 (22.41) | 13 (22.41) |
*AC: Ascending colon; †TC: Transverse colon; ‡DC: Descending colon; §SC&R: Sigmoid colon and rectum
Location of the tumour and MVD had a statistically significant association with p-value of 0.02 with increased expression (24, 41.37% MVD-H) in sigmoid colon and rectum. There was no association between MVD with tumour grade and stage, nonetheless more expression noted in T3 stage (24, 41.38%). MVD and tumour nodal status had an inversely significant relationship (p=0.03) i.e., maximum 32 (55.17%) MVD-H tumours had nodal status N0. On correlating p53 and VEGF graded expressions in adenocarcinomas by Fisher-exact analysis, maximum 24 cases (41.38%) showed both VEGF and p53 positivity. A trend of association between two markers was noted with p=0.384 [Table/Fig-8]. There was significant statistical association between VEGF and MVD with a p-value of 0.01 by Pearson chi-square test [Table/Fig-9]. On comparison of p53 graded expression with MVD (H & L) in CRC, 22 (37.93%) cases having p53 grade 3 expression were hypervascular, which was statistically insignificant [Table/Fig-10]. Comparison of hypo and hypervascular tumours with p53 and VEGF graded expression in adenocarcinomas showed that there was no significant statistical association between p53, VEGF and MVD in adenocarcinoma cases. However, 20 (52.63%) cases that had both grade 3 p53 and VEGF expression also had high MVD [Table/Fig-11].
Comparison of p53 graded expression and VEGF graded expression in adenocarcinoma.
| VEGF grades (%) | p53 grades n (%) | Total | p-value |
|---|
| Grade 0 | Grade 1 | Grade 2 | Grade 3 |
|---|
| Grade 0 | 0 (0) | 0 (0) | 0 (0) | 0 (0) | 0 (0) | 0.384 |
| Grade 1 | 2 (3.45) | 0 (0) | 1 (1.72) | 0 (0) | 3 (5.17) |
| Grade 2 | 2 (3.45) | 1 (1.72) | 0 (0) | 2 (3.45) | 5 (8.62) |
| Grade 3 | 15 (25.86) | 7 (12.06) | 4 (6.89) | 24 (41.38) | 50 (86.2) |
| Total n (%) | 19 (32.76) | 8 (13.79) | 5 (8.62) | 26 (44.83) | 58 (100) |
Comparison of VEGF grades with MVD (H & L) in CRC.
| VEGF grades | MVD, n(%) | Total | p-value |
|---|
| Low | High |
|---|
| Grade 0 | 0 (0) | 0 (0) | 0 (0) | 0.01 |
| Grade 1 | 3 (5.17) | 0 (0) | 3 (5.17) |
| Grade 2 | 2 (3.45) | 3 (5.17) | 5 (8.62) |
| Grade 3 | 12 (20.69) | 38 (65.51) | 50 (86.20) |
| Total n (%) | 17 (29.31) | 41 (70.69) | 58 (100) |
Comparison of p53 grades with MVD (H & L) in CRC.
| MVD n(%) | | |
|---|
| p53 grades | Low | High | Total | p-value |
|---|
| Grade 0 | 7 (12.06) | 12 (20.69) | 19 (32.76) | 0.14 |
| Grade 1 | 3 (5.17) | 5 (8.62) | 8 (13.79) |
| Grade 2 | 3 (5.17) | 2 (3.45) | 5 (8.62) |
| Grade 3 | 4 (6.89) | 22 (37.93) | 26 (44.82) |
| Total n, (%) | 17 (29.31) | 41 (70.69) | 58 (100) |
Comparison of hypo and hypervascular tumours with p53 and VEGF graded expression in adenocarcinoma.
| MVD low | | MVD high |
|---|
| p53 n (%) | p53 n (%) |
|---|
| VEGF grades | Grade 0 | Grade 1 | Grade 2 | Grade 3 | Total | p-value | Grade 0 | Grade 1 | Grade 2 | Grade 3 | Total | p-value |
|---|
| Grade 0 | 0 (0) | 0 (0) | 0 (0) | 0 (0) | 0 (0) | 0.70 | 0 (0) | 0 (0) | 0 (0) | 0 (0) | 0 (0) | 1.000 |
| Grade 1 | 2 (66.67) | 0 (0) | 1 (33.33) | 0 (0) | 3 (100) | 0 (0) | 0 (0) | 0 (0) | 0 (0) | 0 (0) |
| Grade 2 | 1 (50) | 1 (50) | 0 (0) | 0 (0) | 2 (100) | 1 (33.33) | 0 (0) | 0 (0) | 2 (66.67) | 3 (100) |
| Grade 3 | 4 (33.33) | 2 (16.67) | 2 (16.67) | 4 (33.33) | 12 (100) | 11 (28.95) | 5 (13.16) | 2 (5.26) | 20 (52.63) | 38 (100) |
| Total | 7 (41.18) | 3 (17.65) | 3 (17.65) | 4 (23.53) | 17 (100) | 12 (29.27) | 5 (12.20) | 2 (4.88) | 22 (53.66) | 41 (100) |
Discussion
CRC is a major source of morbidity and mortality both in developing and developed nations with profound social and economic consequences. Continuous research and clinical trials are being carried out for early detection of patients with poor prognosis, newer drugs and targeted therapy [2,11].
In present study, we obtained 67.24% (39 cases) expression of p53 in adenocarcinoma cases, supporting the theory of previous authors that, it’s the major gene responsible (40-60%) in carcinogenesis of CRC [9,10,12]. Current study showed a lack of association of p53 with age, sex, depth of tumour invasion, nodal status in corroboration with other studies [9,12]. Although statistically insignificant, there was a trend of p53 expression more on the sigmoid colon and rectum than right colon in the present study, which was in support with previous finding [9,11,12]. p53 expression also had a trend with grade 3 tumours in present study, nonetheless it was not statistically significant (p=0.14). We observed p53 mutation is significantly associated in carcinomas and adenomas with high grade dysplasia only suggesting that p53 in the mutational basis of CRC in the adenoma carcinoma pathway [11].
In current study, significant amount of VEGF expression was obtained in all the adenocarcinoma cases (100%) and had no relationship with age and sex, similar to the findings of Mohamed HAD et al., [8]. But unlike their findings, we did not get any association between VEGF and tumour depth, grade or nodal status or metastasis but VEGF expression significantly correlated with location of tumour with a precedence to the right sided tumour (sigmoid colon and rectum) [13-17]. In present study, metastatic history of most of the cases (32, 55.17%) were unknown as they were lost to follow-up, which restricted our ability to examine a relationship between VEGF and metastasis.
In the present study, MVD expression had a significant association with site of tumour but other than that no other association noticed with the other clinicopathological parameters [5,8]. An inversely significant association of MVDs with lymph node status was obtained unlike previous studies [8]. There are several studies postulating MVD being the important prognostic factor in CRC [9,10]. However, there are authors pertaining to the inverse theory as well [9]. According to them, a higher MVD would induce a greater immune response inhibiting tumour growth and dissemination. MVD was significantly less in adenomas than in adenocarcinomas proving that malignant tumours express more MVD than pre-malignant cases as postulated by Takahashi Y et al., [7].
There was statistically significant association of VEGF and MVD in present study, suggesting a direct relationship of VEGF in angiogenesis [4,8,10]. Galizia G et al., postulated VEGF expression to be independent of CRC [18]. In previous years, several authors suggested an existence of a p53-VEGF regulatory pathway [4,7,19]. p53 has been known to influence angiogenesis through activating fibroblasts or decreasing thrombospondin-1 and ultimately resulting in an angiogenic switch [4,20]. In the current study, there was no statistically significant relation between p53 and VEGF. But the 39 (67.24%) cases which were positive for p53 also showed positive VEGF expression. (p-value=0.384), similarly majority of the grade 3 p53 expression, i.e., 26 (44.83%) cases also showed grade 3 VEGF expression. Conversely, there are authors who obtained an inverse relationship of p53 and VEGF [21]. But no statistically significant association of p53 and MVD was found in present study, similar to the observations of other authors, although an increased trend was noticed p=0.14 [19]. Altogether, there was no significant association between p53, VEGF and MVD in current study, as opposed to the theories postulated by other authors [Table/Fig-12] [4,5,7,8,10,18,19,21].
p53, VEGF and MVD findings of published studies [4,5,7,8,10,18,19,21].
| Study (year) | VEGF and MVD | p53 and VEGF | p53 and MVD | p53, VEGF and MVD |
|---|
| Kang SM et al., [4](1997) | Yes | Yes | Yes | Yes |
| Takahashi Y et al., [7] (1998) | Yes | Yes | Yes | Yes |
| Vermeulen PB et al., [10] (1999) | Yes | Yes | Yes | Yes |
| Pal S et al., [21] (2001) | --- | Inverse | --- | --- |
| Zheng S et al., [5] (2003) | Yes | --- | --- | --- |
| Galizia G et al., [18] (2004) | No | | Yes | |
| Malik A et al., [19] (2011) | Yes | Yes | Yes | Yes |
| Mohamed HAD et al., [8] (2016) | Yes | --- | --- | --- |
| Present study | Yes | No | Trend | No |
Limitation(s)
The lack of statistical significance between all these factors might be due to many reasons. Total number of cases (58 adenocarcinomas) in the study group was small. Use of monoclonal p53 antibody in the study resulted in inability to detect different p53 clonal population which exists within a tumour. Polyclonal VEGF antibody stains lymphatic and blood vessels, so hindered evaluation of proper association between p53 and angiogenesis. The manual microarray method restricted us from choosing or including a large tumour area with stroma for better interpretation. VEGF expression may be falsely high in some tumours as demonstrated by other authors like this study (100%). This may be due to: 1) many VEGF ligands directly acting on VEGFRs in tumour cells; 2) existence of VEGF/VEGFR autocrine signaling pathway which induces tumour growth and invasion; 3) modified phenotypic expression seen with activation of the MAPK pathway in tumour cells. Failure to obtain follow-up information’s as patients didn’t turn up, was a restrictive issue in establishing relationship between VEGF expression and MVD with patient survival and distant metastasis.
Conclusion(s)
Vascular Endothelial Growth Factor (VEGF) and Microvascular Dentisty (MVD) were more expressed on left-sided, specifically sigmoid colon and rectal tumours with a trend in case of p53. p53 was expressed on carcinomas rather than in adenomas, or in an adenoma undergoing a malignant transformation. As per this study, finding (i.e., p53 expression is in 67.24% cases and VEGF in 100% cases) there may be involvement of several other genes in angiogenesis of CRC. Association between these three markers is variable. So further larger scale studies, preferably prognostic ones with these three IHC markers in CRC are needed which will be valuable in predicting recurrence, metastasis or overall survival of patients. Application of the outcome will be paramount in aiding management of CRC patients.
*AC: Ascending colon; †TC: Transverse colon; ‡DC: Descending colon; §SC&R: Sigmoid colon and rectum