During masticatory loading, dental bridges are subjected to various forces that might generate deflections in the bridge framework. The beam deflection could be recognised in different forms and applications such as the cantilever beam or simple beam supported from both sides, which are two common forms of beam deflections seen in dentistry [1,2]. Based on these equations, Young’s modulus of the material considerably influences the deflection process [1-3]. In addition, the configuration of the beam cross-section may also play a significant effect on minimising the amount of deflection [3].
Inan O et al., were able to show the effect of the framework configurations at the pontic side to withstand the functional loads [4]. For three suggested designs, the convex design showed the best fracture resistance. Moreover, it was noted that deflection changes directly with the cube of the length and inversely with the cube of the occluso-gingival height of the pontic. Accordingly, designing long-span bridges requires great care about flexions that can happen during the function, which can be compensated by increasing occluso-gingival height [1], using rigid materials [2,5] and enhancing resistance to deflection by modifying the abutments’ preparations [5,6]. The curvature of the arch has been considered as a parameter during designing long-span fixed partial denture [5].
Several researches studied the influence of dental bridge core materials and connectors cross-section on the load transfer, flexural strength and fracture toughness. Their findings appreciate the value of the material rigidity and increasing the connector size [5,7,8]. In addition, some researches recommended the use of mechanical analysis to augment the design optimisation using digital structural optimisation with a great concern towards the connector areas [9,10].
The FEA method enabled researchers to study complex and difficult clinical conditions to reveal the optimal designs and materials for fixed bridge. Recently, this method is intensively developed to minimise the gap between virtual condition and actual oral conditions [11,12].
Zirconia has been used in dentistry for years as an aesthetic core material replacing the older metallic core materials due to its desirable colour and mechanical properties. Partially, stabilised zirconia is a new enhanced type that enables clinicians to use zirconia in full arch implant supported cases which could be stained or layered to match the required shades [13-15]. Recently, a bio-polymer incorporating graphene Nano-material became commercially available as CAD-CAM discs for dental use, which covers a lot of dental applications with some biological aspects that enhance their performance [16].
The current study hypothesied that the stress, deflection, strain, and deformation of the fixed partial dentures could be affected by the three-dimensional configurations of the pontic areas and the response of the resultant mechanical parameters could not be estimated from the simple equations of the beam deflection situation mentioned in the literature. Two different materials namely, Zirconia, and Graphene were used to understand how their elastic modulus exhibited in the current situations. The aim of this 3D FEA was to evaluate, the difference in the amount of deflection, strain, and deformation upon using different materials and configurations in the pontic and connectors area of the dental bridge.
Materials and Methods
This study was conducted in March 2019. The model preparation and analysis took 7 months prior to the start of the study. The study was performed at Alrass Dental College, Qassim University, Al-Qassim, KSA. Suggested research design encompasses a 3D FEA on a model created from a patient’s CBCT. The study procedures were conducted with the ethical approval of the research center of Alrass Dental College, Doc-ID (Ref-DC-3124).
Three-Dimensional Model Creation
A 45-year-old male patient was selected from the outpatient clinic at Alrass Dental College, Qassim University. The patient’s mandible was dentulous, had sound mandibular posterior teeth and normally oriented crowns at least in one quadrant. The bone was also free from a clinically apparent pathology (bone mass, abscess, mobility or pockets). All selection criteria were also confirmed after performing the CBCT imaging at the oral and maxillofacial radiology center.
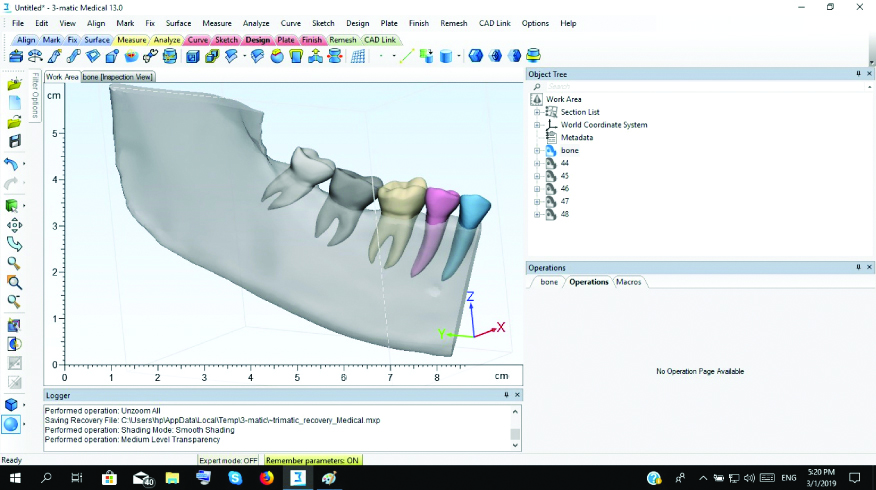
Using Mimics software v. 21 (Materialise NV, Leuven, Belgium), mandibular bones and posterior teeth of the right quadrant were reconstructed from (Digital Imaging and Communications in Medicine) DICOM images. The images were processed to create masks at suitable grey level thresholds to be separated and converted to 3D models [Table/Fig-1].
CT images of the bone were masked and 3D model was created using functions and tools of the Mimics software.

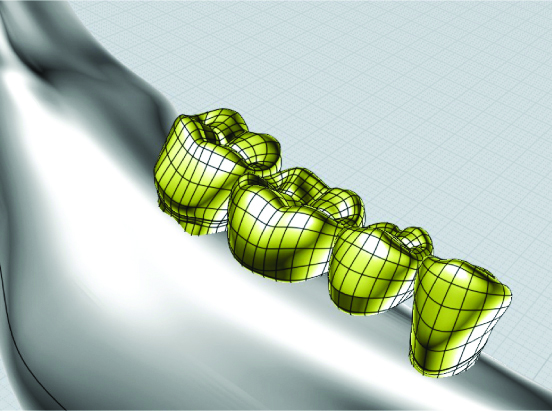
Finally, the 3D models were exported as 3D Stereolithographic (STL) files. The Mandibular STL files were subjected to several preprocessing procedures at 3-matic (Materialise NV, Leuven, Belgium) and CAD software (MOI v 3, Triple squid software design, USA) was used to create smooth simplified water-tight 3D solid models of both bone and teeth [Table/Fig-2,3].
Model was processed and treated in 3-matic software to facilitate conversion to CAD 3D model.
Teeth and bone of the area of interest were configured and created as water-tight 3D CAD models in CAD modeling software.
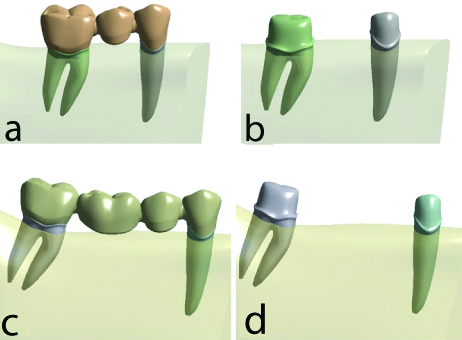
The 3D model of the molar and the premolar (of the right quadrant) were modified at the coronal part to simulate the full crown preparation required for dental bridge construction. In addition, some teeth were also modified to be used as pontics for the bridge [Table/Fig-4]. Here, two materials were assigned to the studied groups. The first material was Zirconia (Lava Zirconia; 3M ESPE, USA) and the second material was graphene-based enhanced polymer (G-CAM, Graphenano Dental, Spain). Accordingly, the study models were assembled into four groups as the following:
3-unit bridge modeled to represent group I and II, (a). Simulated prepared abutments for three-unit bridge, (b). four-unit bridge and their simulated preparation for group III & IV, (c,d).
Group I (G1): 3 unit fixed-fixed bridge using Zirconia as a bridge material.
Group II (G2): 3 unit fixed-fixed bridge using Graphene as a bridge material.
Group III (G3): 4 unit fixed-fixed bridge using Zirconia as a bridge material.
Group IV (G4): 4 unit fixed-fixed bridge using Graphene as a bridge material.
All models were imported in the design modeler of the finite element software (ANSYS Workbench v 14 packages; ANSYS, Inc., Canonsburg, PA, USA). Then material properties of the studied bodies were assigned. The material properties were considered isotropic, where each body property was represented by single value (x=y=z). Inputs of the material properties were elastic modulus, poison’s ratio, and density. Zirconia was assigned as a bridge material for Group I and III. Material properties of all models are mentioned in [Table/Fig-5].
Material properties assigned for different 3D models.
| Elastic modules-E (MPa) | Poison’s ratio (υ) | Density (g/cm3) |
|---|
| Bone | 13700 | 0.3 | 1.5 |
| Dentin | 18000 | 0.3 | 2.2 |
| Zirconia | 205000 | 0.22 | 5.68 |
| Graphene | 3200 | 0.3 | 2.2 |
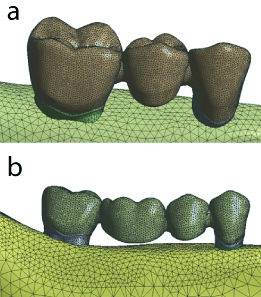
The mesh was created using tetrahedron elements (10-Tet) with several refinements at the areas of interest and at the small areas with fine details to meet the mesh quality criteria, based on the mesh convergence study [Table/Fig-6]. The number of elements and nodes of each model are mentioned in [Table/Fig-7].
The generated mesh of both the 3D models showing selective refining process.
Number of elements and nodes of the studied 3D models.
| Model type | Number of elements | Number of nodes |
|---|
| Group I and II | 347151 | 508879 |
| Group III and IV | 494572 | 713110 |
Boundary Conditions and Loading
The contact between different bodies was treated as a linear bonded contact between different components of all the models to facilitate calculation process. The bone models were constrained at its mesial and distal ends and at the lower border of the bone to ensure zero degree of freedom at these areas. Loading conditions slightly varied between the studied groups. In the 3-unit bridge, an area at the mid distance between abutments, over the central groove of the pontic, was loaded by vertical force of 600 N. Similar amount of force was applied in the 4-unit bridge, at the mid-distance area between abutments, located on two marginal ridges of the pontics.
Analysis was monitored at different subsets during load application to record stress and deformation, representing bending (deflection) of the studied bridge. Both normal stress and directional deformations in the Z-direction of the system coordinate (like 3D bodies orientation) were calculated and their correlation during loading was tabulated and a chart was created to represent bending of the dental bridge. In addition, equivalent elastic strain and total deformation were also calculated for all studied groups. Data of all previous values were monitored tabulated and colour-coded images of the 3D models of each group were prepared.
Statistical Analysis
As the FEA was done on one model without any variations other than the study parameters, all analysis was calculated automatically in the FEA software based on the pre-assigned outcomes and according to the inherent algorithm of data processing within the software.
Results
Normal Stress and Directional Deformation in Z-Direction
The maximum and minimum values of the Normal stress generated in Z-axis of the system coordinates of group I (3-unit zirconia bridge) recorded was 352.32 MPa and -565.51 MPa respectively. In group II (3-unit graphene bridge), the maximum value of the normal stress was 366.13 MPa and the minimum value of the normal stress was -578.08 MPa. Regarding group III (4-unit zirconia bridge), the maximum value of the normal stress was 249.11 MPa and the minimum value of the normal stress was -394.84 MPa. Group IV (4-unit graphene) showed a maximum value for normal stress 305.71 MPa and a minimum value for normal stress -362.02 MPa [Table/Fig-8].
Graph presenting the maximum and minimum values of the normal stress in z-axis for all studied groups.
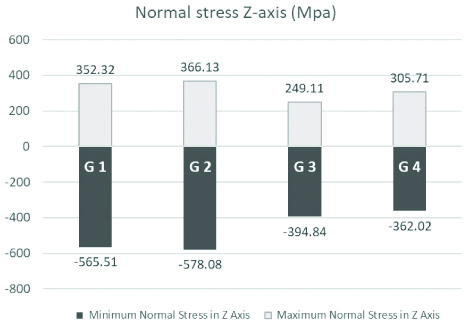
It can be observed that group II showed the highest maximum normal stress values followed by group I then group IV and the least values recorded for group III. In addition, the highest minimum normal stress values recorded in group II followed by group I then group III and finally group IV.
The values of maximum and minimum Directional deformation in Z-axis of group I were 4.83E-04 mm and -5.99E-03 mm, respectively. Group II showed maximum and minimum directional deformations equal 4.04E-02 mm and -0.3406 mm, respectively. The maximum and minimum values of directional deformation of group III were 3.79E-04 mm and -5.83E-03 mm. Group IV showed maximum value of directional deformation equals 3.45E-03 mm and minimum value was -0.3258 mm [Table/Fig-9a,b].
a) Graph presenting the maximum and minimum values of the directional deformation in z-axis for group I and III (left side). b) the maximum and minimum directional deformation in z-axis for group II and IV (right side).
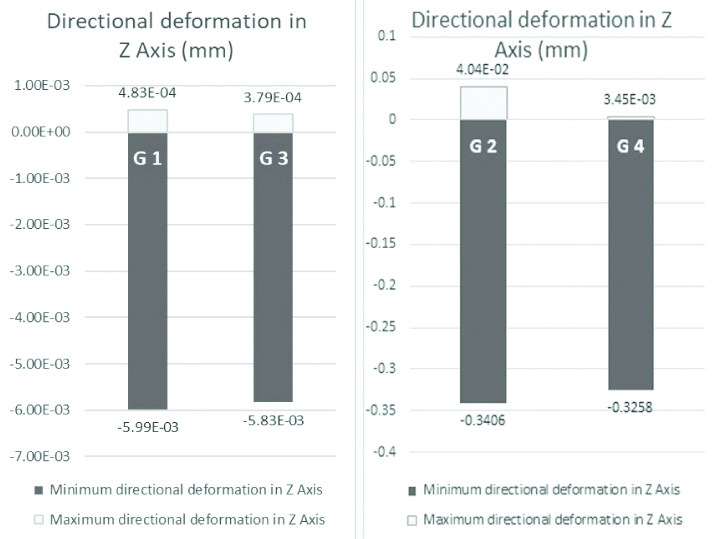
Accordingly, the maximum and minimum values for directional deformation were in group I followed by group III then group II and finally group IV had the least value of all groups.
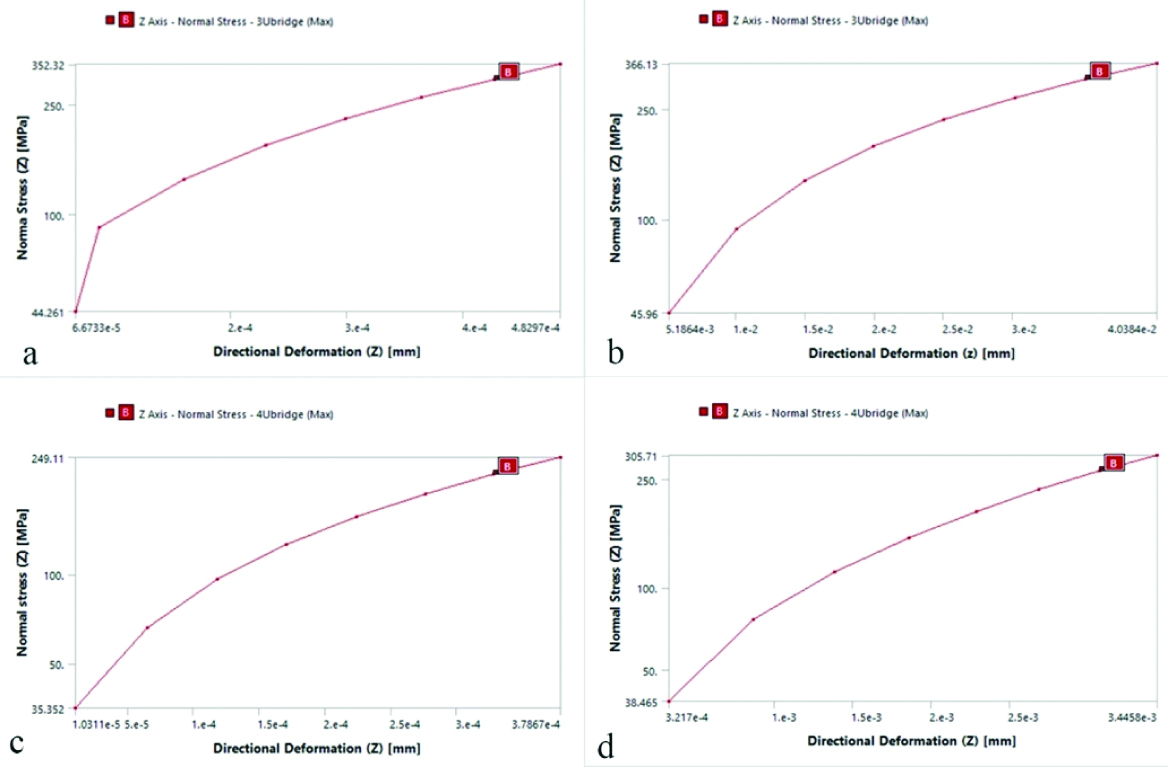
The combined values of normal stress and directional deformation in Z-axis of the four groups overtime were represented in the logarithmic curves as seen in [Table/Fig-10a-d]. As seen in the plotted curves all groups started to show the deflection within the force range applied with some similarity at certain normal stress ranges.
a, b, c and d representing the normal stress in MPa (y-axis) plotted against the directional deformation in mm (x-axis) as seen in group I, II, III and IV, respectively.
Studying the colour-coded bands generated during analysis of normal stress and directional deformation showed a stress concentration in the midway area of the bridge in all groups was observed. A noted area of stress concentration was also recognised at areas of connectors between pontics and abutments. However, the highest values of stress were calculated in the middle of the bridge where the values of deflections were more pronounced. The overall patterns of normal stress generated in all groups looks similar; however there is a clear difference in stress values [Table/Fig-11a-d].
a, b, c and d represent the colour-coded bands of the normal stress of the studied groups I, II, III and IV showing the areas of different stress values. e, f, g and h represent the colour-coded bands of directional deformation of the studied groups I, II, III and IV showing the areas of different directional deformation in z-axis.
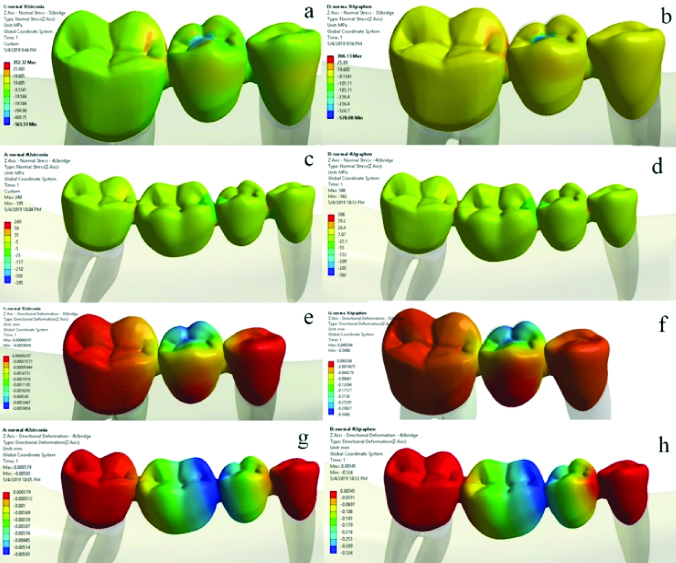
The patterns of directional deformation in z-axis showed a considerable change in the pontic areas near the middle of the bridge in all groups with few recognised areas at the connector between the pontics and the abutments. Slight changes were seen between zirconia groups and graphene groups. It was also noted that generally there was a coincidence between areas of high normal stress and directional deformation in all studied groups [Table/Fig-11e-h].
Equivalent Elastic Strain and Total Deformation
The maximum values of the Equivalent elastic strain and total deformation generated in group I were 3.75E-03 and 6.04E-03 mm, respectively. In group II, the maximum value of the Equivalent elastic strain was 0.22869 and the maximum total deformation was 0.34368 mm. Regarding group III, the maximum equivalent elastic strain 2.60E-03 and the maximum total deformation was 5.88E-03 mm. Group IV showed a maximum Equivalent elastic strain and total deformation value equal 1.44E-01 and 0.32832 mm, respectively [Table/Fig-12].
Maximum equivalent elastic strain of the four studied groups (left). Maximum values of total deformation in (mm) for the studied groups (right).
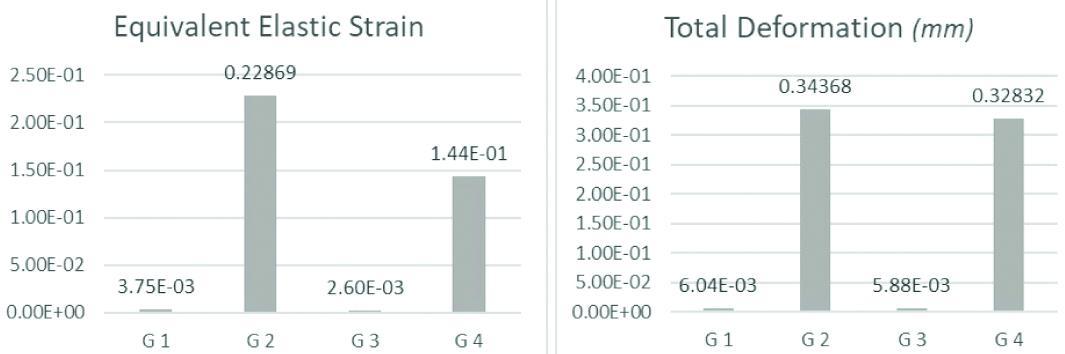
The highest value for the maximum equivalent strain was recorded in group II followed by group IV, then group I and finally group III which showed the least value. Similarly, the maximum value of the total deformation of group II was the highest followed by group IV, then group I and the least value was recorded in group III.
The qualitative analysis, represented by the colour-bands’ scale, of the equivalent elastic strain and the total deformation of the studied groups showed marked effect in the middle of the bridge for all groups and a recognised effect in the connector area especially for equivalent elastic strain [Table/Fig-13].
a, b, c and d represented the colour-coded bands of the equivalent strain of the studied groups I, II, III and IV showing the areas of different strain values. e, f, g and h represented the colour-coded bands of the total deformation of the studied groups I, II, III and IV showing the areas of deformation in z-axis.

Discussion
The ability of the fixed partial denture to resist occlusal forces without failure were studied for many years and a lot of efforts and studies were conducted to ensure valid durable results with clinical implications. These researches have included enhanced bridge design and materials used for bridge construction. Moreover, accurate examination and treatment planning should be encountered and certain biomechanical parameters must be considered [4,6-9]. The current research was designed to study and revise some parameters affecting the dental bridge stress, deformation and deflection under masticatory loads. Within the scope of the study, changes in the 3D configurations of the pontic areas, by changing the length and pontic tooth number in conjunction with the materials used for construction were examined and the data were plotted and interpreted both qualitatively and quantitatively. Realistic 3D models created from the CBCT of a patient were preferred to have a more valid biomechanical analysis. In addition, two materials were selected for this study, zirconia and enhanced graphene-based polymer. These materials have extreme difference in their Young’s modulus [11,16]. These materials were selected to check whether the studied biomechanical parameters will mutually follow the change in the elastic modulus with the same ratios.
The findings of the current study showed highest normal stress in z-axis, deflection, equivalent elastic strain and total deformation in Graphene-based bridges than the Zirconia-based bridges. Surprisingly, all the above mechanical findings were higher in the three-unit bridges than the four-unit bridges. Before explaining these findings, it should be mentioned that the Young’s modulus of Graphene-enhanced material is only 1.56 % of that of Zirconia material. This great difference in rigidity between these materials should be reflected clinically and it is expected to use zirconia in more extended bridges and areas of limited interarch distance. Thus, the values of flexural strength and deflection should follow this difference and show the changes in the studied mechanical characteristics. However, the results did not express this great difference in materials properties when evaluating normal stress but it was more pronounced in evaluating deflection and total deformation. This may encourage future clinical studies to assess the use of graphene enhanced polymers in more stressful oral environment.
In order to understand the findings of the study, we should consider the 3D configuration of the dental bridge. All recognised calculations and equations mentioned in previous studies, treated the dental bridge a beam, whether supported or suspended; where, the flexural strength and deflection were governed by beam dimensions and elastic modulus [1,3]. That was also confirmed as the deflection generated during loading will be eight times if the beam length was doubled or the thickness minimised to half of the original beam [5]. However, the previous studies were based on sound mathematical analysis, their outcomes are pure theoretical if they will be applied in dental situations. The fixed partial denture configurations and the pontic connector areas had complex arrangements. The 3D dimensions (length, width and thickness) changed to follow teeth form, number and also governed by connector size and material used [7,8,12]. It may also be affected by the complexity of the body and not only the 3D volume [3]. Accordingly, biomechanical analysis of the fixed partial denture is a complex process, especially if two materials (core and veneering material) are used during bridge construction [4].
This was in accordance with Inan O et al., and Shi I and Fok AS, who showed a clear difference in the stress-strain distributions of the 3-unit bridge when the framework configurations changed in the pontic areas [4,10]. Similarly, their results showed stress concentrations at the point of loading and at the connector areas.
Hence, more parameters can be considered while studying fixed partial denture, with a focus on the rigidity of the material used and 3D configurations in the connector-pontic area.
Limitation(s)
The current study did not incorporate mechanical testing in a clinical setup using nano-sensors to reveal areas of higher occlusal contact with their timing sequence.
Conclusion(s)
Within the limitation of the study, this biomechanical analysis confirmed that the stress concentration and deflection of the fixed bridge are influenced by material characteristics. However, configuration of the pontic area can influence the studied mechanical parameter regardless of the length of the dental bridge. This means that the simple beam deflection theory may not be applicable for some clinical conditions and so clinicians should consider other parameters during fixed partial denture design. In addition, they should consider each case separately with more concern about the biomechanical perspective.
It should also be mentioned that some limitations of the current study could be resolved by validating the current study using a mechanical testing and clinical studies incorporating reading from the nano-sensors revealing areas of higher occlusal contact with their timing sequence.