The globalisation of the economy in the world requires every profit and non-profit organisation to compete with each other for resources and markets. This situation also applies to the hospital industry. Changes are so fast, requiring hospitals to survive among competitors that will emerge at any time, therefore, hospitals must fulfill the demands to be able to respond to these changes. The lack of nursing and the high rate of nurse turnover are main health care problem around the world [1]. In Indonesia, the nurse turnover rate in private hospital is quite high, which is more than 10% each year (above the normal limit). It means that the hospital management faces a problem especially in the field of nursing human resources [2]. This is supported by a survey report on nursing facilities conducted by the American Health Care Association (AHCA) in 2012; the average turnover of workers in nursing facilities amounted to 43.9% [3]. It shows that turnover is also a major problem in hospital in Canada with an average turnover rate of 19.9% [3]. In 2020, it is estimated that there will be a shortage of nearly 1 million nurses in the United States, this is due to the growth of the healthcare industry that continues to exceed the needs of available nurses and increase turnover numbers in the future [4]. The growth of private hospital in Indonesia is increasing; data about the number of hospital changes every day and increases every year by approximately 7% [5]. This condition risks nurses’ turnover from one hospital to another.
Materials and Methods
This study used quantitative correlation design with cross-sectional approach. The study was conducted from March to September 2018 at two private Type C (the first level of referral hospital) hospitals in Jakarta, the Capital City of Indonesia. The sampling method was purposive sampling. This research was approved by the National Ethical Committee (206/KEP/FK/2017). Informed consent was taken during data collection, which was considered aspect of data collection procedures, voluntary, and confidentially.
Total of 97 nurses Respondents to the questionnaire.
Inclusion criteria: Working in a private hospital, having at least 1 year of nursing experience, providing care for patients in high-risk service units’ emergency room, inpatient care rooms, intensive care units, neonatal intensive care units, surgery and haemodialysis rooms.
Exclusion criteria: The nurses that refused to consent for the study were excluded.
This research used the following instruments:
Turnover Intentions with 9 questions [10]:
Thoughts of quitting (TI1)
Intention to quit (TI2)
Intention to search for another job (TI3)
Job characteristics with 21 questions [11]:
Skill variations (JC1)
Identity task (JC2)
Meaning task (JC3)
Autonomy (JC4)
Feedback (JC5)
Job satisfaction with 20 questions [12]:
Intrinsic satisfaction (JS1)
Extrinsic satisfaction (JS2)
Organisational commitment with 16 questions [13]:
Affective Commitment (OC1)
Continuance Commitment (OC2)
Normative Commitment (OC3)
The study instrument was questionnaire that had been modified from a previous study containing 66 questions [10-13]. Measurement category of respondent’s distribution used five point Likert Scale ranging from (1) “strongly disagree” to (5) “strongly agree”.
Statistical Analysis
The data were analysed through SEM-PLS technique. The results indicated that the measurement reliabilities using Cronbach’s coefficient, all of which are above 0.6 (range 0.69-0.88), which means it has good reliability and the measurement validity using square root of Average Variance Extracted (AVE) where, each construct had values above 0.50 (range 0.77-0.90) which means that each construct is valid [14].
Results
The largest proportion of the respondents were females (78.4%), in the 25-35 age group (45.7%), with Diploma level of education (72.2%), and had worked for 1-3 years in their current hospital (29.9%), as seen in [Table/Fig-1]. All indicators on the model have a loading of more than 0.50 so all indicators were included in this study [Table/Fig-2].
Distribution of the percentage of participant.
| Background characteristics | n | % |
|---|
| Gender |
| Male | 21 | 21.6 |
| Female | 76 | 78.4 |
| Age |
| Below 25 | 19 | 19.6 |
| 25-35 | 44 | 45.7 |
| 36-45 | 22 | 22.7 |
| 46-55 | 11 | 11.3 |
| Over 55 | 1 | 1.0 |
| Education |
| Diploma | 72 | 72.2 |
| Bachelor | 13 | 13.2 |
| Profession | 12 | 12.4 |
| Length of working |
| Less than a year | 13 | 13.4 |
| 1-3 years | 29 | 29.9 |
| 4-6 years | 20 | 20.6 |
| 7-10 years | 10 | 10.3 |
| Over 10 years | 25 | 25.8 |
Calculation of effect size.
| Variable | Effect size | Rating |
|---|
| Organisational commitment | 0.265 | Medium |
| Job characteristics | 0.040 | Small |
| Job satisfaction | -0.018 | Small |
*Partial Least Square-SEM test
Boostrapping was performed in Smart PLS to obtain the standardised path coefficients, standard errors, and t-values in order to assess the significance of each hypothesised relationship. [Table/Fig-3] showed that H1, H2, H3, H5, H6 are supported except H4 which is not supported. Effect size serves as a practical guide to interpret the practical importance of a specific relationship [15]. This could be done by examining the f2 effect size that is calculated manually [14], and the formula was f2=R2included-R2excluded/1-R2included.
Summary of hypothesis testing.
| Hypothesis | Path coefficient | T-statistics | Decisions |
|---|
| Job characteristics→intentions (H1) | -0.213 | 4.309 | Supported |
| Job characteristics→Commitment organisation (H2) | 0.184 | 3.626 | Supported |
| Job characteristics→Job satisfaction (H3) | 0.499 | 6.588 | Supported |
| Job satisfaction→Turnover intentions (H4) | 0.067 | 0.869 | Not supported |
| Job satisfaction→Commitment organisation (H5) | 0.374 | 3.178 | Supported |
| Commitment organisation→Turnover intentions (H6) | -0.496 | 4.587 | Supported |
*Partial Least Square-SEM test
The rule of thumb stated that the f2 values of 0.02, 0.15 and 0.35 represent small, medium, and high effect size, respectively [16]. Based on the rule thumb, it can be interpreted that organisation commitment had a medium effect on turnover intention amounting 26.5% and it had a small effect on job characteristics and job satisfaction amounting 4% and 2%.
The summary of hypothesis testing shown in [Table/Fig-3] indicates the following:
Hypothesis 1 (H1)-there was a significant negative correlation between Job Characteristics to Turnover Intentions (t-value ≥1.96)
Hypothesis 2 (H2)-there was a significant positive correlation between Job Characteristics to Commitment Organisation (t-value ≥1.96)
Hypothesis 3 (H3)-there was a significant positive correlation between Job Characteristics to Job Satisfaction (t-value ≥1.96)
Hypothesis 4 (H4)-there was a non-significant positive correlation between job satisfaction to turnover intentions (t-value ≤1.96).
Hypothesis 5 (H5)-there was a significant positive correlation between Job Satisfaction to Commitment Organisation (t-value ≥1.96)
Hypothesis 6 (H6)-there was a significant negative correlation between Commitment Organisation to Turnover Intentions (t-value ≥1.96)
In [Table/Fig-4], all the indicator of variables have loading factors of more than 0.50 and fitted well to the model, the results of AVE in each construct have values more than 0.50, which means that each construct is valid and also the CR (Composite Reliability) and Alpha Cronbach have values more than 0.70, which means it has good reliability [14]. In addition, the R2 value of turnover intention is 0.3288, which can be interpreted that variability of the turnover intention construct that can be explained by the variability of job characteristics, job satisfaction, and organisational commitment is 32.88% while 67.12% has been explained by other variables excluding those researched through this study.
Summary of constructs items loading, AVE, CR, Cronbachs Alpha, R-Square.
| Variable | Indicator | Loading | AVE | CR | Cronbach’s alpha | R2 |
|---|
| Job characteristics | Skill variety | 0.8295 | 0.5964 | 0.8790 | 0.8277 | |
| Task identity | 0.8802 | | | | |
| Task significance | 0.8250 | | | | |
| Autonomy | 0.6763 | | | | |
| Feedback | 0.6175 | | | | |
| Job satisfaction | Intrinsic | 0.9098 | 0.7795 | 0.8759 | 0.7203 | 0.2493 |
| Extrinsic | 0.8551 | | | | |
| Organisational commitment | Affective | 0.7791 | 0.6226 | 0.8300 | 0.6935 | 0.2423 |
| Continuance | 0.8974 | | | | |
| Normative | 0.6750 | | | | |
| Turnover intention | Thoughts of quitting | 0.9241 | 0.8116 | 0.9279 | 0.8838 | 0.3288 |
| Intention to quit | 0.8299 | | | | |
| Intention to search for another job | 0.9445 | | | | |
*Partial Least Square-SEM test
PLS path modelling estimation for this research is shown in [Table/Fig-5]. By looking at the diagram the following preliminary observations can be made:
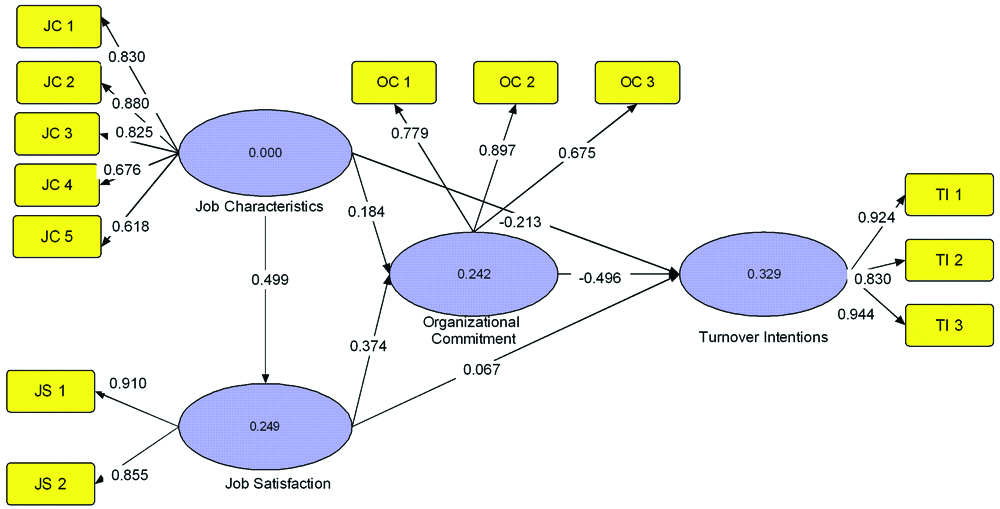
Explanation of target endogenous variable variance:
(i) The coefficient of determination R2, is 0.329 for the Turnover Intentions endogenous latent variable. This means that the three latent variables (Job Characteristics, Job Satisfaction, and Organisational commitment) moderately [17] explain 32.9% of the variance of Turnover Intentions;
(ii) Job Characteristics and Job Satisfaction together explain 24.2% of the variance of Organisational commitment;
(iii) Job Characteristics explain 24.9% of the variance of Job Satisfaction.
Inner model path coefficient sizes:
The inner model suggest that Organisational commitment has the strongest effect on Turnover Intentions (0.496), followed by Job Characteristics (-0.213) and Job Satisfaction (0.067).
Discussion
This study had revealed that job characteristics and commitment organisation are related to turnover intention, which is consistent to another research that showed that the impact of an employee’s organisational commitment results in a feeling of conformity and attachment between goals, individual values and goals and values [18]. Increased work involvement due to high organisational commitment also has an impact on the effectiveness of nursing services [19]. Another study among nurses working in hospitals under the jurisdiction of the Royal Thai Army, found that staff nurse job characteristics had a low level of positive correlation with job satisfaction and organisational commitment.
Job characteristics did not only have an impact on job satisfaction and organisational commitment, but also on work stress and the quality of worklife [8].
This study also demonstrated that job characteristics is positively related to commitment organisation and job satisfaction. These findings support the previous finding in Iranian hospital that showed well-designed job characteristics can help employees of the hospitals (physicians, nurses, and administrative staff) to remain committed to the company, but on the contrary, if the characteristics of the work are poor, then it is likely that employees will be less committed to the company, thus as result they choose to look for alternative jobs with better job characteristics in other companies [9].
This study demonstrated that job satisfaction is positively related to commitment organisation which is highly consistent with previous studies in Vietnamese hospital nurses, that was explained by the fact that the interactions with leaders and peers creates a positive workplace relationship and thereby enhances employee’s psychological attachment to the organisation [20].
Limitation(s)
The process of licensing research in hospitals was quite difficult and not all hospitals want to be researched, because they think that was a confidential data. Also, data collection were entrusted to the head of HRD and taken by pre-determined time, it was a challenge during field study to make sure that the participants were convenient in providing reliable information. The study only focused on of three variables, namely job characteristics, job satisfaction and organisational commitment, while other factors affecting nurse turnover intentions were not studied.
Conclusion(s)
It has been empirically shown that organisational commitment is the biggest effect to turnover intention. Therefore, policy makers in hospital must build work commitment to nurses, especially in order to have a feeling of attachment and loyalty to prevent nurses turnover the hospital.
*Partial Least Square-SEM test
*Partial Least Square-SEM test
*Partial Least Square-SEM test