Prostate cancer is next only to lung cancer among all the cancers affecting men [1]. Conventional diagnostic methods such as PSA and TRUS have facilitated the detection of early-stage prostate cancer. However, the accuracy of both methods is suboptimal [2]. The sensitivity of PSA as a screening method was highest when used for people between 65-69 years at 24% for PSA cut-off levels 4 ng/mL. Sensitivity was least when used for people belonging to the age group of 50-54 at 9% for PSA cut-off levels of 4 ng/mL [3].
Although TRUS is recognised as the method of choice for biopsy guidance, its low Positive Predictive Value (PPV) in diagnosing malignancy is a major drawback [4].
Because of the limitations of PSA, TRUS, and TRUS-guided biopsy, there is a need for further imaging. MRI is emerging as a powerful modality with recent MRI techniques, like MRS, DWI, or DCE for detecting early prostate cancer [5]. However, it is important to optimise MRI protocols and lower costs by including only necessary sequences in a prostate study. The present study was conducted with an aim to determine the use of TRUS and MRI in the detection of prostate cancer.
Materials and Methods
This prospective cross-sectional study was conducted in Indira Gandhi Medical College and Hospital, Shimla (Himachal Pradesh) among patients attending Urology Department from June 2012 to June 2013. It was approved by our institutional review board. The sample size was determined using the formula n=Z2P (1-P)/d2, where n=sample size, Z=Statistic for a level of confidence, P=Expected prevalence or proportion, d=Precision, with the above assumption and a margin of error of +5%. Sampling was done using simple sampling technique and minimum sample size required was 45. A total of 50 consecutive patients (mean age, 67 years; range, 50-85 years) were included in the study after informed consent. The inclusion criteria were: PSA levels >4 ng/mL, abnormal Digital Rectal Examination (DRE), and any suspicious prostatic lesion on transabdominal or transrectal sonography. Exclusion criteria were patients who have undergone prostate biopsy within three weeks, prostatitis, known case of prostate cancer, contraindications to MRI (e.g., cardiac pacemakers and intracranial clips), urinary tract infection and deranged coagulation profile. All the patients underwent TRUS and MRI examination followed by TRUS guided biopsy.
TRUS Technique
TRUS was done on Xario XG Toshiba machine by a transrectal probe of 6-9 MHz. Any focal hypoechoic or hyperechoic area, regions of mass effect and increased flow were evaluated by Doppler.
MRI Technique
MRI was performed on a 1.5-T whole-body MRI unit (Avanto, Siemens). Body coil was used for excitation, and pelvic phased-array coil was used for signal reception. Transverse, coronal and sagittal high resolution fast spin-echo T2WI of the prostate and seminal vesicles was performed with the following parameters: 5500/101; section thickness, 5 mm; intersection gap, 0 mm; field of view, 200 mm; matrix, 192×320. DWI was performed using a single-shot echoplanar imaging technique with the following parameters: 4300/84; section thickness, 4 mm; intersection gap, 0 mm; average, 4; bandwidth, 1446 Hz.
MRS data was obtained for a volume of the prostate after critically reviewing the transverse T2WI scans. Areas with high values for choline, citrate, and creatine were calculated using numeric integration. Metabolic ratio was obtained for citrate to choline plus creatine. The MRS data were acquired using the following parameters: TR/TE, 690/120; Scan resolution, 10×10×10; Average, 6; Acquisition time, 6 minutes 14 seconds.
After obtaining MRS data, DCE-MRI images were obtained using a multisection T1-weighted 3D vibe sequences with the following parameters: 5.43/2.5; flip angle, 10°; section thickness, 2.5 mm; distance factor, 20; field of view, 350 mm; matrix, 125×256 in the axial plane before and 18 times during IV bolus injection of gadopentetate dimeglumine without delay. About 15 mL of contrast was given at a rate of 3 mL/s followed by 15 mL of saline flush.
TRUS Guided Biopsy
A systematic 12 core biopsy was taken, 6 cores from the base, mid- gland and apex of the Peripheral Zone (PZ) bilaterally, four cores from the PZ in the bilateral margin and the remaining two cores from the Transitional Zone (TZ) bilaterally. One or two core biopsies were taken from any suspicious lesion on grayscale TRUS, Power Doppler Ultrasound (PDUS) and MRI. The biopsy samples were labelled according to the gland region they were obtained from and were sent in 10% formalin solution for histologic examination.
Histopathological Examination
Histological analysis was performed by the same pathologist using a standard method for preparation and staining of the tissue slices. The stain used was Haematoxylin and Eosin (H&E). The grade of the tumour was evaluated and given a standard Gleason score [6].
Quality Control
Patients underwent TRUS by an individual observer. MRI examination was done subsequently and was interpreted by a separate observer who was blinded to the findings of TRUS.
Image Interpretation
On TRUS, the prostate gland was evaluated for the presence of any focal lesion and their echo pattern, capsular integrity, the contour of the gland and extension of the disease process outside the limits of the gland margin. PDUS images were thoroughly analysed, and the vascularity was graded in the following manner: 0-No abnormal vascularity; 1-Low focal vascular clustering; 2-Intensive focal vascular clustering; 3-Diffuse vascular clustering. Grade 0 was considered negative, and 1, 2 and 3 grades were considered positive [7].
On MRI, the following criteria were regarded as prostate cancer:
(i) T2WI: A low signal intensity lesion within the peripheral or TZ, ill-defined prostatic margins and lack of capsule.
(ii) DWI and ADC maps: An area with focal signal hyperintensity on DWI and hypointensity on ADC relative to background prostatic parenchyma.
(iii) MRS: Voxels with Cit/(Cho+Cr) ratio <1.4 were taken as indicative of malignancy.
(iv) DCE-MRI: Early nodular enhancement (before the enhancement of the rest of the prostatic fossa and pelvic muscles) with early washout was interpreted as positive. Also, the presence, asymmetry and degree of enhancement was assessed.
Time-signal intensity curves from DCE-MRI were constructed, which were classified as follows:
1) Type 1- persistent enhancement (benign).
2) Type 2- early fast enhancement which is followed by a plateau phase in which signal intensity remained constant within the acquisition time with no more than 10% change from the peak enhancement (malignant).
3) Type 3- early fast enhancement followed by washout greater than 10% decrease in signal intensity after the peak enhancement (malignant).
Statistical Analysis
The data was analysed using Epi Info Version 7.0.9.7 for Windows. The sensitivity, specificity, PPV, NPV, likelihood ratio positive and likelihood ratio negative for each of the investigation was calculated and 95% confidence intervals around the point estimates were constructed.
Results
Histopathologic analysis detected prostate cancer in 19 (38%) of the 50 patients. Gray scale TRUS detected hypoechoic lesions in 29 patients out of which 19 (38%) were malignant [Table/Fig-1]. All the patients with loss of capsular integrity, contour distortion and extraprostatic extension on TRUS had malignancy with a specificity and PPV of 100% [Table/Fig-2]. PDUS positive areas were determined in 20 cases out of which 17 cases were positive for malignancy on HPE. According to vascularisation grading, 30 cases (60%) were identified as negative (grade 0) out of which 2 cases were malignant. PDUS had an accuracy of 92% in determining the site of suspicious areas with a specificity of 95.7% and PPV of 89.3%[Table/Fig-3].
Trans-Rectal Ultra-Sonographic (TRUS) - gray scale findings.
| Finding | All participants (n=50) | Malignant (n=19) | Benign (n=31) |
|---|
| No. | % | No. | % | No. | % |
|---|
| Hypoechoic pattern | 29 | 58.0 | 19 | 38.0 | 10 | 20.0 |
| Loss of capsular integrity right hemi-prostate | 8 | 16.0 | 8 | 16.0 | 0 | 0.0 |
| Loss of capsular integrity left hemi-prostate | 5 | 10.0 | 5 | 10.0 | 0 | 0.0 |
| Contour distortion right hemi-prostate | 8 | 16.0 | 8 | 16.0 | 0 | 0.0 |
| Contour distortion left hemi-prostate | 5 | 10.0 | 5 | 10.0 | 0 | 0.0 |
| Extra-prostatic extension right hemi-prostate | 7 | 14.0 | 7 | 14.0 | 0 | 0.0 |
| Extra-prostatic extension left hemi-prostate | 4 | 8.0 | 4 | 8.0 | 0 | 0.0 |
Sensitivity, specificity, Positive Predictive Value (PPV), Negative Predictive Value (NPV) and likelihood ratios of positive and negative tests of gray scale Trans-Rectal Ultrasonographic (TRUS) parameters with histo-pathologic findings as gold standard.
| Parameter | Diagnostic accuracy (%) | Sensitivity | Specificity | PPV | NPV | LHP1 | LHN2 |
|---|
| % | 95% CI3 | % | 95% CI | % | 95% CI | % | 95% CI | Estimate | 95% CI | Estimate | 95% CI |
|---|
| Size of the lesion >1 cm | 76.0 | 80.0 | 62.7-90.5 | 74.3 | 63.0-83.1 | 57.1 | 42.2-70.9 | 89.7 | 79.2-95.2 | 3.1 | 2.7-3.5 | 0.27 | 0.19-0.38 |
| Hypoechoic pattern | 80.0 | 100.0 | 83.2-100.0 | 67.7 | 50.1-81.4 | 65.5 | 47.3-80.1 | 100.0 | 84.5-100.0 | 3.1 | 2.6-3.8 | 0.00 | 0.0-? |
| Loss of capsular integrity | 86.0 | 53.3 | 36.1-69.8 | 100.0 | 94.8-100.0 | 100.0 | 80.6-100.0 | 83.3 | 74.0-89.8 | Undefined | Undefined | 0.47 | 0.41-0.54 |
| Contour distortion | 83.0 | 43.3 | 27.4-60.8 | 100.0 | 94.8-100.0 | 100.0 | 77.2-100.0 | 80.5 | 70.9-87.4 | Undefined | Undefined | 0.57 | 0.51-0.64 |
| Extra-prostatic extension | 81.0 | 36.7 | 21.9-54.5 | 100.0 | 94.8-100.0 | 100.0 | 74.1-100.0 | 78.7 | 69.1-85.9 | Undefined | Undefined | 0.63 | 0.57-0.70 |
(n=100; 50 for each hemiprostate)
1LHP: Likelihood ratio of a positive test; 2LHN: Likelihood ratio of a negative test; 3CI: Confidence interval
Sensitivity, specificity, Positive Predictive Value (PPV). Negative Predictive Value (NPV) and likelihood ratios of positive and negative tests of power doppler trans-rectal ultrasonographic parameters with histo-pathologic findings as gold standard.
| Parameter | Diagnostic accuracy (%) | Sensitivity | Specificity | PPV | NPV | LHP4 | LHN5 |
|---|
| % | 95% CI6 | % | 95% CI | % | 95% CI | % | 95% CI | Estimate | 95% CI | Estimate | 95% CI |
|---|
| Site of suspicious area (n=100;Rt hemi-prostate=50,Lt hemi-prostate=50) | 92.0 | 83.3 | 66.4-92.7 | 95.7 | 88.1-98.5 | 89.3 | 72.8-96.3 | 93.1 | 84.8-97.0 | 19.4 | 10.0-38.0 | 0.17 | 0.12-0.26 |
| Grades 1-3 (n=50) | 90.0 | 89.5 | 68.6-97.1 | 90.3 | 75.1-96.7 | 85.0 | 64.0-94.8 | 63.3 | 78.7-98.2 | 9.3 | 4.8-18.0 | 0.12 | 0.04-0.31 |
4LHP: Likelihood ratio of a positive test; 5LHN: Likelihood ratio of a negative test; 6CI: Confidence interval
Magnetic Resonance Imaging
All the patients with malignancy were diagnosed as adenocarcinoma and grading was done according to Gleason system. Perineural invasion was present in 8 (42.1%) cases. All the target biopsies taken from suspicious areas detected on MRI were positive for malignancy.
DWI, ADC, MRS and DCE-MRI had very high likelihood ratio of the positive test as compared to T2WI. T2WI and DCE-MRI had very high likelihood ratio of a negative test [Table/Fig-4]. The combinations of DWI+DCE-MRI and ADC+DCE-MRI an MRS+DCE-MRI had the highest likelihood ratios for positive tests and T2WI+DCE-MRI had the highest likelihood ratios for negative tests amongst the models combining two variables [Table/Fig-5]. The combinations of T2WI+DWI+DCE-MRI, T2WI+ADC+DCE-MRI, The DWI+ADC+DCE-MRI had highest likelihood ratios for positive tests and T2WI+DWI+ADC, T2WI+DWI+DCE and DWI+ADC+DCE had the highest likelihood ratios for negative tests amongst the models combining three variables [Table/Fig-6].
Sensitivity, specificity, Positive Predictive Value (PPV), Negative Predictive Value (NPV) and likelihood ratios of positive and negative tests of dichotomised imaging variables on MRI in comparison with histo-pathologic findings as gold standard.
| Imaging variable | Diagnostic accuracy (%) | Sensitivity | Specificity | PPV7 | NPV8 | LHR9 (Positive) | LHR10 (Negative) |
|---|
| % | 95% CI11 | % | 95% CI | % | 95% CI | % | 95% CI | Estimate | 95% CI | Estimate | 95% CI |
|---|
| Individual variables |
| T2W112 | 72.0 | 100.0 | 83.2- 100.0 | 54.8 | 37.8-70.8 | 57.6 | 40.8-72.8 | 100.0 | 81.6-100.0 | 2.2 | 1.9-2.6 | 0.0 | 0.0-? |
| DWI | 92.0 | 94.7 | 75.4-99.1 | 90.3 | 75.1-96.7 | 85.7 | 65.4-95.0 | 96.6 | 82.8-99.4 | 9.8 | 5.1-18.9 | 0.06 | 0.01-0.42 |
| ADC | 92.0 | 94.7 | 75.4-99.1 | 90.3 | 75.1-96.7 | 85.7 | 65.4-95.0 | 96.6 | 82.8-99.4 | 9.8 | 5.1-18.9 | 0.06 | 0.01-0.42 |
| MRS | 88.0 | 84.2 | 62.4-94.5 | 90.3 | 75.1-96.7 | 84.2 | 62.4-94.5 | 90.3 | 75.1-96.7 | 8.7 | 4.4-17.1 | 0.18 | 0.09-0.34 |
| DCE13-MRI | 92.0 | 100.0 | 83.2- 100.0 | 87.1 | 71.2-94.9 | 82.6 | 62.9-93.0 | 100.0 | 87.5-100.0 | 7.8 | 4.8-12.7 | 0.0 | 0.0-? |
(n=50)
7PPV: Positive predictivevalue; 8NPV: Negative predictivevalue; 9LHR (Positive): Likelihood ratio of a positive test; 10LHR (Negative): Likelihood ratio of a negative test.
11CI: Confidence interval; 12T2W1 dichotomized on the basis oflow signal intensity in peripheral or transitional zone; 13Dichotomized on the basis of asymmetry of enhancement in either hemi-prostate
Sensitivity, specificity, Positive Predictive Value (PPV), Negative Predictive Value (NPV) and likelihood ratios of positive and negative tests of two dichotomised imaging variable combinations on MRI with histo-pathologic findings as gold standard.
| Imaging variable | Diagnostic accuracy (%) | Sensitivity | Specificity | PPV14 | NPV15 | LHR16 (Positive) | LHR17 (Negative) |
|---|
| % | 95% CI18 | % | 95% CI | % | 95% CI | % | 95% CI | Estimate | 95% CI | Estimate | 95% CI |
|---|
| Two variable combinations |
| T2W1+DWI | 92.0 | 94.7 | 75.4-99.1 | 90.3 | 75.1-96.7 | 85.7 | 65.4-95.0 | 96.6 | 82.8-99.4 | 9.8 | 5.1-18.9 | 0.06 | 0.01-0.42 |
| T2W1+ADC | 92.0 | 94.7 | 75.4-99.1 | 90.3 | 75.1-96.7 | 85.7 | 65.4-95.0 | 96.6 | 82.8-99.4 | 9.8 | 5.1-18.9 | 0.06 | 0.01-0.42 |
| T2W1+MRS | 88.0 | 84.2 | 62.4-94.5 | 90.3 | 75.1-96.7 | 84.2 | 62.4-94.5 | 90.3 | 75.1-96.7 | 8.7 | 4.4-17.1 | 0.18 | 0.09-0.34 |
| T2W1+DCE-MRI | 92.0 | 100.0 | 83.2-100.0 | 87.1 | 71.2-94.9 | 82.6 | 62.9-93.0 | 100.0 | 87.5-100.0 | 7.8 | 4.8-12.7 | 0.0 | 0.0-? |
| DWI+ADC | 92.0 | 94.7 | 75.4-99.1 | 90.3 | 75.1-96.7 | 85.7 | 65.4-95.0 | 96.6 | 82.8-99.4 | 9.8 | 5.1-18.9 | 0.06 | 0.01-0.42 |
| DWI+MRS | 94.0 | 84.2 | 62.4-94.5 | 100.0 | 89.0-100.0 | 100.0 | 80.6-100.0 | 91.2 | 77.0-97.0 | Undefined | Undefined | 0.16 | 0.08-0.30 |
| DWI+DCE-MRI | 94.0 | 94.7 | 75.4-99.1 | 93.6 | 79.3-98.2 | 90.0 | 69.9-97.2 | 96.7 | 83.3-99.4 | 14.7 | 5.5-39.4 | 0.06 | 0.01-0.40 |
| ADC+MRS | 94.0 | 84.2 | 62.4-94.5 | 100.0 | 89.0-100.0 | 100.0 | 80.6-100.0 | 91.2 | 77.0-97.0 | Undefined | Undefined | 0.16 | 0.08-0.30 |
| ADC+DCE-MRI | 94.0 | 94.7 | 75.4-99.1 | 93.6 | 79.3-98.2 | 90.0 | 69.9-97.2 | 96.7 | 83.3-99.4 | 14.7 | 5.5-39.4 | 0.06 | 0.01-0.40 |
| MRS+DCE-MRI | 90.0 | 84.2 | 62.4-94.5 | 93.6 | 79.3-98.2 | 89.0 | 67.2-96.9 | 90.6 | 75.8-96.8 | 13.1 | 4.8-35.6 | 0.17 | 0.09-0.33 |
(n=50)
14PPV: Positive predictive value; 15NPV: Negative predictive value; 16LHR (Positive): Likelihood ratio of a positive test; 17LHR (Negative): Likelihood ratio of a negative test; 18CI: Confidence interval
Sensitivity, specificity, Positive Predictive Value (PPV), Negative Predictive Value (NPV) and likelihood ratios of positive and negative tests of three dichotomised imaging variable combinations on MRI in comparison with histo-pathologic findings as gold standard.
| Imaging variable | Diagnostic accuracy (%) | Sensitivity | Specificity | PPV19 | NPV20 | LHR21 (Positive) | LHR22 (Negative) |
|---|
| % | 95% CI23 | % | 95% CI | % | 95% CI | % | 95% CI | Estimate | 95% CI | Estimate | 95% CI |
|---|
| Three variable combinations |
| T2W1+DWI+ADC | 92.0 | 94.7 | 75.4-99.1 | 90.3 | 75.1-96.7 | 85.7 | 65.4-95.0 | 96.6 | 82.8-99.4 | 9.8 | 5.1-18.9 | 0.06 | 0.01-0.42 |
| T2W1+DWI+MRS | 94.0 | 84.2 | 62.4-94.5 | 100.0 | 89.0-100.0 | 100.0 | 80.6-100.0 | 91.2 | 77.0-97.0 | Undefined | Undefined | 0.16 | 0.08-0.30 |
| T2W1+DWI+DCE | 94.0 | 94.7 | 75.4-99.1 | 93.6 | 79.3-98.2 | 90.0 | 69.9-97.2 | 96.7 | 83.3-99.4 | 14.7 | 5.5-39.4 | 0.06 | 0.01-0.40 |
| T2W1+ADC+MRS | 94.0 | 84.2 | 62.4-94.5 | 100.0 | 89.0-100.0 | 100.0 | 80.6-100.0 | 91.2 | 77.0-97.0 | Undefined | Undefined | 0.16 | 0.08-0.30 |
| T2W1+ADC+DCE | 94.0 | 94.7 | 75.4-99.1 | 93.6 | 79.3-98.2 | 90.0 | 69.9-97.2 | 96.7 | 83.3-99.4 | 14.7 | 5.5-39.4 | 0.06 | 0.01-0.40 |
| T2W1+MRS+DCE | 90.0 | 84.2 | 62.4-94.5 | 93.6 | 79.3-98.2 | 89.0 | 67.2-96.9 | 90.6 | 75.8-96.8 | 13.1 | 4.8-35.6 | 0.17 | 0.09-0.33 |
| DWI+ADC+MRS | 94.0 | 84.2 | 62.4-94.5 | 100.0 | 89.0-100.0 | 100.0 | 80.6-100.0 | 91.2 | 77.0-97.0 | Undefined | Undefined | 0.16 | 0.08-0.30 |
| DWI+ADC+DCE | 94.0 | 94.7 | 75.4-99.1 | 93.6 | 79.3-98.2 | 90.0 | 69.9-97.2 | 96.7 | 83.3-99.4 | 14.7 | 5.5-39.4 | 0.06 | 0.01-0.40 |
| ADC+MRS+DCE | 94.0 | 84.2 | 62.4-94.5 | 100.0 | 89.0-100.0 | 100.0 | 80.6-100.0 | 91.2 | 77.0-97.0 | Undefined | Undefined | 0.16 | 0.08-0.30 |
| MRS+DWI+DCE | 94.0 | 84.2 | 62.4-94.5 | 100.0 | 89.0-100.0 | 100.0 | 80.6-100.0 | 91.2 | 77.0-97.0 | Undefined | Undefined | 0.16 | 0.08-0.30 |
(n=50)
19PPV: Positive predictive value; 20NPV: Negative predictive value; 21LHR (Positive): Likelihood ratio of a positive test; 22LHR (Negative): Likelihood ratio of a negative test; 23CI: Confidence interval
The combination of T2W1+DWI+ADC+DCE-MRI had the highest likelihood ratios for positive tests, and T2WI+DWI+ADC+DCE had the highest likelihood ratio for negative tests amongst the models combining four variables [Table/Fig-7].
A 74-year-old male with adenocarcinoma prostate(gleason score 7) with positive MRI results on T2WI, MR Spectroscopy (MRS), Diffusion-Weighted Imaging (DWI), and Dynamic Contrast-Enhanced (DCE) MRI images. Patient’s PSA level was 243.7 ng/mL.
| Imaging variable | Diagnostic accuracy (%) | Sensitivity | Specificity | PPV24 | NPV25 | LHR26 (Positive) | LHR27 (Negative) |
|---|
| % | 95% CI28 | % | 95% CI | % | 95% CI | % | 95% CI | Estimate | 95% CI | Estimate | 95% CI |
|---|
| Fourvariable combinations |
| T2W1+DWI+ADC+MRS | 94.0 | 84.2 | 62.4-94.5 | 100.0 | 89.0-100.0 | 100.0 | 80.6-100.0 | 91.2 | 77.0-97.0 | Undefined | Undefined | 0.16 | 0.08-0.30 |
| T2W1+DWI+ADC+DCE | 94.0 | 94.7 | 75.4-99.1 | 93.6 | 79.3-98.2 | 90.0 | 69.9-97.2 | 96.7 | 83.3-99.4 | 14.7 | 5.5-39.4 | 0.06 | 0.01-0.40 |
| DWI+ADC+MRS+DCE | 94.0 | 84.2 | 62.4-94.5 | 100.0 | 89.0-100.0 | 100.0 | 80.6-100.0 | 91.2 | 77.0-97.0 | Undefined | Undefined | 0.16 | 0.08-0.30 |
| All five variables | 94.0 | 84.2 | 62.4-94.5 | 100.0 | 89.0-100.0 | 100.0 | 80.6-100.0 | 91.2 | 77.0-97.0 | Undefined | Undefined | 0.16 | 0.08-0.30 |
24PPV: Positive predictive value; 25NPV: Negative predictive value; 26LHR Positive: Likelihood ratio of a positive test; 27LHR Negative: Likelihood ratio of a negative test; 28CI: Confidence interval
The accuracy of model combining all the imaging variables (T2WI, MRS, DWI, ADC and DCE-MRI) in predicting prostate cancer was 94%, which was significantly higher than the diagnostic accuracy of each variable considered alone (DWI, 92%; ADC, 92%; MRS, 88.0%; DCE-MRI, 92%; and T2WI, 72%) [Table/Fig-4,7,8].
A 74-year-old male with adenocarcinoma prostate (gleason score 7) with positive MRI results on T2WI, MR Spectroscopy (MRS), Diffusion-Weighted Imaging (DWI), and Dynamic Contrast-Enhanced (DCE) MRI images. Patient’s PSA level was 243.7 ng/mL. a) Axial T2WI shows diffusely hypointense central as well as peripheral zone bilaterally. b) MRS image shows pathologic metabolic curve with reduced citrate and choline peak. Ci/Cho+Cr=0.04. c,d) DWI and ADC show restricted diffusion in the peripheral zone on the right side. e) DCE-MRI image shows curve type 3 from Region Of Interest (ROI) of lesion.
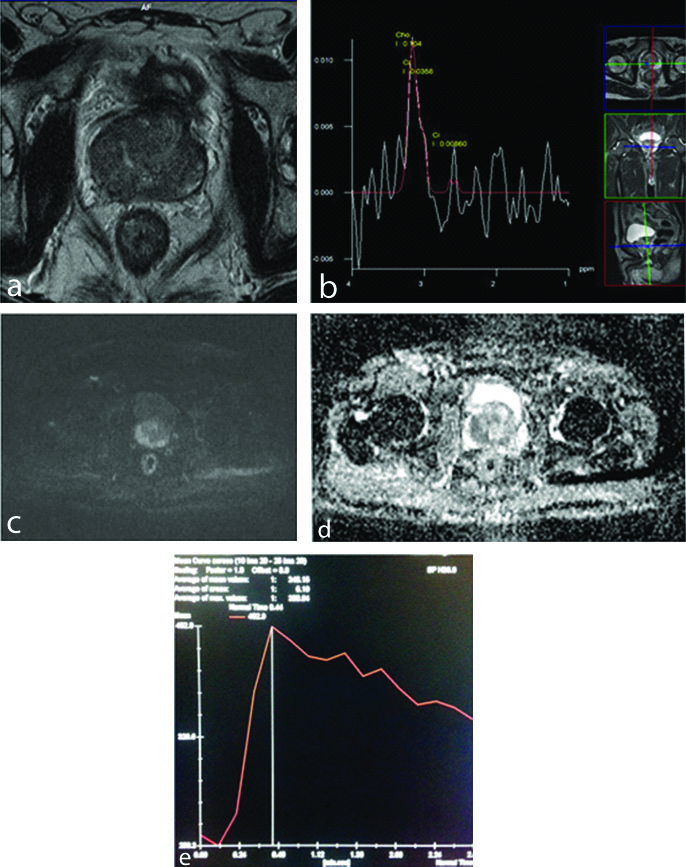
On TRUS (not shown), hypoechoic area was present in right peripheral zone. It showed increased vascularity and was assigned grade 2.
Discussion
In elderly men with an elevated level of serum PSA level, the probable prostate cancer should be localised and detected in the treatable stages. Up to 25% of cancers have a normal PSA level, and greater than 50% have normal DRE result. There was need for an additional diagnostic technique because of the lower sensitivity and specificity of TRUS [8,9].
The purpose of our study was to evaluate and optimise the most efficient MR sequences; T2WI, DCE-MRI, DWI, ADC mapping sequences and H-MRS for detecting the malignancy of the prostate gland.
Transrectal Ultrasound
In our study, TRUS had a diagnostic accuracy of 80%, a sensitivity of 100.0%, a specificity of 67.7%, a PPV of 65.5% and NPV of 100.0%. In a study by Song JM et al., the overall sensitivity, specificity and percent agreement (range) for TRUS were 73.6% (60.0% to 93.3%), 61.3% (26.5% to 91.7%), and 64.6% (37.0% to 92.2%), respectively [10]. Hypoechoic lesions of prostate detected by TRUS, correspond to a wide spectrum of pathologies such as prostatic carcinoma, prostate dysplasia, inflammatory changes, granulomatous prostatitis or benign prostatic hyperplastic nodules. TRUS has high sensitivity for detecting lesion but has very poor specificity.
Power Doppler
PDUS helps in improving the sensitivity of endorectal ultrasound even though it gives some false-negative results. It helps in visualisation of tumour vascularity, capsular extension and also aids in doing image-guided biopsies [11].
In the present study, PDUS had a diagnostic accuracy of 90% in determining prostate cancer with a specificity of 90.3%. In a survey by Boukadoum N et al., power Doppler showed a sensitivity of 44%, specificity of 96%, PPV of 84% and NPV of 80%. There was a positive correlation between power Doppler US and high Gleason scores. On correlating Doppler findings and Gleason scores, they found 86% of hypervascular lesions on power Doppler had a Gleason score of ≥7 compared to 26% of non-vascular malignant nodules [11]. In the present study, we found that 68% of hypervascular lesions on power Doppler had a Gleason score ≥7. KahramanT et al., in a study of 76 patients concluded that PDUS identified a higher number of cases as compared to grayscale imaging cases. PDUS had a higher sensitivity and specificity than TRUS (43% and 60%, respectively) and was able to identify cases with greater accuracy. When both TRUS and PDUS are used as a combined modality, it increases the cancer detection rate with a greater number of biopsies from the suspicious hypervascular foci [7].
In the present study, our goal was to evaluate the practical utility and limitation of PDUS guided biopsy by comparing it with grayscale TRUS and systematic TRUS guided biopsy. PDUS had a higher specificity but lower sensitivity than TRUS (67.7% and 100.0%, respectively). The diagnostic accuracy of PDUS was also higher than TRUS (90.0% vs 80.0%). They found that 17 of 20 hypoechoic hypervascular lesions were cancerous (34%), which suggested that biopsies should be taken both from PDUS and gray scale TRUS positive areas. These findings support the superiority of PDUS over TRUS in the selection of potential biopsy foci.
Reinsberg SA et al., showed that the combination of MRS and DWI increases the specificity of prostate cancer detection while retaining sensitivity compared with MRS alone or DWI alone. Similar results were observed in our present study [12].
When all the parameters of imaging are combined (T2WI, MRS, DWI, ADC and DCE-MRI) the accuracy was 94% which is very much increased when compared with the accuracy of individual parameter alone. The highest accuracy achieved with a combination of two imaging variables was 94% seen with combination of DWI+MRS, DWI+DCE-MRI, ADC+MRS and ADC+DCE-MRI. In present study no significant improvement was observed by the addition of third functional parameter. However DWI should be one of the sequences included.
In a previous study, to evaluate the value of including all three functional sequences, XZ Ma et al., also concluded that combining only two functional parameters led to a significant improvement in prostate cancer detection against the use of a single parameter and that addition of a third parameter does not further improve detection [13].
Our results can help optimise MRI protocols which will lead to cost-reduction by not including only the necessary sequences. As MRS is not widely available and also has the drawback of lacking a standardised evaluation method to ensure reproducibility, we strongly suggest that the protocol for prostate cancer detection should include at least one of either DWI or DCE-MRI sequence or a combination of both. DWI was the most accurate imaging predictor when considered individually, and it was also included in all the best models in our study.
Limitation(s)
One of the main limitations was the correlation of the imaging findings with the pathology findings: none of the patients underwent prostatectomy, so the imaging-histologic correlation in the 50 patients was based solely on the biopsy results. Secondly, correlations between the Gleason’s scores and the MRI findings were not fully investigated. Thirdly, most of our cases with malignancy were in an advanced stage with extraprostatic extension. Finally, larger studies are necessary to further validate our study.
Conclusion(s)
Routine prostate imaging protocol plus dynamic and functional MRI could be applied to patients with increasing PSA levels and abnormal DRE to evaluate the location of the tumour and its spread to neurovascular bundles and prostatic capsule. DWI could represent a non-invasive single diagnostic tool not only in the detection and localisation of prostate cancer but also in prediction of Gleason score. In summary, we have shown that adding data from a third functional technique does not further improve detection.
(n=100; 50 for each hemiprostate)
1LHP: Likelihood ratio of a positive test; 2LHN: Likelihood ratio of a negative test; 3CI: Confidence interval
4LHP: Likelihood ratio of a positive test; 5LHN: Likelihood ratio of a negative test; 6CI: Confidence interval