Hyperglycaemia is one of the prominent features, especially in metabolic disorder such as Type 2 Diabetes. It is because of low levels of insulin or increased Insulin Resistance (IR). Around 5-8% of deaths were reported worldwide in the last decade. As per the reports of World Health Organisation (WHO) in 2015, there is tremendous increase in diabetic cases in Asian countries especially in India. It is estimated that it will increase up to 180% in the coming 10 years [1]. About 400 million people suffered from diabetes in 2015 and this figure is anticipated up to 600 million by 2030, while 175 millions of mankind lives are undiagnosed. Out of these, 90% of the people are suffering from Type 2 DM [2]. Various research articles demonstrated that increased IR is the decisive factor in amelioration of type 2 diabetes in adults [3]. High death rate which is mainly through coronary disorders even in people without diabetes has been noted in various researches and this could be because of association between IR and metabolic syndrome.
Since body weight is associated with BMI and a strong correlation existed between an elevated BMI and the progression of type-2 DM through a study conducted in UK [4]. With Increase of BMI there is increase in IR, which indirectly elevates the blood glucose level and eventually leads to T2DM [5]. These considerations were anticipated as obesity and familiar in inducing IR as a result of lessened insulin sensitive receptors with the increase in weight [6]. Consequently, it is expected that BMI need to be correlated with circulating glucose levels in the body.
At the same time, various studies described about the strong association between high BMI and elevated Total cholesterol (TC), TG, LDL-C levels but not with the HDL-C levels. This association between BMI and lipid profile, mainly with LDL-C, explains about this predisposing factor in causing cardiovascular disorders in people with high BMI [7,8]. These outcomes uplifted the query of feasible contradictions about obesity, where HDL-C and LDL-C levels possibly increase or decrease with maximum BMI levels. Low HDL-C levels and poor glycaemic control enhances the impairment of the possibility of cardiovascular risk. Low HDL-C levels further deteriorate the glycaemic control by diminishing the insulin secretion with additional IR. However, the relationship between circulating HDL and glycaemic control has not been studied in a large T2DM population.
In recent times, GA has become accustomed marker for intermediate glycaemic control. In abidance with its justification as an index of denoted blood glucose measure, GA prognosticate its possibility in the advancement of various health issues in diabetic subjects and may be suggested as diagnostic criteria that detects more diabetes and pre-diabetes cases than fasting glucose or Oral Glucose Tolerance Test (OGTT) [9,10]. A prior diagnosis to accustom circulating lipids has to be manifested in lowering the cardiovascular issues and its impermanence [11,12]. The GA can be used as intermediate glycaemic marker in type 2 diabetics as it measures the blood glucose levels in the course of 3-4 weeks and considered to be the most objective and reliable measure of short-term metabolic control of glucose [13].
There is very limited research work available on GA and its association with BMI and dyslipidemia especially with the circulated levels of HDL-C. Majority of the studies has been carried out with long-term glycaemic marker that is HbA1c [14-16]. In the present study, it was tried to disclose the association of BMI and HDL-cholesterol along with GA levels in cases of type 2 diabetes.
Materials and Methods
This hospital based, case-control observational study was conducted in NIMS University Hospital (Jaipur, Rajasthan, India) between November 2017 to December 2018. Institutional Ethical Clearance has been obtained prior to the study (Acknowledgement No- IEC/NIMSUNIV/MC/FRP/009/82017). Fifty diabetic patients (males=28 females=22) and 50 healthy non-diabetic control subjects (males=32 females=18) participated in this study between the age group 32 years to 65 years.
The sample size of this study finalised based on the Krejcie and Morgan’s formula:
S=X2 NP(1-P)±d2 (N-])+X2 P(1-P)
S is required sample size, N is the population size, P is the population proportion (assumed to be 0.50 since this would provide the maximum sample size), d=the degree of accuracy expressed as proportion (0.05). All the participants’ has been divided in to two groups. Group 1 consists of 50 diabetic subjects and Group 2 consists of 50 healthy control subjects.
Inclusion criteria: All the cases were newly diagnosed type 2 diabetes based on 2 hours. Oral Glucose Tolerance Test (OGTT) as per WHO [17] referred by General Medicine OPD and controls recruited were non-teaching staff and health workers from the medical college and hospital.
Exclusion criteria: Patients who received previous hypoglycaemic medications and those with abnormal liver function, nephropathy, neuropathy or retinopathy were excluded from the study.
Weight was computed by employing electronic digital scales. Height was noted by using a wall-mounted stadiometer. Afterwards BMI computed in weight (kg) per height (m2).
Particulars were compiled by a pre-tested proforma confronting the purpose of the study. A 5 mL of fasting venous blood was collected, venous blood was pinched within plain vacutainers, serum has been separated by the use of centrifugation. An enzymatic method(albumin specific protease, ketoamine oxidase) has been employed to assess the levels of GA in serum(Lucica GA-L, Asahi Kasei Pharma Corp, Tokyo, Japan), on a BECKMANCOULTAR Autoanalyser. Lipid profile performed using autoanalyser Hitachi 902. Over night Fasting plasma glucose and 2h-OGTT (75 g glucose load) was evaluated for all the studied subjects.
Statistical Analysis
Values of the concerned parameters were statistically analysed by processing in SPSS software version 20. Notable variations among subjected groups have been appraised by student t-test. The r-values of the parameters has been calculated along with the Pearson correlation at the level of (p<0.05) significance.
Results
Based on BMI divisions from group 1 (n=50), 38 were overweight (25.0-29.9 kg/m2) and 9 were obese (>30 kg/m2). From group 2 (n=50), 42 cases within the normal range of BMI and 3 cases were under weight with statistically significant difference between Group 1 and Group 2 (p=0.001) [Table/Fig-1].
Anthropometric parameters description.
| Parameters | Group 1 (Diabetic n=50) (M= 28 F=22) | Group 2 (Normal n=50) (M= 32 F=18) | t-value | p-value |
|---|
| Age (years) | 48±14 | 38.±6 | -0.198 | 0.932 |
| BMI (Kg/m2) | 29±5 | 25.2±4.8 | 4.15 | 0.001* |
(p-value significant at <0.05) *p-value significant
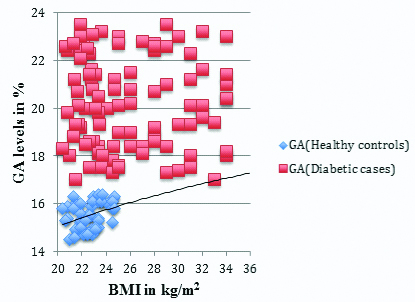
The results of this study disclosed that GA percentage was remarkably inflated in Group 1 (Diabetic cases) than that of Group 2 (Healthy control group) (20±2.85 vs.14.27±0.70, p<0.01) [Table/Fig-2]. There is a statistically strong positive correlation between GA and BMI (r=0.240, p<0.0001). GA has showed significant Pearson correlation coefficient (0.260) in diabetic patients when compared with BMI.
Correlation of GA levels in both Group 1 and Group 2.
(p-value significant at <0.01)
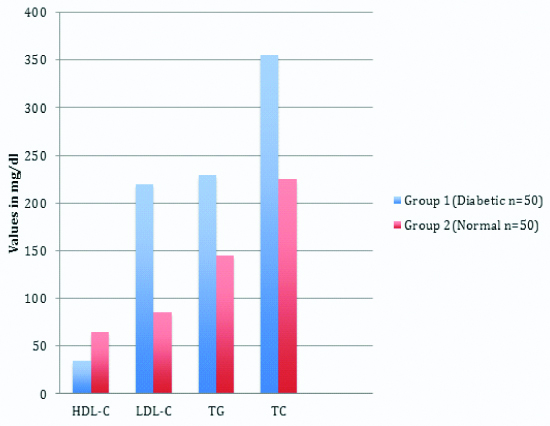
The distribution of lipid profile concentrations between Group 1 and Group 2, except HDL-C, all other lipid parameters increased in group 1 compared to group 2 [Table/Fig-3].
Comparison of lipid profile in both Group 1 and Group 2.
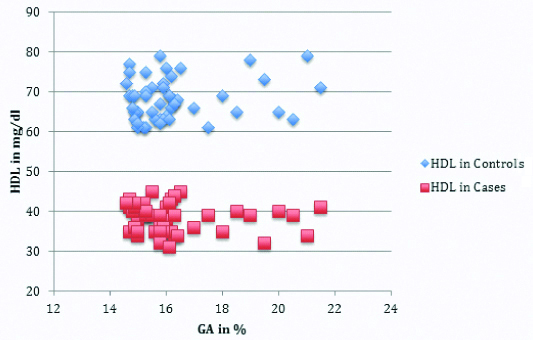
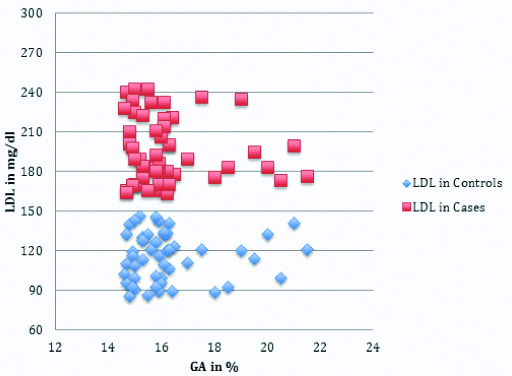
Correlations of different lipid parameters and different variables among Group 1 (diabetic cases) and Group 2 (healthy controls) were explained in [Table/Fig-4,5,6 and 7].
HDL and GA levels in both Group 1 and Group 2.
LDL-Cholestrol to GA levels in Group 1 & Group 2.
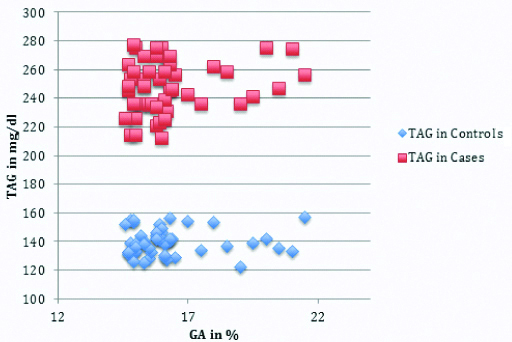
TAG to GA levels in Group 1 and Group 2.
Pearson’s correlations(r) between lipid profiles with BMI and GA between Group 1 and Group 2.
| Variables | Group 1 (Diabetic n=50) | Group 2 (Control n=50) |
|---|
| Parameters | BMI | GA | BMI | GA |
| r(p) | r(p) | r(p) | r(p) |
| HDL-C | -0.061 (0.647) | -0.286 (0.051) | -0.162 (0.046) | -0.055 (0.331) |
| LDL-C | 0.250** (0.0001) | 0.271** (0.0001) | 0.394** (0.0001) | 0.369** (0.0001) |
| TC | 0.187* (0.052) | 0.349** (0.0001) | 0.331** (0.005) | 0.496** (0.0001) |
| TG | 0.325** (0.0001) | 0.145* (0.05) | 0.599** (0.0001) | 0.217 (0.186) |
BMI: Body Mass Index; GA: Glycated albumin, HDL-C: High density lipoprotein-cholesterol; LDL-C: Low density lipoprotein-cholesterol; TC: Total cholesterol; TG: Triglycerides; **and*: Correlation is significant at 0.0001 level and 0.05 level, respectively
Additionally, HDL-cholesterol (mg/dL) levels were reduced in diabetic patients (group A) when compared to healthy control group (group B) (1.14±0.34 vs. 1.70±0.94, p<0.05). These values suggested that this association is statistically remarkable (2-tailed) at the 0.0001 level.
Moreover, there was a statistically significant conclusive association noted among BMI and LDL- cholesterol (r=0.250, p<0.0001) and GA and TG (r=0.145, p≤0.05) in diabetic cases group 1. There was a statistically significant correlation between GA and BMI (r=0.240, p<0.0001) and there was a statistically significant negative correlation between GA and HDL-cholesterol (r=-0.286, p<0.051) in diabetic patients. Moreover, the association between GA and LDL-cholesterol (r=0.271, p<0.0001) was also been found statistically significant [Table/Fig-7].
Discussion
The pathophysiology of both type 2 diabetes and its macro vascular issues are because of obesity. Within type 2 diabetic patients, the variations of BMI ranges provides valuable information in interlinking obesity and cardiovascular complications [18]. An effective reciprocity noted in amid of GA to LDL-cholesterol (r=0.271, p<0.0001) which has been found statistically significant. GA to TG (r=0.145, p<0.05) levels fabricates BMI as an impressive forecaster of dyslipidemia in type 2 diabetic patients. This study is in concordance with the observations of the previous study that the patients having obesity Body Mass Index >25 were 3.6 times more associated to have non-high density lipoprotein >130 mg/dL [19]. Hassan MM et al., reported a positive correlation between LDL-cholesterol and BMI and Waist Circumference (WC) in Egyptian diabetic patients [20].
The above outcomes are in concordance with many previous studies. Kondaveeti SB et al., reported that GA can be used as a potential dual marker of glycaemic control and dyslipidemia in type 2 DM [21]. In another study, followed-up in the Western Indian population, Miashita Y et al., showed that the dyslipidaemic obese cases had significant successive association with GA in T2DM subjects [22]. Consequently, initial diagnosis of dyslipidemia, cast-off as a prophylactic assessment in the origination of Cardiovascular Disease (CVD) in type 2 diabetics. Masumi AI et al., concluded that GA conceivably equip commanding additional information regarding the magnitude of circulating lipids beyond its constitutional role in monitoring short-term glycaemic control [23].
Naveen L et al., found a strong positive correlation between IR (The homeostasis model assessment of IR or HOMA-IR score) along with HbA1c. Furthermore, a significant association was also observed in between HOMA IR score, HbA1c and BMI [24]. Raja Reddy R et al., suggested that HbA1c meets the standards of predicting serum lipid profile in both the genders with diabetes [25]. Henceforth, supervising glycaemic control by employing GA along with lipid profile conceivably owns auxiliary aid in pointing out diabetic patients who are at a substantial menace of cardiovascular issues. Their study suggested that reciprocal menace of cardiovascular issues are towering in diabetic women when differentiated to diabetic men, nevertheless the exact contrivance in back of the piled-up risk entailed to be contrived in addition.
When Group 1 compared with Group 2, there is significant decrease in HDL-cholesterol where as increase in non HDL-cholesterol seen in Group 1. The piled-up portion of dispensed HDL is secondary to its debility of cholesterol. Numerous explicated enzymes entail in HDL metabolism are neutered in overweight people accompanied by IR. A few of mentioned changes are further generated in type 2 diabetes on top of IR, or absolute insulin deficiency [26,27]. Thus, the present study supported the outcomes of previous studies, and corroborates the concept of ‘the lower the better’ for circulated levels of LDL but not for non-HDL: HDL cholesterol levels [28,29]. From the above, it is clear that non-HDL: HDL-cholesterol might serve as an adequate screening tool for dyslipidemiain adolescents with diabetes.
Limitation(s)
The present study had limitations for being case-control study. The accuracy of newly diagnosed cases of T2DM and their duration of the DM was undetermined. However, the data suggested that GA could predict the unfavorable lipid profile and BMI in T2DM cases.
Conclusion(s)
The study results were exigent as they reserve the unpresuming effect of BMI on lipid profile. Dyslipidemia is the commonest health issue in the diabetic cases with its progression and gives the clue in determining coronary artery diseases. Being intermediate glycaemic marker, GA conceivably adopted as an obliging probable biomarker that tolerates the potentiality in forecasting serum lipid profile in type 2 diabetic cases and hence, distinct one are at a substantial menace of cardiovascular issues.
(p-value significant at <0.05) *p-value significant
BMI: Body Mass Index; GA: Glycated albumin, HDL-C: High density lipoprotein-cholesterol; LDL-C: Low density lipoprotein-cholesterol; TC: Total cholesterol; TG: Triglycerides; **and*: Correlation is significant at 0.0001 level and 0.05 level, respectively