Tuberculosis (TB) is an ancient disease that was once considered a death sentence for people affected by it. Luckily, with the advent of effective drug regimes that became available in the 1940’s, many developed nations of the world have been able to reduce the burden of TB to very low levels [1]. For most of the developing countries however, TB remains a major public health problem. Worldwide, TB is the leading cause of death from a single infectious agent (above HIV/AIDS) with millions of people affected by it each year [2]. In 2017, TB was responsible for nearly 1.3 million deaths (range, 1.2-1.4 million) in HIV-negative people and additional 300,000 deaths (range, 266 000-335 000) in HIV-positive ones [2].
Around 10 million people (range, 9-11.1 million) developed TB in 2017, among which 5.8 million were men, 3.2 million women and 1 million children. Twenty two countries in the WHO’s list of 30 high TB burden countries along with India, China, Indonesia, Pakistan, Nigeria, Philippines, Bangladesh, South Africa accounted for 87% of the world cases whereas only 6% of the global cases were reported from the WHO European Region and WHO Region of the Americas [2]. Also, worldwide in 2017, MDR/RR Rifampicin resistant was reported in 558,000 people (range, 483,000-639,000) of which 82% had MDR-TB. India reported nearly half of the world’s cases of MDR/RR (Rifampicin resistant) TB (24%) followed by China (13%) and the Russian Federation (10%) [2].
A much higher coverage of drug susceptibility testing among people diagnosed with TB is required to narrow the gap between detection of TB and initiation of treatment. With an insight into the genetic structure of mycobacteria viz-a-viz specific gene sequences, many gene amplification systems to diagnose mycobacteria have been developed in recent years [3,4]. Methods like GeneXpert, Polymerase Chain Reaction (PCR) and LPA’s can be employed for the direct detection of mycobacteria from clinical isolates, for the confirmation of isolates and even for detection of drug resistance at a molecular level. These diagnostic tools by rapidly confirming drug resistance aid the clinicians in taking evidence based appropriate treatment decisions that can prevent the spread of drug resistance in high TB burden countries like India [5].
Line Probe Assays (LPA) is a molecular test that uses reverse hybridisation technology. In it the mycobacterial DNA is extracted from the patients sample and amplified in a thermal cycler. The amplified product is then subjected to hybridisation with specific probes against genes of interest that have been immobilised on a membrane strip. WHO in June 2008 advocated the use of LPA for the diagnosis of MDR-TB [6]. Although technically more complex than the GeneXpert MTB/RIF, it offers the advantage of detecting resistance to Isoniazid (INH) in addition to Rifampicin (RIF). LPA was introduced some years back in India for rapid detection of MDR-TB under Indian revised National Tuberculosis Control Programme (RNTCP) in 2011 [7]. However, data regarding the utility of this test in Kashmiri population is non-existent.
The present study was conducted to ascertain the utility of LPA version 2.0 for the detection and susceptibility testing of MTB to INH and RIF and also to find out the most common mutations associated with their resistance in Kashmir, India.
Materials and Methods
This cross-sectional prospective study was carried out in the Department of Microbiology, Government Medical College, Srinagar, Jammu and Kashmir, India; for a period of 18 months from November 2016 till May 2018. The study was approved by the ethical committee of the institute bearing no: 59/ETH/GMC/ICMR.
Sample Collection and Processing
All sputum samples (n=6,480) from patients with history of cough of more than three weeks duration along with history of fever and weight loss received in the RNTCP centre and the Mycobacteriology section of the Department of Microbiology were screened for the presence of Acid Fast Bacilli (ABF) by Ziehl Neelson (ZN) staining [8] and smears were graded according to RNTCP recommendations [9]. Two samples were taken from each patient; one spot and one early morning (next day). All the collected samples were digested and decontaminated by N-acetyl-L-cysteine-Sodium hydroxide (NALC-NaOH) method [10] and resuspended in Phosphate Buffer Solution (PBS; pH 6.8) to achieve a final volume of 1 mL which was used for smear preparation, culture on LJ medium and DNA extraction for direct LPA (i.e., LPA done directly on the patients sample).
Culture on LJ Medium
All the smear positive sputum samples were inoculated onto LJ medium for culture that served as a backup for samples that tested negative initially on direct LPA. In such cases the growth on LJ was subjected to LPA. Also, 100 randomly selected smear negative samples were inoculated onto LJ medium. MTB was identified based on its characteristic morphological features on LJ medium, smear microscopy by ZN staining, and nitrate reductase assay [11]. Samples showing no growth (on LJ medium) were kept for eight weeks and inspected weekly before being discarded as negative.
Line Probe Assay (GenoType MTBDR plus version 2.0)
LPA (version 2.0 Hain Life Sciences, Nehran, Germany) was carried out on the samples as per manufacturer’s instructions [12]. Decontaminated samples were stored at -20°C and DNA extraction done within five days.
DNA extraction: DNA extraction was carried out using GenoLyse. Briefly 500 mL of decontaminated sputum deposit was centrifuged at 10,000 g for 15 minutes after which supernatant was discarded and pellet re-suspended in 100μl of lysis buffer (A-Lys). The tube was sealed and incubated for 5 minutes at 95°C in a water bath after which 100μl neutralisation buffer (A-NB) was added and the tube vortexed and the suspension was centrifuged for 5 minutes at full speed and the supernatant (DNA Extract) transferred to a fresh tube. From the growth on LJ medium, a few colonies were collected with an inoculating loop and suspended in 100μl A-Lys buffer and incubated for 5 minutes at 95°C. The rest of the steps were the same as mentioned above. The extracted DNA was stored at 4°C and used for amplification within 1-7 days. MTB H37Rv (ATCC 27294) served as positive control and sterile molecular grade water as negative control each time the test was carried out.
Amplification: The amplification was carried out in a thermal cycler using the protocol given by Hain Lifescience. Mutiplex PCR was carried out using 45 μL amplification mix consisting of 10 μL AM-A and 35 μL AM-B. The master mix was prepared freshly each time the test was carried out and aliquoted accordingly. To the master mix, 5 μL DNA solution was added in each tube in a separate room and amplification was performed with the final volume of 50 μL. The amplified products were stored at -20°C until further use.
Hybridisation: Hybridisation of the amplified products with the strips was performed using reagents provided with the kit in a TwinCubator. At the end of hybridisation the developed strips were pasted on the evaluation sheet provided with the kit in the designated fields by aligning the bands Conjugate Control (CC), Amplification Control (AC) and TUB (MTB complex specific control) with the respective lines.
Evaluation: Apart from the CC, AC and TUB bands the LPA strip had locus controls for rpoB, katG, and inhA genes. For RIF, eight wild-type (WT1-8) rpoB probes and four mutant probes (MUT1 D516V, MUT2A H526Y, MUT2B H526D, and MUT3 S531L) were present on the strip whereas for INH, two WT probes each for katG and inhA WT were present on the strip in addition to two mutant probes (MUT1 S315T1 and MUT2 S315T2) for katG and four mutant probes (MUT1 C15T, MUT2 A16G, MUT3A T8C, MUT3B T8A) for inhA. The results were interpreted as sensitive for either RIF or INH or both when all the WT bands for each drug were present and none of the mutant bands were visible. Resistance was indicated by the missing of a WT band or presence of a mutant band, whereas an isolate was labelled as hetero-resistant if all the WT and one or more mutant bands were present. The test was taken as invalid if any of the six amplification bands (CC, AC, TUB, rpoB, katG and inhA) were missing.
Turn-around time for each sample was calculated. In case of invalid results, the test was repeated one more time.
Statistical Analysis
Data was entered in Microsoft excel spreadsheet. Continuous variables were summarised as mean and SD, categorical variables as frequency and percentages. The sensitivity, specificity, PPV, NPV and diagnostic accuracy of LPA were reported along with their 95% confidence intervals. McNemar χ2 test was used for statistical hypothesis testing. Data was analysed using OpenEpi version 3.
Results
A total of 6,480 sputum samples were received in the Department of Microbiology and RNTCP centre over a period of 18 months from November 2016 till May 2018; out of which, 252 (3.9%) were smear positive for ABF by ZN stain. Most of the patients were in the age group of 50-59 years, 69 (27.4%) followed by ≥60 years, 56 (22.2%); whereas least number of patients were in the age group of 0-9, 3 (1.2%). Study population included 143 males (56.7%) and 109 females (43.3%) with majority of the patients being from rural areas 168 (66.7%) whereas only 84 (33.3%) hailed from urban locals. However the difference in gender, age group and residence in this study was not statistically significant (p>0.05). The clinical presentation and the co-morbidities in patients (n=252) whose sputum sample was positive for AFB is given in [Table/Fig-1].
Clinical presentation and co-morbid conditions in sputum smear positive cases (n=252).
| Clinical presentation/co-morbidities | (N) | (%) |
|---|
| Cough | 236 | 93.7 |
| Fever | 236 | 93.7 |
| Loss of appetite | 102 | 40.5 |
| Loss of weight | 98 | 38.9 |
| Expectoration | 57 | 22.6 |
| Chest pain | 23 | 9.1 |
| Breathlessness | 11 | 4.4 |
| Hypertension | 16 | 6.3 |
| Diabetes mellitus | 4 | 1.6 |
| Chronic kidney disease | 2 | 0.8 |
| HIV | 1 | 0.4 |
| Relapse | 28 | 11.1 |
| Default | 7 | 2.8 |
All the 252 smear positive sputum samples were subjected to direct LPA and culture on LJ medium. Of these, growth of MTB on LJ medium was seen in 238 (94.4%) samples, no growth was seen in 8 (3.2%) samples, whereas six samples (2.4%) showed growth pattern other than that of MTB. Direct LPA was positive in 241 (95.6%) samples whereas 6 (2.4%) samples gave invalid and 5 (1.9%) gave negative results [Table/Fig-2]. Six samples that gave invalid results on direct LPA were culture positive for non-tubercular mycobacteria and the five negative samples showed no growth on LJ medium. All the culture positive samples (n=238) were positive for MTB on direct LPA.
Comparison of culture on LJ with direct LPA for smear positive and negative sputum samples for Mycobacterium Tuberculosis (MTB).
| | Culture on LJ | LPA | |
|---|
| +ve | -ve | +ve | -ve | Total |
|---|
| Smear | +ve | 238 | 14 | 241 | 11 | 252 |
| -ve | 7* | 93 | 5** | 95 | 100 |
*Growth on LJ medium from the smear negative samples was seen in 13 samples of which 7 were MTB and 6 were NTM; **Direct LPA was positive in 5 samples. For the remaining 8 samples (of the 13), LPA was repeated using the growth on LJ. Of these 2 samples were positive for MTB and 6 gave invalid results
In addition to the smear positive samples, 100 (randomly selected) smear negative samples were also subjected to LPA and culture on LJ medium. Growth on LJ was seen in 13 samples of which seven were confirmed to be MTB by various parameters. Direct LPA was positive in five samples. Repeat LPA of eight culture positive samples (not positive on direct LPA) was done out of which two samples gave positive results and six samples gave invalid results [Table/Fig-2]. Isolates were confirmed to be MTB based on ZN staining, colony morphology and nitrate reductase assay (done on 93 randomly selected isolates from smear positive sputum samples and all the seven isolates from smear negative sputum samples).
The sensitivity, specificity, PPV and NPV of LPA as compared to culture on LJ medium for smear positive sputum samples in this study was 100%, 78.6%, 98.9% and 100%, respectively [Table/Fig-3]. The sensitivity, specificity, PPV and NPV of LPA as compared to culture on LJ medium for smear negative sputum samples on the other hand was 71.4%, 100%, 100% and 97.9%, respectively [Table/Fig-4]. Overall the sensitivity, specificity, PPV and NPV of LPA in comparison to culture on LJ medium was 99.2%, 97.2%, 98.8% and 98.1%, respectively. The diagnostic accuracy of the test was found to be 98.6%.
Comparison of LPA with culture for smear positive samples for MTB.
| Culture on LJ | | | | |
|---|
| | +ve | -ve | Sensitivity | Specificity | PPV | NPV |
|---|
| LPA | +ve | 238 | 3 | 100% | 78.6% | 98.8% | 100% |
| -ve | 0 | 11 |
Comparison of LPA with culture for smear negative samples for MTB.
| Culture on LJ | | | | |
|---|
| | +ve | -ve | Sensitivity | Specificity | PPV | NPV |
|---|
| LPA | +ve | 5 | 0 | 71.4% | 100% | 100% | 97.9% |
| -ve | 2 | 93 |
Of the 241 direct LPA positive sputum samples, 1 (0.4%) sample showed low level INH mono-resistance whereas 2 (0.8%) samples showed hetero-resistance to INH. In addition 1 sample (0.4%) was resistant to MDR-TB. On the other hand all the 7 samples (5 direct and 2 from culture on LJ) from the smear negative group that were tested by LPA were sensitive to INH and RIF. Various mutant bands and the corresponding resistance for INH and RIF is given in [Table/Fig-5,6], respectively.
Mutant bands and corresponding resistance for INH.
| Isoniazid resistance katG gene |
|---|
| Missing WT probe | Analysed codon | Mutation probe | Mutation |
|---|
| katG WT | 315 | katG MUT1 | S315T1 |
| Isoniazid resistance inhA gene |
| inhA WT1 | -15 | inhA MUT1 | C15T |
| -16 | inhA MUT2 | A16G |
| inhA WT2 | -8 | inhA MUT3A | T8C |
| inhA MUT3B | T8A |
Banding pattern obtained with katG probes helps in deducing high level INH resistance; whereas that obtained with inhA helps predict low level IHN resistance
Table depicting the mutant bands and corresponding resistance for RIF.
| Rifampicin resistance rpoB gene |
|---|
| Missing WT probe | Analysed codon | Mutation probe | Mutation |
|---|
| rpoB WT1 | 505-509 | | F505L |
| T508A |
| S509T |
| rpoB WT2 | 510-513 | | L511P |
| rpoB WT2/WT3 | 510-517 | | Q513L |
| Q513P |
| del514-516 |
| rpoB WT3/WT4 | 513-519 | rpoB MUT1 | D516V |
| D516Y |
| del515 |
| rpoB WT4/WT5 | 516-522 | | del518 |
| N5181 |
| rpoB WT5/WT6 | 518-525 | | S522L |
| S522Q |
| rpoB WT 7 | 526-529 | rpoB MUT2A | H526Y |
| rpoB MUT2B | H526D |
| H526R |
| H526Q |
| H526N |
| H526L |
| H526S |
| rpoB WT8 | 530-533 | rpoB MUT3 | S531L |
| S531P |
| S531Q |
| S531W |
| L533P |
Banding pattern obtained with rpoB probes depicts resistance to RIF
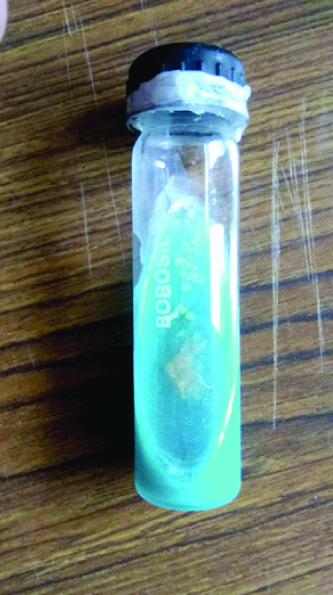
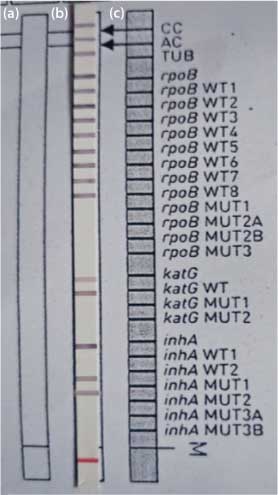
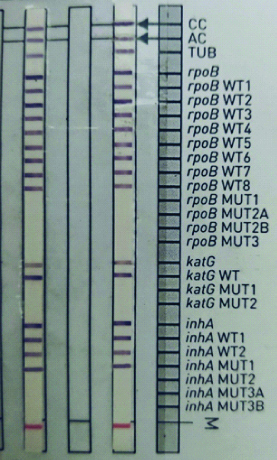
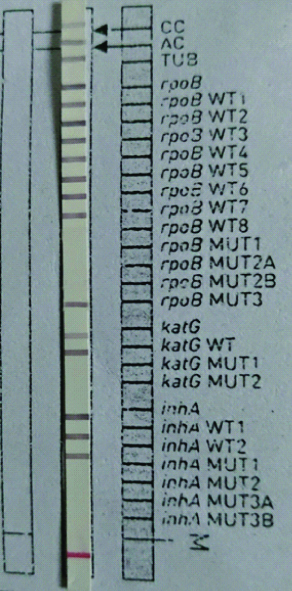
Growth of MTB on LJ medium is shown in [Table/Fig-7]. The sample with low level INH mono-resistance is depicted in [Table/Fig-8], absent inhA wild type 1 band and the presence of inhA MUT1 band that corresponds to the C15T mutation in the 15-nucleic acid position of the inhA promoter region. Two samples with INH hetero-resistance are depicted in [Table/Fig-9] showed similar mutation pattern C15T; in both these samples the inhA MUT1 band along with the wild type bands were present. The sample with RR-TB showed the presence of rpoB MUT3 band and absent rpoB WT8 band. This represents a mutation in the 531 codon of rpoB gene wherein serine is replaced by leucine as is evident in [Table/Fig-10].
Growth of MTB on LJ medium.
Depicts low level INH mono-resistance with absent inhA wild type 1 band and the presence of inhA MUT1.
a) Mono-resistance: presence of all control probes and the antibiotic loci along with missing WT loci of one gene only (like WT 1 of inhA in the above image) with the simultaneous presence of MUT band; b) Resistant: presence of all control probes and the antibiotic loci along with missing WT locus and the presence of MUT band (s); c) Susceptible: all the control probes (CC, AC, TUB) the antibiotic (rpoB, katG and inhA) locus and the corresponding WT loci present along with absent MUT bands
Depicts two samples having INH hetero-resistance mutation pattern with inhA MUT1 band along with the wild type bands present.
Depicts Rifampicin Resistance (RR-TB) with presence of rpoB MUT3 band and absent rpoB WT8 band.
For solid culture on LJ medium detection time ranged from 21 to 42 days with average detection time being 31.5 days. The turnaround time of LPA (from the receipt of sample to the generation of results) on the other hand ranged from 3-6 days. Average detection time for LPA was 3.8 days.
Discussion
Two hundred and fifty two sputum smear AFB positive and 100 randomly selected smear AFB negative samples were part of the present study. Of the 252 smear positive samples, growth on LJ medium was seen in 238 (94.4%) samples whereas direct LPA was positive in 241 (95.6%) samples. LPA picked up three samples positive for MTB that did not grow on culture. Two of these isolates were recovered from relapse cases and one from a default case of TB. Presence of live bacteria is necessary for growth on culture whereas a molecular test picks up dead bacteria also. This could be one of the reasons why three isolates failed to grow on LJ medium. In the study conducted by Raizada N et al., out of 320 samples inoculated on LJ medium growth of MTB was seen in 256 (80%) samples only whereas LPA was positive for 301 (94%) isolates [13]. Amongst the smear negative sputum samples direct LPA for MTB was positive in 5 (5%) samples whereas growth of MTB on LJ was seen in 7 (7%) samples. Repeat LPA was positive for the two isolates that showed growth on LJ medium. Nitrate reductase assay for the seven isolates from smear negative cases and 93 randomly selected isolates from smear positive cases confirmed the presence of MTB.
A very high sensitivity (100%) PPV (98.8%) and NPV (100%) of LPA as compared to culture on LJ medium was seen for smear positive samples although the specificity was only 78.6%. The low specificity of LPA in the present study could be due to fact that growth on solid media (LJ) was taken as reference. In various studies where results were compared with growth in liquid media (e.g., BacTAlert or MGIT 960) the specificity of LPA was high [14,15]. For smear negative sputum samples sensitivity was low (71.4%) whereas the specificity, PPV and NPV were high (100%, 100% and 97.9%, respectively). Overall the sensitivity, specificity, PPV and NPV of LPA in comparison to culture was 99.2%, 97.2%, 98.8% and 98.1%, respectively. The diagnostic accuracy of LPA test in this study was 98.6%. Tan Y et al., in their study found that the overall sensitivity of the LPA for the diagnosis of TB was 92.7% [16]. In smear-positive/culture-positive cases the sensitivity was 97.7% whereas in smear-negative/culture-positive cases it was 86.7% only. Meaza A et al., reported a sensitivity and specificity of 96.4% and 100%, respectively for the detection of MTB directly from smear positive sputum samples and a sensitivity and specificity of 77.8% and 97.2% for the detection of MTB directly from smear negative sputum samples [17]. Singh BK et al., in their study reported sensitivity and specificity of 71.5% and 100%, respectively for smear negative sputum samples [18].
The prevalence of INH mono-resistance ranging from 1% to 7% has been reported in various Indian studies [19,20]. In this study, low level INH mono-resistance was seen in 0.4% (n=1) samples whereas 0.8% (n=2) samples showed hetero-resistance to INH. In addition 0.4% (n=1) sample was RR-TB. In India, MDR-TB among new cases has been estimated to be around 2-3% [21]. However, none of the isolates in this study was found to be MDR. Results similar to what we saw in this study have been reported previously by Sharma SK et al., and Joseph MR et al., where low rates (<1%) of MDR-TB were seen among new sputum positive pulmonary TB patients [22,23]. Yacoob FL et al., found that of the 200 smear positive sputum samples MDR-TB was seen in 2 (1%) samples and 3 (1.5%) samples were resistant to INH only [5]. Rufai SB et al., in their study performed LPA on 285 smear-positive samples of which MDR-TB was seen in 25.8% samples with 22.2% showing RIF and 10.3% showing INH mono-resistance [24].
In the study conducted by Mohan N et al., the authors demonstrated MDR levels of 26.7% [25]; whereas in the study done on samples from Hyderabad and Koraput, Lingala MA et al., reported MDR levels of 34.7% by culture and drug susceptibility testing on LJ medium and sequencing which is different from what was observed in present study [26]. Ahmed S et al., in their study also observed a high level of MDR-TB; 21.0% while mono-resistance to RIF was detected in 5.9% and mono-resistance to INH was detected in 9.3% cases [27].
As reported by different authors previously, the prevalence and nature of mutations in the inhA and katG genes is variable among different geographic location [20,28,29]. The most predominant mutations reported by Yacoob FL et al., in their study were also S531L, S315T1, and C15T for rpoB, katG, and inhA genes, respectively [5]. Raizada N et al., also reported S531L (47%) to be the most common mutation in the rpoB gene that is associated with RIF resistance [13]. Kaur S et al., in their study also reported the most common mutations in rpoB and inhA gene to be S531L and C15T [30]. Same mutation patterns were also reported by Meaza A et al., [17].
The average turnaround time of LPA (from the receipt of sample to the generation of results) ranged from 3-6 days with an average detection time of 3.8 days which was way less as compared to culture on LJ (range 21-42 days; average detection time being 31.5 days). These results were in concordance with those reported by Yacoob FL et al., who found that the average detection time for conventional solid culture was 35.6 days whereas for LPA it was 3.8 days [5]. Raizada N et al., reported that with LPA results could be obtained anywhere between 1 to 76 days with the median time to detection being 11 days [13]. Various studies have reported different turnaround time for LPA ranging from 24 hours to 5 days [25,31,32]. This variation in the turnaround time can be attributed to the frequency of samples being received per day. Some laboratories might choose to run the assay batch wise, only when sufficient samples are present to be processed in a single run. Reduction in the turnaround time for the identification and simultaneous Drug Susceptibility Tests (DST) for MTB has a major impact in breaking the chain of transmission of TB.
Associated medical conditions like hypertension, diabetes mellitus and chronic kidney disease were seen in some patients. Also, one patient was HIV positive. Similar co-morbidities have been reported earlier by other authors as well [5,33].
To summarise, the proportion of INH and RIF resistance was relatively low in the studied population in this study. For Rifampicin the most common mutation was in the S531L region of rpoB gene and for INH the most common mutation was C15T in the inhA promoter region. The turnaround time for LPA was around four days although it is technically more demanding. Nonetheless, in high TB burden areas, with the appropriate infrastructure, LPA can go a long way in providing clinicians evidence based therapeutic options for the timely management of infected cases.
Limitation(s)
The study has certain limitations as well. Culture on LJ media was taken as a standard against which results of LPA were compared. This resulted in the low specificity of LPA as reflected in the results. Also, the susceptibility results of RIF and INH should have been compared to a reference standard like MGIT 960, however due to the non-availability of this equipment they were not compared. Nitrate reductase assay that was performed to confirm MTB could have been done for drug susceptibility also.
Conclusion(s)
This study emphasises that the routine implementation of LPA due to its rapid turnaround time and high specificity and sensitivity for detection and susceptibility testing of MTB directly from sputum smear-positive samples can significantly aid in the diagnosis, treatment, and management of MDR-TB. However, LPA cannot completely replace phenotypic culture methods, as the performance of this test is still low for sputum smear negative cases. The future of MTB testing lies in a more pragmatic approach wherein a combination of tests based on the availability of kits, equipment and expertise of technical staff are done to shorten the gap between diagnosis and treatment of anyone suffering from this age old disease.
*Growth on LJ medium from the smear negative samples was seen in 13 samples of which 7 were MTB and 6 were NTM; **Direct LPA was positive in 5 samples. For the remaining 8 samples (of the 13), LPA was repeated using the growth on LJ. Of these 2 samples were positive for MTB and 6 gave invalid results
Banding pattern obtained with katG probes helps in deducing high level INH resistance; whereas that obtained with inhA helps predict low level IHN resistance
Banding pattern obtained with rpoB probes depicts resistance to RIF