Salivary gland neoplasms constitute up to 5% of all head and neck tumours. The incidence of salivary gland neoplasms as a whole is approximately 2.5-3 cases per 100,000 individuals per year with malignant neoplasms accounting for 0.9 cases per 100,000 [1]. Mortality from malignant salivary gland neoplasms varies with stage and pathology, the overall 5-year survival rate being 72% [1].
The majority of salivary gland neoplasms arise in the parotid glands (80%) and rest (10-15%) in the submandibular glands [1]. About 80% of parotid neoplasms are benign, with higher proportion of malignancy in the smaller glands [2]. The most common benign tumour of parotid and submandibular gland is pleomorphic adenoma, which represents about 60% of all parotid neoplasms. The most common malignant tumours are mucoepidermoid and adenoid cystic carcinoma in parotid and submandibular gland respectively [3]. The preoperative demarcation between malignant and benign salivary tumour is important for surgical preparation [4].
Currently, ultrasonography (USG), CT and MRI are the imaging modalities for evaluation of salivary gland lesions. Ultrasonography is a time and cost-effective, easy to apply, and radiation free method which needs no contrast agent administration. CT and MRI provide more information about the relationship with surrounding tissues of the tumour but, are time consuming, costly and occupied in all settings. Despite high sensitivity of these imaging modalities, the accuracy in predicting the histopathology of lesions is limited because of considerable overlap between the imaging features of benign and malignant salivary gland lesions [2].
If there is a doubt regarding malignancy, then superficial or total parotidectomy and neck dissection are the treatment approaches [5]. Therefore, presuming the characteristics of the tumour before surgery is of utmost importance [6,7].
Sonoelastography is a new dynamic imaging technique that measures tissue stiffness with qualitative, quantitative and semi-quantitative parameters. Most of the malignant lesions are harder than benign lesions due to associated desmoplastic reaction. Elastography is mainly focused on this principle and determines the stiffness of mass by measuring the degree of strain related distortion under the application of an external force, thereby differentiating the nature of the lesions [8]. However, the application of sonoelastography is relatively new and still evolving. Further studies are still required to validate and establish its role in salivary gland imaging.
Hence, the aim of this study was to investigate the diagnostic efficacy of sonoelastography in characterisation of major salivary gland lesions and analyse its role as an adjunct modality to grey scale ultrasound using histopathology as gold standard.
Materials and Methods
This prospective cross-sectional study included 51 subjects presenting with salivary gland lesion to the Department of Radiodiagnosis, VMMC and Safdarjung Hospital, for a duration of 18 months (December 2015-June 2017). A written bilingual informed consent was taken before enrolling the subject for the study.
Inclusion criteria: All patients with clinically suspected lesions of parotid or submandibular glands of all age groups and both sexes were included.
Exclusion criteria: Those who had mass with ulcerated or raw surface or involvement of whole of the gland by the lesion were excluded from the study. The study was approved by the institution’s Ethics and Research Committee (IEC/VMMC/SJH/S. No:976).
Sample size was calculated by using qualitative variables based on the study by Li C et al., and with its values as reference, the minimum sample size of 51 was determined with desired precision of 25% and 5% level of significance [9].
Grey scale ultrasound of the concerned salivary gland was performed with linear array transducers of frequency 5-17 MHz and 3-9 MHz and the shape, size, margin and echo-pattern of the lesions were determined. Doppler assessment was also done to evaluate the presence and pattern of vascularity.
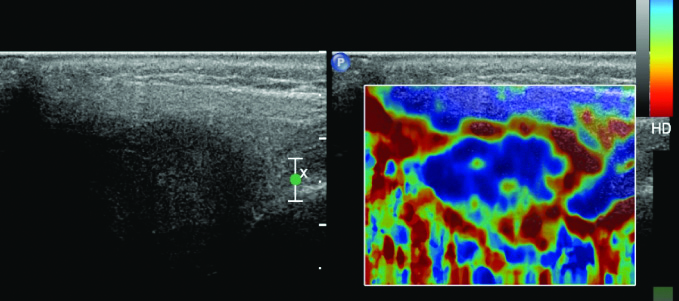
Subsequently, sonoelastography was performed using linear array transducer of frequency between 5 and 17 MHz with same depth focus and gained settings as for grey scale imaging. The grey scale and sonoelastography images were displayed side by side on a dual screen. The elastogram image of the detected lesion, was evaluated using colour coding ranging from blue (soft) [Table/Fig-1] through green [Table/Fig-2,3] and red (hard) [Table/Fig-4]. All lesions were scored on elastogram in terms of their stiffness compared to normal parenchyma using a 4-grade system like the grading presented by Dumitriu D et al., [10].
Conventional sonography of salivary gland lesion and corresponding elastogram showing a solid mass with soft areas (blue:elasticity) -pattern1.
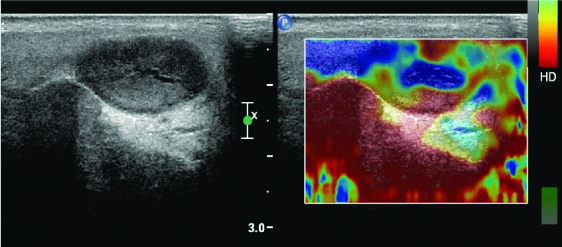
Conventional sonography of salivary gland lesion and corresponding elastogram showing a predominantly solid lesion with soft areas (blue: elasticity) in larger part of lesion, with inconstant appearance of hard (red: anelastic) areas-pattern 2.
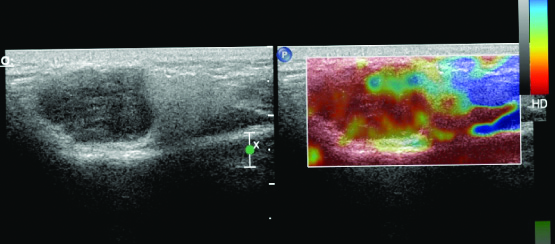
Conventional sonography of salivary gland lesion and corresponding elastogram showing a solid mass with few soft areas (blue: elasticity), with constant appearance of predominant hard areas (more than 50%; red: anelastic) areas -pattern 3.
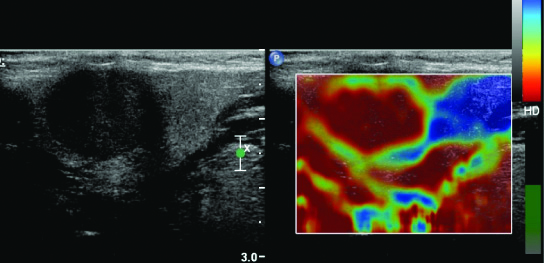
Conventional sonography of salivary gland lesion and correspondingelastogram showing a solid lesion with uniformly hard (red: anelastic) areas -pattern 4.
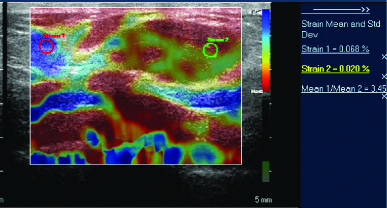
Strain ratio values of all the lesions were calculated individually [Table/Fig-5]. Ultrasound guided fine needle biopsy was done in all the patients under complete aseptic precautions. In patients who underwent surgery, histopathology was considered as the gold standard. Elasticity scores and strain ratio calculations were compared with histopathology results.
Strain elastography of a lesion in parotid gland shows the predominantly red colour of the lesion on colour map and a strain ratio of 3.45.
Statistical Analysis
The data was entered in MS EXCEL spreadsheet and analysis was done using SPSS version 21.0. Interpretation of the diagnostic modalities i.e., Ultrasound including Doppler and Elastography was compared with the pathology findings with regard to specificity, sensitivity, Positive Predictive Values (PPV) and Negative Predictive Values (NPV). Categorical variables were expressed in number and percentage (%) and continuous variables as mean±SD and median. Qualitative variables were correlated using Fisher’s-exact test. Inter-rater kappa agreement was used to find out the strength of agreement of ultrasound and elastography with FNAC and agreement value was good. A combined approach using both ultrasound and strain ratio was also analysed using paired t-test. ROC curve was used to find out best cut-off point of elastography score and strain ratio for predicting malignancy. p-value of <0.05 was considered as statistically significant.
Results
A total of 51 patients (21 females and 30 males; age ranging from 6 to 70 years and mean age 39.3±12.9 years) with one salivary gland lesion each were evaluated with grey scale ultrasound and sonoelastography. FNAC/histopathology was performed in all of them. Fourteen patients had lesions in left parotid and 21 in right parotid, 6 in right submandibular gland and 10 in left submandibular gland.
The echogenicity, internal structure, margins and vascularity characteristics of the masses that have been observed on grey-scale ultrasound and Doppler are shown in [Table/Fig-6]. The spectrum of pathological diagnosis of the lesions based on histopathology is tabulated in [Table/Fig-7].
Ultrasound and Doppler characteristics of the Lesions according to Histological subtypes.
| Characterstics of the lesions | Benign/Malignant on FNAC/Histopathology | Total | p-value |
|---|
| Benign | Malignant |
|---|
| Echogenecity |
| Heteroechoic | 14 | 25 | 51 | 0.049 |
| Hypoechoic | 10 | 0 |
| Isoechoic | 02 | 0 |
| Margins |
| Poorly defined | 5 | 6 | 51 | 0.006 |
| Well defined | 34 | 6 |
| Internal components |
| Cystic | 11 | 0 | 51 | 0.048 |
| Solid | 28 | 12 |
| Vascularity |
| Central | 0 | 2 | 51 | 0.005 |
| Mixed | 5 | 19 |
| Peripheral | 25 | 0 |
Spectrum of Pathological diagnosis of the lesions based on HP/FNAC.
| Pathological diagnosis | No. of lesions | Percentage |
|---|
| Abscess | 3 | 5.88% |
| Adenoid cystic carcinoma | 3 | 5.88% |
| Epidermal inclusion cyst | 2 | 3.92% |
| Lymphangioma | 2 | 3.92% |
| Mucocele | 4 | 7.84% |
| Mucoepidermoid carcinoma | 8 | 15.69% |
| Mucus retention cyst | 1 | 1.96% |
| Pleomorphic adenoma | 26 | 50.98% |
| Squamous cell carcinoma | 1 | 1.96% |
| Warthin tumour | 1 | 1.96% |
| Total | 51 | 100% |
Qualitative variables were correlated using Fisher’s-exact test
The imaging results of conventional sonography were compared with pathological diagnosis [Table/Fig-8] and the diagnostic accuracy was determined using histopathology as gold standard, which showed a sensitivity of 66.67%, specificity of 97.44%, PPV of 88.89% and NPV of 90.48%.
Cross tabulation conventional sonography and pathological diagnosis.
| Types of tumour | Pathology diagnosis | Total (n=51) |
|---|
| Benign | Malignant |
|---|
| Benign | 38 (74.51%) | 4 (7.84%) | 42 (82.35%) |
| Malignant | 1 (1.96%) | 8 (15.69%) | 9 (17.65%) |
| Total | 39 (76.47%) | 12 (23.53%) | 51 (100%) |
Inter rater kappa agreement to find out the strength of agreement of sonography with pathology and diagnostic test to assess the sensitivity, specificity, NPV and PPV and agreement value was good
Further, the imaging results of sonoelastography were compared with pathological diagnosis and the diagnostic accuracy of elastography score and strain ratio was determined [Table/Fig-9,10]. Elastography score showed a sensitivity of 41.67%, specificity of 87.18%, PPV of 50% and NPV of 82.93%. The value of elastography score alone was not found to be significant (p=0.308) with low sensitivity. However, strain ratio shows statistically significant difference (p<0.0001) with high sensitivity and NPV in differentiating benign and malignant lesions. Mean strain ratio of malignant lesions was 3.19±2.6 and strain ratio of >3 showed sensitivity 100%, specificity 84.62%, PPV 66.67% and NPV 100% as an indicator of malignancy. When we used both ultrasound and strain ratio using paired t-test the specificity was 100%, PPV 100% and NPV 86.67%, however sensitivity was reduced to 50%, hence ROC curves were used to find out best cut-off point and diagnostic accuracy of strain ratio [Table/Fig-11] and elastography score [Table/Fig-12] for predicting malignancy. A cut-off value of >3.7 for strain ratio and >3 for elastography score was determined to predict malignant lesion [Table/Fig-13].
Cross tabulation of Strain ratio and Pathological diagnosis.
| Benign/Malignant on FNAC/HP | Total | p-value |
|---|
| Benign | Malignant |
|---|
| Strain ratio | ≤3 | 33 (84.62%) | 0 (0%) | 33 (64.71%) | <0.0001 |
| >3 | 6 (15.38%) | 12 (100%) | 18 (35.29%) |
| Total | 39 (100%) | 12 (100%) | 51 (100%) |
Inter rater kappa agreement to find out the strength of agreement of sonoelastography with pathology and diagnostic test to assess the sensitivity, specificity, NPV and PPV and agreement value was good
Cross tabulation of Elastography score and Pathological diagnosis.
| Pathological diagnosis | Total | p-value |
|---|
| Benign | Malignant |
|---|
| Elastography score | 1 | 7 (17.95%) | 2 (16.67%) | 9 (17.65%) | 0.3083 |
| 2 | 13 (33.33%) | 3 (25%) | 16 (31.37%) |
| 3 | 14 (35.90%) | 2 (16.67%) | 16 (31.37%) |
| 4 | 5 (12.82%) | 5 (41.67%) | 10 (19.61%) |
| Total | 39 (100%) | 12 (100%) | 51 (100%) |
Inter rater kappa agreement to find out the strength of agreement of sonoelastography with pathology and diagnostic test to assess the sensitivity, specificity, NPV and PPV and agreement value was good
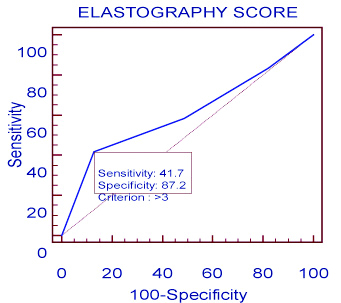
ROC of elastography score.
Diagnostic accuracy of strain ratio and elastography score based on ROC parameters.
| AUC | Standard error | 95% Confidence interval | p-value | Cut-off | Sensitivity | Specificity |
|---|
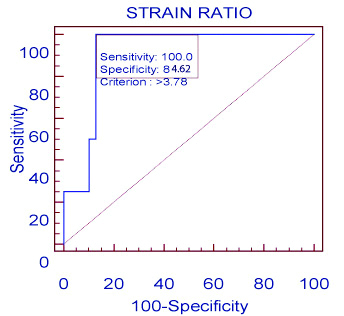
| Strain ratio | 0.910256 | 0.0416 | 0.796 to 0.97 | <0.0001 | >3.78 | 100 | 84.62 |
| Elastography score | 0.606838 | 0.105 | 0.46 to 0.74 | 0.3083 | >3 | 41.67 | 87.18 |
Receiver operating characteristic curve to find out best cut off point of strain ratio/elastography score for predicting malignancy and diagnostic test to assess the sensitivity and specificity; AUC: Area under curve
Discussion
Imaging and differentiation of benign and malignant salivary gland lesions is still a challenge to radiologists. The conventional sonographic features which suggest probably malignant nature of a lesion include irregular shape, ill-defined margins, heterogeneous appearance and increased vascularity. The sonographic features of probably benign lesion include round or ovoid shape, circumscribed well-defined margins and homogeneous appearance [11]. Pre-treatment lesion characterisation is of utmost importance as the management differs from conservative to superficial/partial or total parotidectomy depending on the diagnosis. In the present study, sonoelastography was used to evaluate the changes in tissue hardness in response to external forces and predicting biological character of salivary gland lesions and we found that it is a new promising tool for evaluation of salivary gland lesions further adding upon the diagnostic accuracy of conventional ultrasound.
Dumitriu D et al., published the first study in 2010 as to use of sonoelastography in evaluation of salivary gland lesions [12]. They studied 70 lesions and observed that most of the lesions demonstrated heterogeneous elastography image along with significant overlap of findings in pleomorphic adenoma and malignant lesions. The most specific finding they showed was lobulated contour which has not been seen in other benign tumours, but rarely seen in some malignant tumours.
Another study by Dumitriu D et al., on 74 salivary gland tumours (18 malignant and 56 benign tumours), using a four-point elasticity score showed statistically significant difference between benign and malignant lesions [10].
On the contrary, the results of present study showed that benign- malignant differentiation by elastography score alone is not significant (p = 0.308 for score), however the recent semi-quantitative analysis using strain ratio shows statistically significant difference between benign and malignant lesions (p<0.0001).
The results of present study were also concordant with Bhatia KS et al., in which 65 salivary gland lesions were studied with qualitative elastography scores alone and accomplished that this method is weak for differentiating benign lesions particularly pleomorphic adenoma from malignant ones [13]. In the present study blurred edge was defined in 6 malignant lesions, whereas 34 benign lesions showed well-defined edges and this finding was statistically significant (p=0.006).
In a similar study by Klintworth N et al., on 57 parotid mass lesions it was found that blurred edge is the main differentiating feature between malignant and benign tumours on conventional sonography [14].
Coman MM et al., concluded that strain ratio (SR) of >3 is suspicious for malignancy [15]. The present study found that the mean strain ratio of malignant lesions was 3.19±2.6. Using SR >3 as an indicator of malignancy we found 33 benign and 18 malignant lesions (p-value <0.0001 which was statistically significant). However, out of these 18 malignant lesions, 6 were found to be benign on pathological examination. All the false positive lesions were pleomorphic adenomas. This can be explained by the fact that pleomorphic adenomas, can have an important fibrous, stiff component which results in a higher strain ratio and elastography score; which was also observed in the first study by Dumitriu D et al., [10].
Farasat M et al., conducted a study on 27 lesions (25 in parotid and 2 in submandibular gland including 20 benign and 7 malignant lesions) and found no statistically significant difference between elastography scores and strain ratios of benign and malignant lesions (p = 0.708 for score and p = 0.698 for ratio) [16]. However, this study involved a small number of malignant lesions, which might influence the results. In the present study, strain ratio shows statistically significant difference between benign and malignant lesions (p<0.0001). The mandibular bone might affect the elastography score and strain ratio of salivary gland lesions as it restricts the compression which limits the usage of elastography [16].
Sonoelastography is moderately accurate in differentiating benign and malignant salivary gland tumours as stated by Ghajarzadeh M et al., in a literature review which showed pooled sensitivity of 63% and pooled specificity of 59% [17]. The present study showed a comparable sensitivity of 66.67%, however, the specificity was much higher i.e., 97.44% for conventional sonography.
In another recent literature review by Zhang Y et al., analysing total ten studies that included a total sample of 725 salivary gland lesions, sonoelastography showed a pooled sensitivity of 0.67, specificity of 0.64 and an AUC of 0.77 [18].
In contradiction, the present study shows that strain ratio of >3 has a sensitivity of 100% and specificity 84.62% (p<0.0001) which is higher than that of study by Zhang Y et al., hence carries higher diagnostic accuracy.
Thus, concluding that overall, sonoelastography has a limited role in differentiating between malignant and benign salivary gland lesions. Quantitative and semi-quantitative methods prove to be better tool/parameters than the qualitative ones.
Limitation(s)
As sonography is operator dependent and elastography is a new method in evaluating superficial glands such as lesions located in salivary glands. Maybe, more experience and precise definition of elastography method and application should be introduced to radiologist.
Conclusion(s)
Real time sonoelastography is an innovative supplement to conventional sonography for evaluation of salivary gland lesions. However, the present study asserts that its overall accuracy is less assuring, and cannot replace biopsy, which is still necessary to differentiate benign and malignant salivary gland lesions in routine clinical practice.
Qualitative variables were correlated using Fisher’s-exact test
Inter rater kappa agreement to find out the strength of agreement of sonography with pathology and diagnostic test to assess the sensitivity, specificity, NPV and PPV and agreement value was good
Inter rater kappa agreement to find out the strength of agreement of sonoelastography with pathology and diagnostic test to assess the sensitivity, specificity, NPV and PPV and agreement value was good
Inter rater kappa agreement to find out the strength of agreement of sonoelastography with pathology and diagnostic test to assess the sensitivity, specificity, NPV and PPV and agreement value was good
Receiver operating characteristic curve to find out best cut off point of strain ratio/elastography score for predicting malignancy and diagnostic test to assess the sensitivity and specificity; AUC: Area under curve