Protein Energy Malnutrition (PEM) is prevalent in haemodialysis population due to various reasons such as anorexia (reduced intake), infection (reduced immunity), inflammation (increased protein breakdown), metabolic acidosis (increased protein breakdown) [1]. It leads to increased mortality and morbidity in this maintenance haemodialysis population [2]. There are various validated methods to assess the nutritional status. Some of the traditional methods used are anthropometric measurements [3] like Height, Weight, BMI, Triceps SFT, MAC. Biochemical parameters like serum Albumin, serum Colesterol, serum Creatinine and Transferrin are also used [2]. S.Albumin is a predictor of poor dietary protein intake [2]. Hypoalbuminemia is also common in infection, inflammation and stress which is more prevalent in haemodialysis patients [2]. S.Creatinine is a marker of dietary protein intake and skeletal muscle mass [2]. S.Cholestrol levels are predictors of mortality [2]. There is an increasing risk of mortality as the serum cholesterol rises above the range of 200-300 mg/dL or decreases below 150 mg/dL [2].
There are a few questionnaires which are simple, convenient and cost-effective strategies that can be easily used by the nursing staff or dialysis technicians at the bedside for assessment of nutritional status [3].
Thus, the primary objective of the study was to assess the nutritional status of stable MHD patients by anthropometric methods, biochemical methods, MIS and compare them with SGA scores.
Secondary objective was to correlate SGA, MIS which assesses the nutritional status with the SF 36 scores which measures the HRQOL of these patients.
Materials and Methods
This was a clinical observational study conducted at the Institute of Nephro-Urology, Victoria Hospital campus, Bengaluru and Maintenance haemodialysis unit of Manipal Hospital, Bengaluru from January 2017 to January 2019. The study was approved by the Institutional Ethics Committee vide reference number (320-27135-151-203498).
We studied 60 stable outpatients on MHD selected randomly over a period of 2 years, who fulfilled the inclusion criteria. Informed consent was obtained from all the patients.
Inclusion criteria
Age between 18 to 85 years
Haemodialysis for at least 3 months
Ambulatory and receiving an oral diet.
Exclusion criteria
Hospitalisation in last 3 months prior to the beginning of the study due to severe illness, sepsis, shock, multiple organ failure, coma or surgical conditions.
Symptomatic Acquired Immunodeficiency Syndrome (AIDS), cirrhosis with encephalopathy, severe congestive heart failure, unstable or new onset angina pectoris, chronic pulmonary disease, and current hospitalisation.
Patients who fulfilled the inclusion criteria were evaluated for the following:
1. Collection of demographic data: Age, gender, co-morbidities (diabetes and hypertension), duration of dialysis. Similar dialysers were used. Each session of HD was of 210-240 minutes.
2. SGA: This bedside tool includes medical and weight histories, change in dietary intake, gastrointestinal symptoms, functional status, and physical examination. Each component is subjectively graded creating an overall score. Score of ≤10=normally nourished, 11-20=mild to moderately malnourished, or >20=moderate to severely malnourished. Scores range from 7 to 35. Higher scores depict poorer level of nutrition [8].
3. Anthropometry measurements: BMI, MAC, SFT. BMI was calculated using height and weight of the patient. BMI=Weight in kg/Height in m2, expressed as kg/m2. All the measurements were taken at the end of dialysis by a single investigator. Triceps SFT was measured using a skin fold caliper. An inch-tape was used to measure the MAC. An average of three measurements was taken as the final value.
4. Biochemical tests: S. Albumin, total Cholesterol, S.Ferritin, S.Transferrin saturation, TIBC and S.Creatinine as measured from predialysis fasting blood sample.
5. MIS: Derived from SGA score. It is scored from
medical history such as gastrointestinal symptoms, dietary intake, change in weight
presence of co-morbidities
physical examination such as signs of muscle wasting
BMI
Laboratory parameters like S. Albumin
Scores range from 0 to 30. Higher scores depict poorer state of nutrition [6].
SF 36: is a self-report measure of HRQOL. Responses to items can be computed into an eight-domain profile of scores: Physical Functioning (PF), Role Limitations-Physical (RP), Bodily Pain (BP), General Health (GH), Vitality (VT), Social Functioning (SF), Role Limitations-Emotional (RE), and Mental Health (MH). Additionally, physical and mental component summary. Scores range from 0 to 100. Higher scores depict better QOL [7].
The questionnaires were readout to the patients and their results were recorded by a single investigator. The physical examination of the patients was conducted by the same investigator at the same time. Biochemical parameters were obtained from the hospital MRD.
Statistical Analysis
Descriptive and inferential statistical analyses were carried out in the present study. Continuous data were presented as (Mean±SD) and categorical measurements were presented as numbers (percentage %). Significance was assessed at 5% level of significance.
Analysis of variance (ANOVA) was used to find the significance of study parameters between three or more groups of patients. Pearson’s correlation between study variables was performed to find the degree of relationship, Pearson’s correlation co-efficient ranging between -1 to 1. The p-value less than 0.05 were considered significant. The Statistical software namely SAS 9.2, SPSS 15.0, Stata 10.1, MedCalc 9.0.1, Systat 12.0 and R environment ver.2.11.1 were used for the analysis of the data and Microsoft word and Excel have been used to generate graphs, tables etc.
Results
A total of 60 patients were enrolled in the study. Majority of patients (41/60) were in the 51 to 70 years age group [Table/Fig-1].
Age distribution of patients.
| Age in years | No. of patients | % |
|---|
| <40 | 3 | 5.0 |
| 40-50 | 7 | 11.7 |
| 51-60 | 19 | 31.7 |
| 61-70 | 22 | 36.7 |
| 71-80 | 8 | 13.3 |
| >80 | 1 | 1.7 |
| Total | 60 | 100.0 |
Mean±SD: 59.62±11.94 yrs
Out of the total study subjects 65% were males [Table/Fig-2], 55% were diabetics [Table/Fig-3], 86.7% were hypertensive [Table/Fig-4], 53.3% of the patients had a dialysis vintage of <30 months [Table/Fig-5].
Gender distribution of patients studied.
| Gender | No. of patients | % |
|---|
| Female | 21 | 35.0 |
| Male | 39 | 65.0 |
| Total | 60 | 100.0 |
DM incidence of patients studied.
| Diabetes mellitus | No. of patients | % |
|---|
| No | 27 | 45.0 |
| Yes | 33 | 55.0 |
| Total | 60 | 100.0 |
HTN incidence of patients studied.
| Hypertension | No. of patients | % |
|---|
| No | 8 | 13.3 |
| Yes | 52 | 86.7 |
| Total | 60 | 100.0 |
Dialysis Vintage distribution of patients studied.
| Dialysis vintage (No. of months) | No. of patients | % |
|---|
| <30 | 32 | 53.3 |
| 30-90 | 20 | 33.3 |
| >90 | 8 | 13.3 |
| Total | 60 | 100.0 |
Mean±SD: 44.33±38.52
According to SGA, patients were divided into 3 groups as follows: 20% were in well-nourished group, 63.3% of patients were in mild to moderate malnourished group and 16.7% were in moderate to severe malnourished group [Table/Fig-6].
| SGA category (Score range) | No. of patients | % |
|---|
| Well nourished (≤10) | 12 | 20.0 |
| Mild to moderate malnourished (11-20) | 38 | 63.3 |
| Moderate to severe malnourished (>20) | 10 | 16.7 |
| Total | 60 | 100.0 |
As per ICMR, BMI of less than 18.5 kg/m2 is considered as underweight [2]. Skin Fold Thickness (TSF) depicts the subcutaneous fat [2]. MAC depicts skeletal mass [2]. While studying anthropometric parameters we found that there was a significant difference between the three groups. For BMI (p=0.001), MAC (p<0.001) and for TSF (p=0.003) in the 3 groups according to SGA groups [Table/Fig-7]. Patients with lower BMI scores had higher SGA scores predicting moderate to severe malnourishment. Patients with lesser MAC and lesser skin fold thickness values had higher SGA scores [Table/Fig-7].
Comparison of Anthropometric parameters in relation to SGA category of patients studied.
| Anthropometric parameters | SGA category (Mean±SD) | p-value |
|---|
| Well nourished | Mild to moderate malnourished | Moderate to severe malnourished |
|---|
| BMI (kg/m2) | 27.03±6.87 | 23.06±3.51 | 19.59±3.10 | 0.001** |
| Mid arm circumference (in cm) | 28.13±3.96 | 25.15±3.15 | 18.55±2.71 | <0.001** |
| Skin fold thickness (in mm) | 12.62±3.02 | 11.01±3.67 | 7.46±2.68 | 0.003** |
*statistically significant (p<0.05); **statistically highly significant (p<0.001)
Biochemical tests such as S.albumin, S.cholestrol, S.creatinine and Transferrin Saturation (TSAT) were significantly different between the three groups. For S.albumin (p=0.001), S.cholestrol (p=0.038), S.creatinine= (p=0.005), S.TSAT (p=0.047). Patients with lower serum albumin levels, lower serum cholesterol levels, lower serum creatinine and lower transferrin saturation scores had higher SGA scores [Table/Fig-8].
Comparison of lab parameters in relation to SGA category of patients studied.
| Variables | SGA category (Mean±SD) | p-value |
|---|
| Well nourished | Mild to moderate malnourished | Moderate to severe malnourished |
|---|
| Serum albumin (gm/dL) | 3.45±0.73 | 3.47±0.51 | 2.67±0.46 | 0.001** |
| Serum cholesterol (mg/dL) | 158.25±33.05 | 140.50±37.33 | 116.70±39.16 | 0.038* |
| Serum creatinine (mg/dL) | 7.95±2.94 | 7.07±2.13 | 4.83±1.42 | 0.005* |
| Transferrin saturation (%) | 31.99±9.11 | 25.39±17.80 | 17.98±5.22 | 0.047* |
| Ferritin (ng/mL) | 871.50±1204.17 | 372.19±344.88 | 866.90±546.03 | 0.993 |
| TIBC (microgm/dL) | 240.92±48.22 | 238.05±66.53 | 230.30±68.05 | 0.921 |
*statistically significant (p<0.05); **statistically highly significant (p<0.001)
A significant difference was noted in MIS scores between the three groups (p=<0.001). Patients with higher MIS scores were found in moderate to severely malnourished category [Table/Fig-9].
Comparison of MIS in relation to SGA category.
| SGA category (Mean±SD) | p-value |
|---|
| Well nourished | Mild to moderate malnourished | Moderate to severe malnourished |
|---|
| MIS | 10.83±1.70 | 15.82±3.12 | 21.70±8.82 | <0.001** |
*statistically significant (p<0.05); **statistically highly significant (p<0.001)
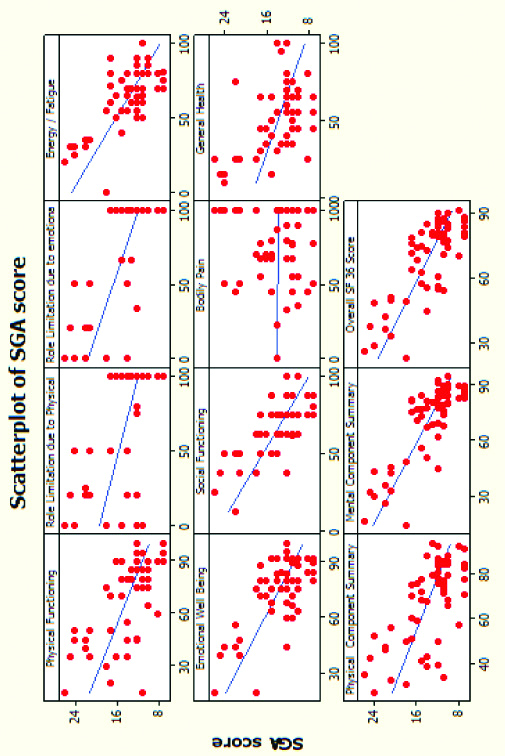
There was a significant negative correlation between MIS scores and WHO HR-QOL SF 36 parameters. Patients with poor nourishment (higher MIS scores), had poorer quality of life (lesser HRQOL SF 36 scores). Also, there was a significant negative correlation between SGA scores and WHO HR-QOL SF 36 scores. Patients with severe malnourishment (higher SGA scores), had poor quality of life (lesser WHO HRQOL SF 36 scores). However, Bodily pain component had no association with the nutritional status of the patient [Table/Fig-10,11]. Overall SF 36 score had negative correlation with SGA (r=-0.785) and MIS scores (r=-0.604).
Pearson’s correlation coefficient (r value) of WHO-HRQOL SF 36 with SGA and MIS.
| WHO QOL SF 36 | With SGA | With MIS |
|---|
| r-value | p-value | r-value | p-value |
|---|
| Physical functioning | -0.655 | <0.001** | -0.562 | <0.001** |
| Role limitation due to physical health | -0.593 | <0.001** | -0.441 | <0.001** |
| Role limitation due to emotional health | -0.706 | <0.001** | -0.510 | <0.001** |
| Energy/Fatigue | -0.747 | <0.001** | -0.580 | <0.001** |
| Emotional well being | -0.718 | <0.001** | -0.583 | <0.001** |
| Social functioning | -0.685 | <0.001** | -0.566 | <0.001** |
| Bodily pain | -0.010 | 0.941 | 0.032 | 0.810 |
| General health | -0.474 | <0.001* | -0.354 | 0.006* |
| Physical component summary | -0.657 | <0.001** | -0.501 | <0.001** |
| Mental component summary | -0.806 | <0.001** | -0.623 | <0.001** |
| Overall SF 36 score | -0.785 | <0.001** | -0.604 | <0.001** |
*statistically significant (p<0.05); **statistically highly significant (p<0.001)
Scatter plot depicting SGA score (red dots) and SF 36 scores (blue lines). We can see that except bodily pain, the rest of the parameters depict poor HRQOL (lower SF 36 scores) in patients who are severely malnourished (higher SGA scores).
Discussion
Malnutrition remains a serious concern in patients on MHD. There is a wide prevalence of PEM in patients on chronic haemodialysis and it is associated with poor QOL [2,9]. The present study study has demonstrated a prevalence of mild to moderate and moderate to severe malnutrition in 63.3% and 16.7% of patients respectively. In a study conducted by Janardhan V et al., 91% were in moderately nourished group of the total haemodialysis population [9]. Majority of the patients were in mild to moderately nourished group similar to our study.
Higher scores of SGA are associated with higher levels of malnourishment [9]. In our study, Patients in moderate to severely malnourished group had lower anthropometric values and lower biochemical parameters such as S.albumin, S.creatinine, S.cholestrol, S.TSAT. The findings are similar to the study by Janardhan V et al., who studied 66 haemodialysis patients in a south Indian tertiary care centre [9]. They demonstrated a significant negative correlation of anthropometric parameters and biochemical parameters such as Serum albumin, TIBC, ferritin and transferrin with the SGA scores. There was no significant difference in TIBC, S.ferritin and nutritional status in the various SGA categories in this study. Study by Janardhan V et al., showed a significant negative correlation between S.Ferritin and SGA categories [9]. Ferritin is also an acute phase reactant [9]. TIBC and Ferritin levels could be confounded by administration of I.V. iron supplements in this study.
In the present study, patients who had severe malnutrition had higher MIS scores. In a study by Zadeh KK et al., haemodialysis patients who were severely malnourished as per MIS scores had higher morbidity and mortality [10]. Malnutrition leads to increase in inflammatory parameters in the body. Inflammation in turn exaggerates malnutrition status, negative nitrogen balance, anorexia and weight loss. Hence both are closely interlinked [11].
There are various ways to assess the nutritional status of a haemodialysis patient, from anthropometric parameters to more complex methods such as Dual-energy X-ray Absorptiometry, bioimpedance assay [3]. But such complex methods are expensive, more time consuming, cumbersome and not always reliable [3]. Hence, SGA was designed to overcome these problems [3,8]. It is easy to use as it does not require any major training [3,8]. It is simple, reproducible, cost-effective and can be performed rapidly at bedside. It categorises patients into just 3 levels of severity of malnourishment [8]. One disadvantage is that it does not consider visceral protein levels [8]. It emphasises more on diet intake and body composition [8]. MIS scores are derived from SGA. They are more objective than SGA. MIS and SGA scores are surrogate markers of malnutrition and inflammation [6].
Nutritional status is likely to influence physical function, emotional well-being and overall quality of life in HD patients, and it also appears from observational studies that there is a strong independent relationship between malnutrition, quality of life and mortality risk in HD patients [6]. The present study also observed that there was a significant decline in the physical and the mental components of the WHO HRQOL SF 36 scores with a decrease in nutritional status of the patients. Patients who were severely malnourished, had poorer physical and mental components of quality of life (except for bodily pain). This finding is of clinical significance since SF 36 is a strong predictor of morbidity and mortality in MHD patients and the importance of HRQOL has been increasingly recognised by the healthcare providers [7]. But till date, the assessment of HRQOL still remains a research domain rather than being a routine practice in clinical arena. Rambod M et al., studied 809 stable HD outpatients and followed them up for 5 years. They concluded that MIS is associated with quality of life and prospective mortality [12]. Bilgic A et al., also demonstrated significant correlation between MIS and poor quality of life [13]. All these study results are similar to the current study results.
To the best of our knowledge this study is the first in India to assess the correlations between SGA, MIS scores and SF 36 HRQOL in Haemodialysis patients in a tertiary care hospital.
Limitation(s)
It is also important to assess whether interventions that improve HRQOL also decrease the risk of death and hospitalisation among haemodialysis patients. Hence, more studies with interventions are required. As the study was conducted using SGA, MIS and WHO HRQOL SF 36 questionnaire, the assessment and results are subjective.
Conclusion(s)
Malnutrition is one of the most commonly encountered problems in haemodialysis population as it increases the morbidity and mortality. Though anthropometry and biochemical tests are routinely done, they are incomplete, cumbersome to perform, time consuming, expensive and sometimes yield misleading results. SGA or MIS questionnaires help health care providers to identify patients who are poorly nourished, depressed and in need of physical and emotional support. SF 36 helps to assess the patients physical functioning and emotional well-being which can help the health care providers to assess the functional capacity of patients, recognise the symptoms of mental illness like depression, insomnia and facilitate psychiatric therapy. Also, helps to identify specific health related problems affecting different dimensions of a person’s life.
Based on this information, interventions such as intradialytic parenteral nutrition, appetite stimulants, anti-inflammatory drugs, exercise, anabolic hormones can be determined. Patients can be enrolled for diet therapy to ensure adequate intake of calories, protein, salts such as sodium, potassium, phosphorous, calcium and water. We can also monitor the progress of the patients by periodically assessing them. These interventions will help in improving the quality of life and reducing morbidity and mortality of the patients.
Mean±SD: 59.62±11.94 yrs
Mean±SD: 44.33±38.52
*statistically significant (p<0.05); **statistically highly significant (p<0.001)
*statistically significant (p<0.05); **statistically highly significant (p<0.001)
*statistically significant (p<0.05); **statistically highly significant (p<0.001)
*statistically significant (p<0.05); **statistically highly significant (p<0.001)