Brain tumours continue to be an important cause of neurological problems. Between 1990 and 2016, the age-standardised incidence of central nervous system cancers has increased by 17.3% [1]. Symptomatologically, there is a wide variation and it is of utmost important to detect these lesions with certainty [1].
MRI is considered superior to Computed Tomography (CT) for reasons like: superior soft tissue contrast differentiation, extent of tumour and relationship with surrounding eloquent structures can be demonstrated in a better way [2]. Magnetic resonance perfusion imaging complements conventional MR and refers to the technique which assesses various haemodynamic measurements non-invasively. These measurements are Cerebral Blood Volume (CBV), Cerebral Blood Flow (CBF) and Mean Transit Time (MTT). CBV is proportional to area under the contrast agent concentration-time curve. This value is generally expressed as rCBV which refers to measurement relative to standard reference, usually contralateral to white matter [3]. Most common primary neoplasms of Central Nervous System (CNS) in adults are of glial origin [1]. Among the tumours of glial origin, glioblastomas are the most common and are generally fatal [1,4]. Vascular morphology and the degree of angiogenesis are important elements in evaluation of different tumour types and their biological aggressiveness [5]. Perfusion MRI provide in-vivo maps of CBV that depict the overall tumour vascularity. rCBV measurements has been shown to correlate with both conventional angiographic assessment of tumour vascularity and histological measurements of tumour neovascularisation [6]. However, various studies published on this subject over the years showed different range and threshold of rCBV for low grade gliomas and high grade gliomas [7-9].
The present study was aimed at assessing the usefulness of MR perfusion imaging in differentiating low grade gliomas from high grade gliomas and to find out a cut-off value of rCBV which could be used to differentiate low grade gliomas from high grade gliomas.
Materials and Methods
A prospective cross-sectional study was carried out from July 2015 to June 2018 at a tertiary care hospital which has MRI, neurosurgery and oncology centres. Ethical clearance from Institutional Ethical Committee was obtained and informed consent was obtained from the participants.
Inclusion criteria: Twenty-three patients who were diagnosed to have intra-axial brain tumours either by CT or MRI were included in study.
Exclusion criteria: Patients who had received any treatment surgery/chemotherapy/radiotherapy etc., in past were excluded. Patients with imaging features of extra axial lesion or intra-axial infective/multifocal lesions were also excluded.
Imaging Technique
Study was conducted using Siemens Magnetom Symphony 1.5T MRI scanner. Routine MRI included axial T2-wighted FSE sequence (TR/TE of 4210/99 ms), 3D T1 sequence (TR/TE of 11/5.2 ms), FLAIR axial sequence (TR/TE/TI of 8200/114/2500 ms). Section thickness was 5 mm. Field of view was 230×173 mm for T2W and FLAIR, 224×256 mm in T1W. Matrix size was 384×512 in T2WI, 224×256 in T1WI and 308×512 in FLAIR sequence.
Perfusion imaging was performed using T2*-weighted Echo-planar sequence with following parameters: TR/TE of 1440/47, section thickness 5-7 mm. About 10-12 sections were obtained to cover entire tumour volume identified on T2W images. A series of 50 multi-section acquisitions were acquired with simultaneous contrast injection. Gadopentetate dimeglumine was used at dose of 0.1 mmol/kg. Contrast was injected in antecubital vein at rate of 4 mL/sec using a pressure injector and 16-18 guage IV catheter. Contrast injection was followed by saline bolus. Subsequently T1W post-gadolinium axial images were acquired.
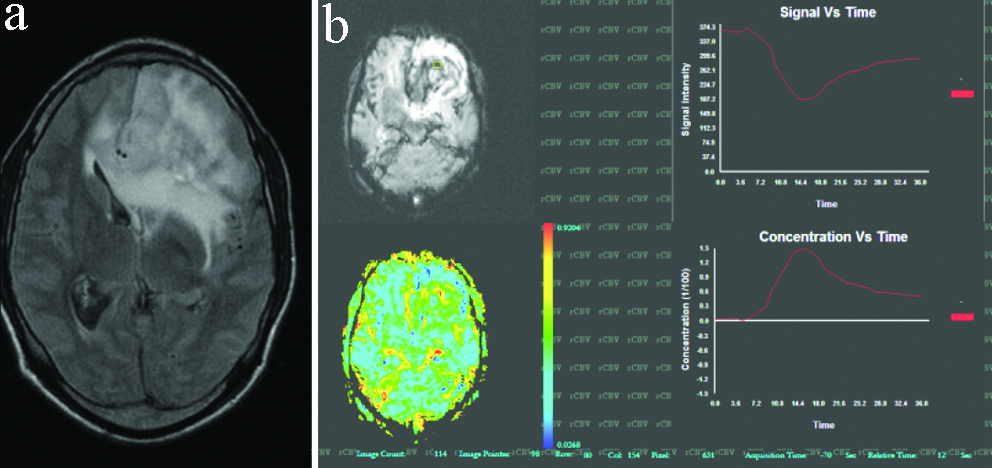
Post-processing was done using software developed at institute- named as ‘Promatheus’. Concentration vs time graph was generated to select series of first pass. Subsequently, using series rCBV colored maps were generated (limited integration method). The colour shaded maps were used to identify area of highest vascularity. Free hand Region Of Interest (ROI) for maximum coverage of area of interest was used to get absolute CBV. The recorded CBV was normalised with contralateral normal white matter to generate rCBV [Table/Fig-1,2]. Histopathological diagnosis was obtained and served as gold standard.
Case of left frontal lobe grade II astrocytoma. (a) FLAIR axial image shows a heterogenous signal intensity lesion extending across the mid line; (b) Generated rCBV coloured map however showed tumoural rCBV of 2.16, which favoured low grade glioma.
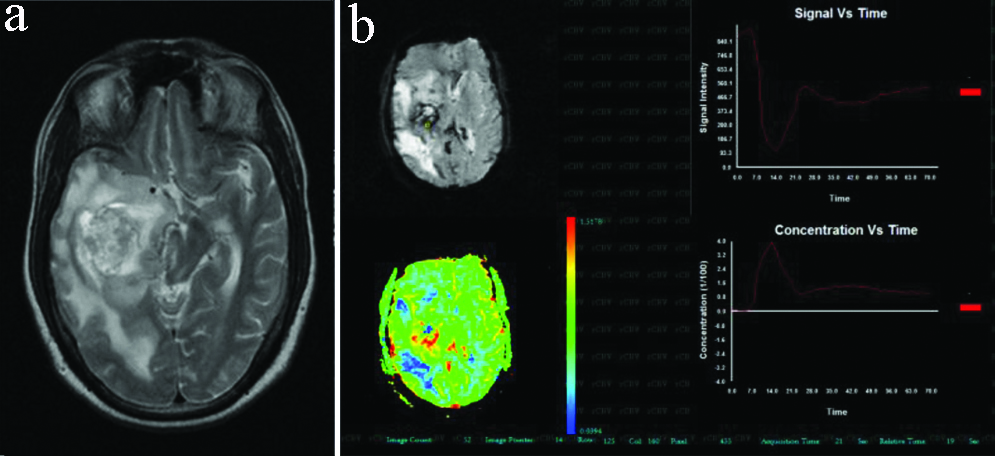
A case of right temporal lobe grade- IV astrocytoma. (a) T2W axial image shows, a heterogenous signal intensity tumour; (b) Generated rCBV coloured map for the same. Tumoural rCBV recorded in this case was 12 which favoured high grade glioma.
Statistical Analysis
Statistical analysis done by using SPSS (Statistical Package for Social Sciences) Version 20.0. Qualitative data variables expressed by using frequency and percentage (%). Quantitative data variables expressed by using mean and SD. Tukey’s test was used to compare the mean rCBV value for pairwise comparison of grades of tumour and unpaired t-test was used to compare the mean rCBV between high grade and low grade astrocytomas. ROC curve was used to find the sensitivity, specificity, Positive Predictive Value (PPV), Negative Predictive Value (NPV) and cut-off value of rCBV for detection of high grade tumour. The p-value <0.05 was considered as significant.
Results
Twenty-three patients were included in this study. Male preponderance was observed with 17 (73.9%) patients being male (M), 6 (26.1%) patients being females (F) and M:F ratio was 2.8:1. The youngest patient included was eight-year-old, the oldest was 72-year-old and the mean age was 41.07 years.
Among 23 patients, 69.6% had low grade tumour (aggregate of 6 patients of WHO grade-I astrocytoma and 10 patients of WHO grade II astrocytoma), 30.4% had high grade tumour (aggregate of 3 patients of grade III astrocytoma, 2 patients of grade IV astrocytoma and 2 patients of medulloblastoma) [Table/Fig-3]. Cases of medulloblastoma were not included for statistical analysis because in most of cases, patient age, clinical presentation and tumour location provide sufficient clues for diagnosis.
Distribution of different glioma grades and their frequency in patients.
| Tumour | Frequency | Percentage |
|---|
| Medulloblastoma | 2 | 8.7 |
| Astrocytoma | 21 | 91.3% |
| Grade I | 6 | 26.1 |
| Grade II | 10 | 43.5 |
| Grade III | 3 | 13.0 |
| Grade IV | 2 | 8.7 |
| Total | 23 | 100.0 |
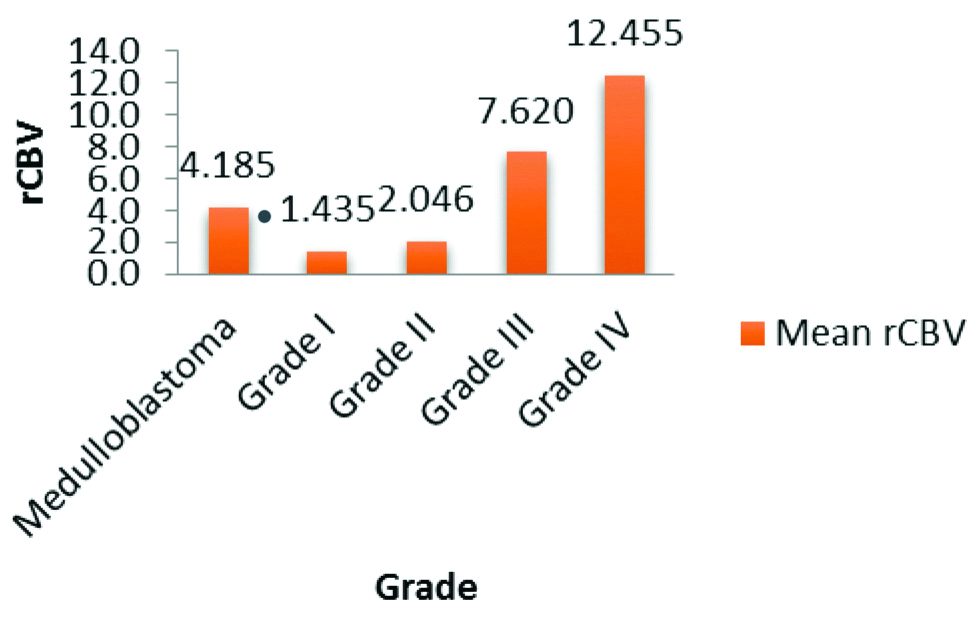
Mean rCBV of medulloblastoma was 4.185±2.482. An increase in value of rCBV was noted with increase in grade of astrocytoma [Table/Fig-4].
Mean rCBV among different tumours.
Out of 6 grade I astrocytomas, 3 cases had rCBV less than contralateral white matter whereas out of 10 grade II astrocytomas, only 1 case had rCBV less than contralateral normal white matter. Interestingly it had been observed that none of the cases with grade III/IV astrocytomas, had rCBV less than contralateral white matter.
Low grade astrocytoma (Grade I and Grade II) had mean rCBV of 1.817±1.207 and high grade astrocytoma (Grade III and Grade IV) had mean rCBV of 9.554±3.611. On applying Tukey’s test for the pair wise comparison among these two groups, it was observed that there was no significant difference of mean rCBV in Grade I and Grade II astrocytomas. Whereas when we compare the mean rCBV of low grade astrocytomas (grade I and grade II) with of high grade astrocytomas (grade III and grade IV) and apply unpaired t-test for comparison of two groups, this difference was statistically significant (p<0.001).
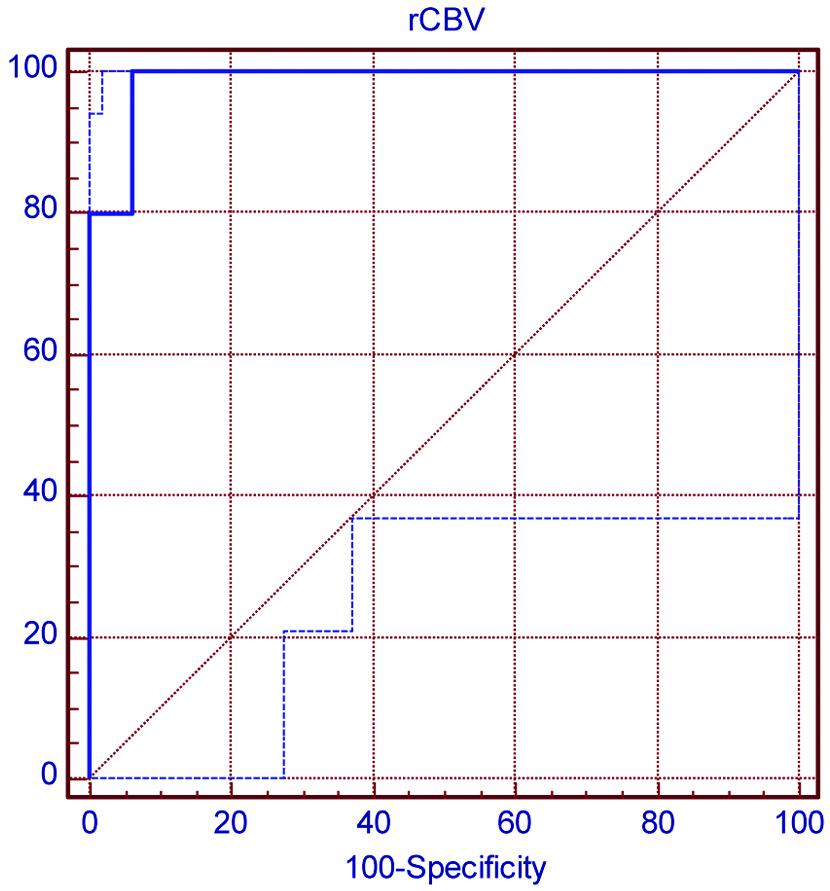
ROC curve was used to find sensitivity of rCBV in comparison with histopathological grade [Table/Fig-5]. Present study suggests that cut-off value of 3.41 of rCBV can be used to differentiate high grade astrocytoma from low grade astrocytoma with sensitivity of 100%, specificity of 93.7%, has PPV of 93.7% and NPV of 100%.
Receiver operating characteristic (ROC) Curve-used to find the sensitivity of rCBV in comparison of histopathological high grade glioma. Area under ROC curve is 0.987. At cut-off value of 3.41, sensitivity of rCBV is 100% and specificity of rCBV 93.7%.
Discussion
Gliomas are the most common brain tumours. Differentiating between low grade glioma and high grade glioma at times becomes difficult because of significant overlap of the two. Perfusion MRI provide in-vivo maps of CBV that depict the overall tumour vascularity, which allows indirect assessment of tumour angiogenesis. Magnetic resonance measurement of rCBV has been shown to correlate with both conventional angiographic assessments of tumour vascular density and histological measurement of tumour neovascularisation [10].
In this study, mean rCBV of low grade astrocytoma varied from 1.817±1.207, mean rCBV in high grade astrocytoma varied from 9.554±3.611 and this difference was statistically significant (p<0.001). These findings were comparable to that of Knopp EA et al., who studied 29 patients and correlated the maximum rCBV of each lesion with histopathological grading. They found that rCBV in low grade cohort varied from 0.92 to 2.19 with a mean of 1.44±0.68, high grade cohort varied from 1.73 to 13.70 with a mean of 5.07±2.79 and difference in rCBV was statistically significant (p<0.001) [11].
Findings of present study are also identical to Lee SJ et al., who had calculated mean rCBV in 22 patients of pathologically proven gliomas (9 glioblastomas, 9 anaplastic gliomas, 4 low grade gliomas). They found the mean rCBV value of 4.90±1.01, 3.97±0.56, 1.75±1.51 in glioblastomas, anaplastic glioma and low grade glioma, respectively. The difference in mean rCBV of anaplastic gliomas and low grade gliomas (p<0.05), between glioblastomas and low grade gliomas (p<0.01) were statistically significant [12].
Results of present study are also identical to study done by Shin JH et al., who calculated mean and standard deviation of rCBV and flow ratios in high grade and low grade gliomas. In their study, rCBV in high grade gliomas varied from 0.87 to 7.88 and in low grade gliomas cohort it varied from 0.72 to 5.10. This difference in mean rCBV of high grade gliomas and low grade gliomas was statistically significant [13]. Aronen HJ et al., noted rCBV varying from 0.82 to 5.40 in the high grade gliomas and from 1.01 to 1.21 in the low grade gliomas [14]. The difference in two groups was statistically significant. These results were also comparable to present study.
Present study suggests that a cut-off mean rCBV of 3.41 can be used to differentiate low grade glioma from high grade glioma with sensitivity of 100% and specificity of 93.7%. Various previous studies proposed a wide range of mean rCBV cut-off values for differentiating high grade gliomas from low grade gliomas. Lee SJ et al., noted that rCBV ratio cut-off value of 2.60 permitted differentiation of high grade gliomas from low grade gliomas with sensitivity and specificity of 100% and 75%, respectively [12]. Shoaib Y et al., noted that rCBV of 1.7 can be used for differentiating high grade glioma from low grade glioma with sensitivity and specificity of 82.6% and 75%, respectively [15]. Abrigo JM et al., in their recently concluded review article also accepted threshold value of 1.75 with overall sensitivity of 83% and specificity of 48% in detecting low grade gliomas [16]. On the contrary Ghodsi SM et al., noted that increasing rCBV cut-off value to 6.5 will bring 100 % sensitivity and specificity [17]. Kudo K et al., noted that rCBV cut-off value varied with software packages and brought out a range (4.18-6.53) of optimal cut-off value [18]. Results of current study are thus comparable with available literature.
In this study, out of 16 low grade astrocytomas, 4 had rCBV less than contralateral white matter where as none of high grade group revealed these characteristics. This has been found in few previous studies [11,16]. However, this current study strongly brings out that in case a tumour has rCBV less than contralateral white matter, it is nearly certain that tumour belongs to low grade group. In most of previous available studies, number of high grade tumours is nearly 60 to 70% of total lesions [12,13,15,19].
Limitation(s)
One of shortcomings of current study is the relatively small number of tumours in high grade tumours group. However, current study provides significant insight into the rCBV of low grade tumours.
Conclusion(s)
Perfusion MRI is useful in differentiating low grade gliomas from high grade gliomas preoperatively. Hence, its integration in routine MRI will enhance the diagnostic accuracy in differentiating low grade gliomas and high grade gliomas.