Worldwide, 9.6 million people are estimated to have fallen ill with TB in 2014 with 6 million new cases [1,2]. The response to standard ATT in tuberculosis is by sputum culture reports after treatment. However, sputum culture status cannot be used to monitor patients with sputum negative PTB and is again not applicable in the context of extra-pulmonary disease. Hence, more sensitive markers for Mycobacterium Tuberculosis (MTb) clearance are needed.
Present guidelines on stoppage of Intensive Phase (IP) in sputum negative cases are nebulous and largely based on studies on sputum positive TB cases. Although present guidelines have improved the outcome of TB, there are limitations, mainly because two months is too long to ascertain the individual treatment response, which may have clinical implications including the need for change of regimens. This is especially true for HIV positive patients. Serum estimation of cytokines that play an important role in the pathogenesis of TB may be useful to predict early response to ATT. The interaction of T cells with infected macrophages is central to protective immunity against MTb and depends on interaction of cytokines produced by each cell [3]. There have been varied results with cytokines estimation in various studies with variable sample size, protocols and genetic background. This has led to confusion in understanding immune profile of PTB cases [4,5].
Based on our search no study has been done in India about the cytokine response in patients with daily regimen and on institutional treatment. This study was conducted to delineate and identify the role of cytokines in predicting the early response to TB. This study would be helpful in operational research, wherein IP can be reduced based on cytokine estimation. The primary aim was to study the plasma concentrations of BAFF and APRIL in patients with active TB (both sputum positive and sputum negative PTB) before and after intensive phase of standard ATT. Secondarily, to compare the change in cytokines level in PTB cases before and after the two months of standard ATT and to compare the change in cytokines level between two groups (sputum positive and negative cases) after standard ATT.
Materials and Methods
This was a prospective pilot study carried out at two Tuberculosis Nodal Centers in Pune city, Maharashtra, India, from January 2018 to August 2019. IEC clearance was obtained for the study (IEC/100/2017 dated 26 Aug 2017). An informed written consent was obtained from all the patients.
Since there were no previous studies on BAFF and APRIL cytokines as markers of treatment response to ATT, we decided to do a pilot study with 40 patients each in sputum positive PTB and sputum negative PTB groups. All new PTB cases either sputum positive or sputum negative were considered for enrollment. Exclusion criteria were subjects whose clinical history was suspected of MDR-TB, who had history of contact with MDR-TB, those who had defaulted on ATT earlier of where CBNAAT showed rifampicin resistance.
Based on their sputum positivity, the PTB patients were divided into two groups: Group 1 consisted of subjects with active PTB patients whose sputum smear was negative for AFB or whose CBNAAT did not detect MTBC and group 2 consisted of active PTB patients with sputum smear positive for AFB or MTBC detected on CBNAAT. Baseline demographic and clinical data was first recorded. Then, serum was drawn for estimation of BAFF, APRIL, CRP and serum ferritin. The same estimation was repeated after first and second months of standard IP of ATT. The patients were monitored for evidence of Drug-Induced Liver Injury (DILI) and other adverse effects and their compliance was ensured by frequent surveillance and monitoring.
Statistical Analysis
Quantitative variables were described as mean and standard deviation. Qualitative variables were measured as number and frequency. Paired t-test was done after checking for normality. Hierarchical modeling was done to find out difference between group and within group over period of time. The p-value <0.05 was taken as statistically significant. All statistical tests were performed using StataCorp. 2013. Stata Statistical Software: Release 13. College Station, TX: StataCorp LP.
Results
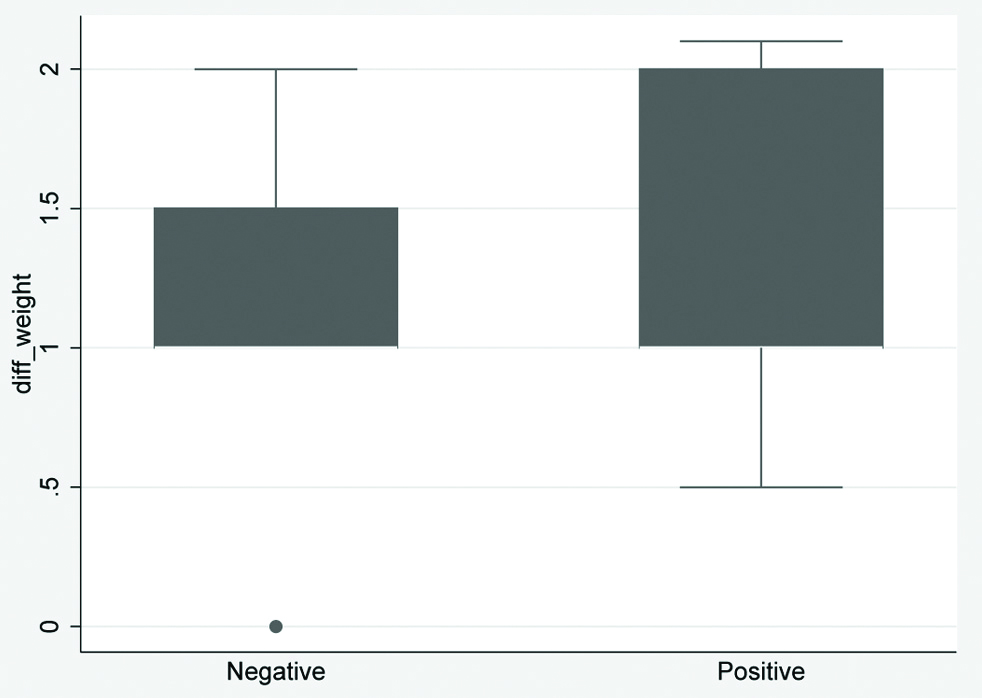
In this study 124 patients were analysed. The details of various symptoms and signs in two groups are depicted in [Table/Fig-1]. On clinical examination, the mean baseline weight was 48.8 (SD=1.15). There was no statistically significant difference in weight gain in two groups. On clinical examination, no significant abnormalities were found in 32 patients. The most common clinical finding was of consolidation followed by pleural effusion.
Depicting symptoms and signs of patients in two groups.
| Symptoms/signs | Sputum negative group | Sputum positive group |
|---|
| Fever | 23 | 48 |
| Cough | 40 | 73 |
| Dyspnea | 13 | 20 |
| Weight loss | 5 | 12 |
| Haemoptysis | 6 | 12 |
| Pleuritic chest pain | 4 | 14 |
| No signs | 11 | 21 |
| Consolidation | 15 | 31 |
| Lymphadenopathy | 4 | 13 |
| Pleural effusion | 5 | 14 |
| Volume loss | 10 | 13 |
The various radiographic changes in both groups are depicted in [Table/Fig-2]; 11 patients had normal radiographic chest X-ray, while most common radiographic finding was consolidation in the various lobes.
Depicting radiological signs in two groups.
| X-ray picture | Sputum negative group | Sputum positive group |
|---|
| Normal | 0 | 22 |
| Consolidation | 26 | 50 |
| Fibrosis | 0 | 2 |
| Pleural effusion | 6 | 15 |
| Pleural thickening | 1 | 2 |
The various baseline parameters and cytokines levels are depicted in [Table/Fig-3]. There was no significant difference in acute phase reactants before starting IP in both groups. The change in the levels of the cytokines before and after IP of ATT is depicted in [Table/Fig-4]. There was no significant difference in change in acute phase reactants before and after IP in two groups. There was a change in levels of APRIL before and after IP of ATT. However, this change was not statistically significant. A 100% of patients in sputum positive PTB arm showed sputum conversion at 2 months [Table/Fig-5].
Depicting baseline demography.
| Characteristics | Sputum positive N=81 (65.32%) | Sputum negative N=43 (34.68%) | p-value |
|---|
| Age (years) | 33.34 (14.01) | 40.46 (15.31) | 0.0101 |
| Male sex | 60 (74.07%) | 23 (53.49%) | 0.02 |
| Baseline BAFF levels | 2668.78 (1876.35) | 2212.77 (1855.03) | 0.2 |
| Baseline APRIL levels | 111.27 (151.14) | 113.37 (145.07) | 0.9 |
| Baseline CRP levels | 0.12 (0.06) | 0.12 (0.04) | 0.8 |
| Baseline ferritin levels | 175.26 (179.06) | 182.16 (198.3) | 0.8 |
Depicting various cytokines level after completion of IP.
| Characteristics | Baseline levels in sputum positive cases | Baseline levels in sputum negative cases | p-value | At the end of IP in sputum positive cases | At the end of IP in sputum negative cases | p-value |
|---|
| BAFF levels | 2668.78 (1876.35) | 2212.77 (1855.03) | 0.19 | 2613.19 (2079.6) | 2074.2 (1987.2) | 0.094 |
| APRIL levels | 111.27 (151.14) | 113.37 (145.07) | 0.9 | 104.81 (95.7) | 158.56 (163.02) | 0.046 |
| CRP levels | 0.12 (0.06) | 0.12 (0.04) | 0.8 | 0.11 (0.06) | 0.10 (0.06) | 0.53 |
| Ferritin levels | 175.26 (179.06) | 182.16 (198.3) | 0.8 | 192.57 (234.87) | 245.1 (292.4) | 0.85 |
Comparison of pre and post IP BAFF and APRIL levels.
| At baseline-sputum positive cases | Post IP-sputum positive cases | At baseline-sputum negative cases | Post IP-sputum negative cases |
|---|
| BAFF 2668.78 (1876.35) | 2613.19 (2079.6) | 2212.77 (1855.03) | 2074.2(1987.2) |
| APRIL 111.27 (151.14) | 104.81 (95.7) | 113.37 (145.07) | 158.56 (163.02) |
| p=0.3596 | p=0.6576 |
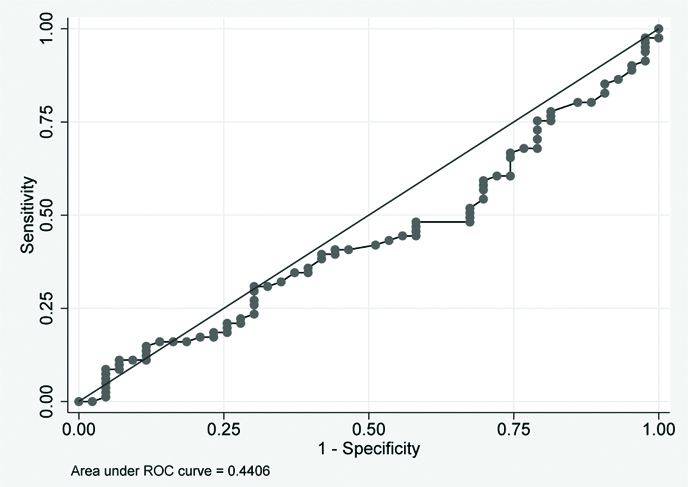
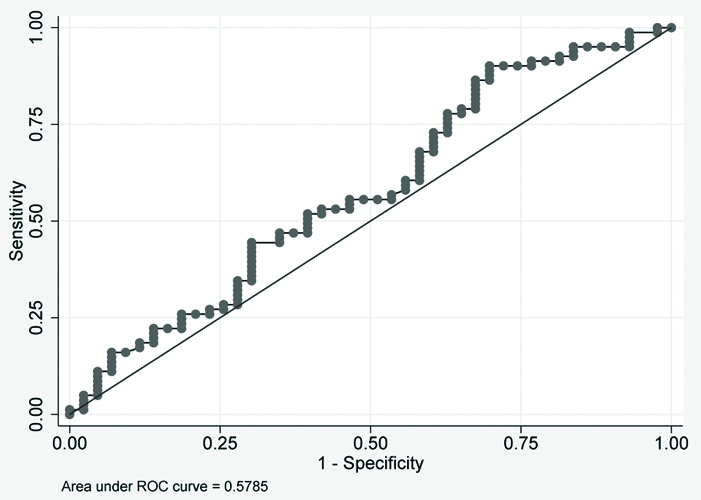
ROC plot for baseline values of BAFF and APRIL for group 2 subjects. There was no significant area under the curve. Details are depicted in [Table/Fig-6,7]. ROC curve for sputum conversion cases cannot be made as 100% of patients were converted to sputum negative group at two months [Table/Fig-8].
Box plot showing details of change in weight in two groups.
ROC plot for baseline values of APRIL in two groups.
ROC plot for baseline values of BAFF in two groups.
The unadjusted and adjusted (age and sex) odds ratio for both the group after IP for BAFF/APRIL levels in respective study groups was not statistically significant. Hierarchical modeling was done for repeated measurements (0, 01 and 02 months) and it did not show any statistically significant correlation between sputum conversion, and change in levels of BAFF, APRIL, ferritin and CRP and weight gain.
Discussion
There have been varied results with cytokines estimation in various studies with variable sample size, protocols and genetic background, protocol used and the sample size [4,5]. Various studies have recommended cytokines as biomarkers for treatment response and early identification of fast and slow responders to anti-TB treatment [6,7].
Mihret A et al., analysed 33 TB patients (17 HIV negative and 16 HIV positive) and found statistically significant differences in median plasma concentrations of Endothelial Growth Factor (EGF), fractalkine, Interferon Gamma (IFN), Interleukin-4 (IL-4), MCP-3 (Monocyte Chemo-Attractant Protein) and IP-10 (induced protein) between contacts and TB patients. He also demonstrated that none of these markers were able to differentiate Quantiferon Test (QFT) positive and QFT negative individuals. Moreover, it was found that the plasma level of IFN-γ, IL-4, MCP-3, MIP-1b (Macrophage Inflammatory Protein) and IP-10 changed significantly during ATT. This study concluded that cytokines can be used for diagnosing and monitoring TB [8].
Clifford V et al., evaluated MTb antigen-stimulated cytokine biomarker responses which identified that some of these biomarkers, specifically IL-1ra, IL-10 and TNF-α, were also significantly higher in active TB than latent TB. IL-2 is the most sensitive and specific marker of TB infection. However, IL-2 responses did not differ significantly between participants with active TB and those with Latent Tuberculosis Infection (LTBI), suggesting that this cytokine lacks the ability to discriminate between infection states [9].
Studies have also reported that TNF-α responses were increased in active TB compared to LTBI [10-12] while one found that TNF-α response was decreased and some other found no significant difference [13,14]. In addition, IL-1ra, IL-10 and TNF-α responses are significantly higher in individuals with active TB than in those with LTBI, although there was a degree of overlap between the two groups [8].
CD4+ T cell-mediated immune responses play pivotal roles in controlling the growth of MTb and maintaining the homeostasis of the host. IFN-c is a cytokine that strongly promotes the T helper 1 (Th1) cell response, and it has also been demonstrated to act as a protective factor against TB in human and animal studies. The IFN-c release assay is widely used in helping to diagnose MTb infection. However, its clinic use is limited as IFN-c release assay fails to distinguish between LTBI and active TB [15].
BAFF and APRIL are two important mediators of B cells [16], and also affect the survival and activation of T cells. In particular, BAFF also promotes the Th1 response [17]. Certain cytokines, such as IFN-c, IL-10 and IFN-a, can induce various cells to augment BAFF production. However, IL-4 can inhibit BAFF expression [18]. Liu K et al., found higher levels of BAFF and APRIL in active disease but not in LTBI. Similar changes in cytokines were also noted by the auhor in pleural fluid and other extrapulmonary specimens. This implicates a potential use for the combination of BAFF and/or APRIL with IFN-c in the diagnosis of TB and distinguishing between active TB and LTBI [19]. In this study combination of APRIL and BAFF estimations was used and compared with non-specific inflammatory markers like CRP and ferritin. However, no such strong expressions of BAFF and APRIL could be detected. No other study was conducted where sputum postive PTB group was compared directly with sputum negative group, as shown in this study.
Limitation(s)
Due to availability of CBNNAT the sputum detection rates were much higher; as a result, very few cases were started on ATT in the absence of CBNNAT positivity.
Conclusion(s)
Assisting response to ATT and deciding on a switch from IP to Continuation Phase (CP) of ATT is a challenge especially in extra pulmonary and disseminated tuberculosis. This study looked at utility of two specific cytokines BAFF and APRIL as biomarkers of treatment response in TB. There was no significant difference in the levels of these cytokines (BAFF and APRIL) before and after IP of ATT. Probably, their utility lies more in distinguishing between active TB and LTBI.