Central nervous system (CNS) tumours show differences between adults and children in variable aspects. Predominance of tumours differ in adults and children, fewer Primitive Neuroectodermal Tumours (PNET) (medulloblastoma) are seen in adults whereas fewer meningiomas (tumours of brain ‘covering’, the meninges) are seen in children. Incidence of histologic types like Astrocytomas/gliomas differs from adults and children. Among all CNS tumours, Gliomas are most common in adults comprising 44% whereas Juvenile pilocytic astrocytomas are most common in children comprising 19%. CNS tumours vary by anatomical site also. Adult tumours are more commonly seen in supratentorial region whereas paediatric tumours are more commonly seen in infratentorial region. Proportion of adult CNS tumours is less than 2% of all cancers whereas Paediatric tumours consist of 20% of all cancers [1].
Tumours like Medulloblastoma, Pilocytic astrocytoma, Ependymoma, Choroid plexus tumours, Teratoma are most commonly seen in the age group of 0-3 years in ascending order. Tumours like Pilocytic astrocytoma, Medulloblastoma, Ependymoma, Astrocytoma, Choroid plexus tumour are most commonly seen in the age group of 3-15 years. Meningiomas and Glial tumours like glioblastomas are most common adult tumours [2].
Adult CNS tumours are most commonly distributed in the supratentorial structures such as cerebral lobes (Frontal, Parietal, Temporal and Occipital lobes), deep nuclei of basal ganglia, thalamus and hypothalamus. Paediatric CNS tumours are most commonly distributed in the infratentorial structures such as cerebellum, brain stem, pons, medulla and posterior fossa [3].
Paediatric brain and spinal cord tumours are a heterogeneous group of neoplasms. They show variability in their cell of origin, grading, treatment strategies and clinical outcomes. Brain tumours are the second most common type of paediatric tumours after haematological malignancies and comprise about 20% of all childhood cancers under 15 years of age [4].
Diffuse Astrocytomas, Oligodendrogliomas and metastatic carcinoma account for most cerebral hemispheric tumours particularly in adulthood. Pilocytic astrocytomas, commonly occur in younger people and show predilection for the cerebellum, whereas Ependymomas are seen frequently in the fourth ventricles of children and the spinal cords of adults. Primary CNS lymphomas, seen in elderly, are seen in the basal ganglia. Myxopapillary ependymomas and CNS paragangliomas are most commonly seen in conus medullaris. Central neurocytomas are most commonly seen to be arising within lateral ventricles whereas Germ cell tumours exceptionally arise outside the midline [2].
There are few epidemiological studies of brain and spinal cord tumours from India [5-9]. In India, exact tumour burden is underestimated due to lack of complete registration of newly diagnosed cases. Assessment of geographic differences in their molecular and genetic profiles requires Hospital-based prevalence data. In India, with recent improvement in overall healthcare scenario and diagnostic facilities in particular, the incidence of CNS tumours seem to be on the rise and are the centre of focus among neuro-oncologists.
Population-based studies play a major role to determine the cancer burden in paediatric CNS malignancies. This study is an attempt to map the epidemiological, clinicopathological, histologic profile of paediatric brain and spinal cord tumours in India. There are very limited studies reported from India which describes the prevalence of paediatric brain and spinal cord tumours and none reported from in and around Rayalaseema region.
Materials and Methods
The study was a Retrospective, observational study which was undertaken at the Department of Pathology, Sri Venkateswara Institute of medical Sciences, Tirupati, Andhra Pradesh, India. It’s a 25-years study from January 1993 to December 2017. The study was conducted after obtaining the approval from the hospital ethics committee (IEC no.-710/2.4.18). Data were collected regarding the frequencies of primary brain and spinal cord tumours (diagnosed according to world health organisation (WHO) classification) in a total of 151 paediatric patients (comprised of all children <18 years of age) from medical records in the tertiary centre.
All the children <18 years of age, who were operated for brain tumours during the study period i.e., from January 1993 to December 2017 were included in the study. Data regarding epidemiological findings, clinical details and the histopathological report was retrieved from the Hospital Information System. Patients with non-neoplastic lesions, vascular tumours and metastatic tumours were excluded. Study includes only patients with the proven histopathological diagnosis. The locations, histological types, patient demographics including age and sex were recorded in the study.
Statistical Analysis
Data regarding age, gender, site of the tumour and histological diagnosis were collected, stored and analysed in Microsoft Excel 2007 spread sheet (Microsoft Corp, Redmond, WA). As the study is an observational study, no particular statistics were considered.
Results
Over a period of 25 years, a total of 1759 CNS lesions were reported. Among these paediatric brain lesions were 241, of which 90 were non-neoplastic cystic lesions (arachnoid cysts, epidermoid cysts and colloid cysts), space occupying lesion of infectious aetiology and vascular malformation were excluded from the study and 151 were neoplastic. Among neoplastic lesions, 4 were metastatic and the remaining 147 were primary brain tumours. So, the study comprised of a total of 147 cases. These included 112 brain and 35 spinal cord tumours. The mean age for primary paediatric brain tumour was 11.08 years (range 2-17 years) with a standard deviation of 4.42. Male: female ratio was 1.15:1 (Male 61, Female 51). The mean age for primary paediatric spinal cord tumour was 10.97 years (range 1 month- 17 years) with standard deviation of 5.17. Male: female ratio was 0.9:1 (Male 17, Female 18) [Table/Fig-1].
Age and gender distribution among paediatric brain and spinal cord tumours.
| Location | Mean age in years (SD) | Male: Female |
|---|
| Brain | 11.08 (4.42) | 1.15:1 |
| Spinal cord | 10.97 (5.17) | 0.9:1 |
| Combined | 11.06 (4.61) | 1.1:1 |
SD- Standard deviation
The most common location of brain tumours was cerebrum 85 (75.8%) in supratentorial region followed by cerebellum 19 (16.9%) in infratentorial region. The most common location of spinal cord tumours was cervical spine 29 (82.8%) [Table/Fig-2].
Anatomical locations of different tumours.
| Anatomical location | Number of tumours (%) |
|---|
| Brain |
|---|
| Supratentorial |
| Cerebrum | 85 (75.8%) |
| Ventricles | 2 (1.7%) |
| Sellar region | 3 (2.6%) |
| Cranial nerves | 0 |
| Infratentorial |
| Cerebellum | 19 (16.9%) |
| Ventricles | 3 (8.5%) |
| Spinal cord |
| Cervical | 29 (82.8%) |
| Thoracic | 2 (5.7%) |
| Lumbar | 2 (5.7%) |
| Lumbosacral | 2 (5.7%) |
| Sacral | 0 |
The cases were subdivided into three age groups 0-5 years, 6-10 years, and 11-18 years. Among brain tumours there was male pre-dominance in all three age groups (i.e., 0-5, 6-10 and 11-18 years), among spinal cord tumours male predominance was noted in 0-5 and 6-10 years of age group, whereas in 11-18 years age group female predominance was noted [Table/Fig-3].
Gender distribution within different age groups and location.
| Location | Age (Years) |
|---|
| 0-5 | 6-10 | 11-18 |
|---|
| Male | Female | Male | Female | Male | Female |
|---|
| Brain | 13 (62%) | 08 (38%) | 16 (53.3%) | 14 (46.7%) | 32 (52.4%) | 29 (45.8%) |
| Spinal cord | 06 (75%) | 02 (25%) | 05 (62.5%) | 03 (37.5%) | 06 (31.5%) | 13 (68.5%) |
| Total | 19 (65.5%) | 10 (34.5%) | 21 (55.2%) | 17 (44.8%) | 38 (47.5%) | 42 (52.5%) |
On analysis of brain tumours, highest number of patients i.e., 61 (54.4%) were in 11-18 years age group, followed by 30 patients (26.7%) in 6-10 years age group and 21 patients (18.7%) in 0-5 years age group.
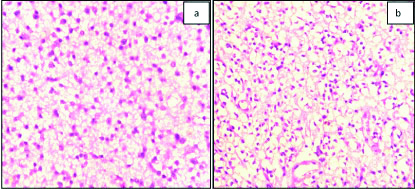
Morphologic features of the commonest brain and spinal cord tumours were briefed [Table/Fig-4a,b,c,d,5a,b,c,d]. Histologically the most common brain tumours in descending order being Astrocytoma 42 (37.5%), Embryonal tumours 24 (21.4%) and Meningiomas 16 (14.3%) [Table/Fig-6,7]. As per age group, Astrocytoma was the predominant histologic type in 6-10 years age group with 11 (45.8%) cases and 28 (39.4%) cases in 11-18 years age group. Embryonal tumours 8 (47.1%) were the most common histological type in 0-5 years age group [Table/Fig-6]. On analysis of spinal cord tumours, there were 20 cases (57.1%) in 11-18 years group, followed by 7 cases (20%) in 6-10 years group and 8 cases (22.8%) in 0-5 years group.
a) Diffuse astrocytoma (WHO grade II): Photomicrograph showing diffusely arranged monomorphic astrocytes lying over a fibrillary background (H&E x200); b) Oligodendroglioma (WHO grade II): Photomicrograph showing uniform oligodendroglial cells displaying fried egg appearance (H&E x200).
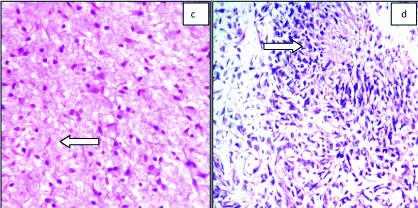
c) Pilocytic astrocytoma (WHO grade I): Photomicrograph showing bipolar cells, Rosenthal fibres (arrow) and Eosinophilic granular bodies (H&E x200); d) Glioblastoma (WHO grade IV): Photomicrograph showing Palisading necrosis (arrow) and pleomorphic cells with hyperchromatic nucleus (H&E x200).
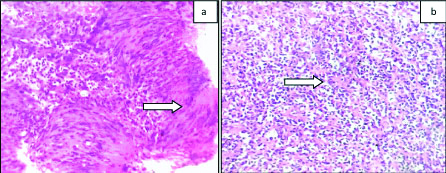
a) Schwannoma (WHO grade I): Photomicrograph showing Verrocay bodies (arrow) (H&E x200); b) Medulloblastoma (WHO grade IV): Photomicrograph showing Rosettes (arrow) with central neuropil (H&E x200).
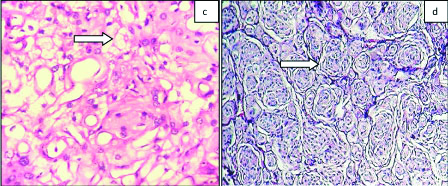
c) Haemangioblastoma (WHO grade I): Photomicrograph showing variable sized blood vessels and stromal cells (arrow) with bubbly cytoplasm (H&E x200); d) Meningothelial Meningioma (WHO grade I): Photomicrograph showing whorls and meningothelial knots (arrow) (H&E x200).
Percentage of various histologic types of Brain and Spinal cord tumours among different age groups.
| Histological types | No. of cases (%) |
|---|
| Brain tumours | 0-5 years | 6-10 years | 11-18 years | 0-18 years |
|---|
| Astrocytoma | 3 (17.6%) | 11 (45.8%) | 28 (39.4%) | 42 (37.5%) |
| Embryonal tumours | 8 (47.1%) | 5 (20.8%) | 11 (15.5%) | 24 (21.4%) |
| Meningeal tumours | 3 (17.6%) | 4 (16.7%) | 9 (12.6%) | 16 (14.3%) |
| Mesenchymal tumours | 0 | 1 (4.2%) | 11 (15.5%) | 12 (10.7%) |
| Oligodendroglioma | 0 | 3 (12.5%) | 4 (5.6%) | 7 (6.2%) |
| Craniopharyngioma | 1 (5.9%) | 0 | 3 (4.2%) | 4 (3.6%) |
| Choroid plexus tumours | 1 (5.9%) | 0 | 3 (4.2%) | 4 (3.6%) |
| Neuronal tumour | 0 | 0 | 2 (2.8%) | 2 (1.8%) |
| Atypical teratoidrhabdoid tumour | 1 (5.9%) | 0 | 0 | 1 (0.9%) |
| Total | 17 (15.2%) | 24 (21.4%) | 71 (63.4%) | 112 (100%) |
| Spinal cord tumours |
| Nerve sheath tumours | 2 (25%) | 1 (14.2%) | 10 (50%) | 13 (37.1%) |
| Ependymal tumours | 4 (50%) | 2 (28.5%) | 4 (20%) | 10 (28.5%) |
| Embryonal tumours | 2 (25%) | 2 (28.5%) | 4 (20%) | 8 (22.8%) |
| Mesenchymal tumours | 0 | 2 (28.5%) | 2 (10%) | 4 (11.4%) |
| Total | 8 (22.8%) | 7 (20%) | 20 (57.1%) | 35 (100%) |
Mesenchymal tumours include Haemangioblastoma, Cavernous angioma, Neurofibrolipoma, Haemangioma, papillary angioendothelioma
Percentage of various subtypes of paediatric CNS gliomas.
| Tumour | No. of cases (%) |
|---|
| Astrocytoma Grade I (SEGA+Pilocytic) | 15 (19.2) |
| Astrocytoma Grade II (PXA+diffuse) | 26 (33.3) |
| Anaplastic Astrocytoma Grade III | 1 (1.2) |
| Astrocytoma Grade IV (GBM) | 15 (19.2) |
| Oligodendroglioma Grade II | 4 (5.12) |
| Anaplastic Oligodendroglioma Grade III | 1 (1.2) |
| Oligoastrocytoma Grade II | 3 (3.8) |
| Anaplastic Oligoastrocytoma Grade III | 1 (1.2) |
| Ependymoma Grade II | 10 (12.8) |
| Anaplastic ependymoma Grade III | 2 (2.5) |
| Total | 78 (100%) |
The common spinal cord tumours in descending order being Nerve sheath tumours 13 cases (37.1%), Ependymal tumours 10 cases (28.5%) and Embryonal tumours 8 cases (22.8%). As per age group, Nerve sheath tumours were the most common in 11-18 years age group with 10 cases (50%), in 6-10 years age group 2 (28.5%) cases each of Ependymal tumours, Embryonal tumours and Mesenchymal tumours were seen and in 0-5 years age group, Ependymal tumours were most common with 4 cases (50%) [Table/Fig-6].
Analysing grading of glial tumours, Grade II Astrocytoma was most common followed by equal frequency of low grade (i.e., Grade I) Astrocytoma (including SEGA and Pilocytic Astrocytoma) and Grade IV Glioma i.e., Glioblastoma [Table/Fig-7].
Discussion
Children constitute a large part of population in a developing country where life expectancy is lower than in the developed world [10,11]. Multiple variations are observed in histological, topographical, and gender distribution of paediatric brain and spinal cord tumours. CNS tumours are the most common solid tumours in children [12,13].
In this retrospective study 147 cases of primary paediatric CNS tumours were reviewed in the last 25 years. The male:female ratio is 1.1:1 which is comparable to the study by Shah HC et al., and Kaatsch P et al., and Makino K et al., [9,14,15]. Male predominance in India may be the result of cultural factors as they get more attention and are brought for hospital care more often [16]. In current study, female predominance is noted in 11-18 years age group among spinal cord tumours which are comparable to the study done by Madhavan R et al., where female predominance is found in 0-5 and 11-18 years of age groups [7]. As the tumour biology accounts for these gender disparity further studies are necessary for elaborating the role of sex hormones on brain tumourigenesis [17].
The mean age of paediatric brain tumours in this study was 11.06 years which is higher than that observed in the study by Nasir S et al., (6.7 years) and Mehrazin M and Yavari P (8.7 years) [18,19]. Although all the tumours occur at any age, second decade (10-18 years) is the peak age of incidence in this study, whereas in Ahmed N et al., study more children were in the second hemi decade of life (i.e., 5-10 years) [20]. The peak age of brain tumours was 15 years in our study which is higher than study done by Smoll NR and Drummond KJ. Higher peak of age is observed at age 4 years and a second peak at age 7 years followed by a steady decline [21]. On comparison of location with other international and Indian studies supratentorial and infratentorial tumours were nearly of equal percentage in studies done by Kaatsch P et al., and Ogun GO et al., [14,22]; whereas Madhavan R et al., and Shah HC et al., found higher percentage of supratentorial tumours which is similar to the present study [7,9]. Studies done by Shirazi N et al., and Ahmed N et al., found higher percentage of infratentorial tumours [Table/Fig-8,9] [8,20].
Comparison with International Studies.
| Study (Year) | Country | Total no. of cases | Relative frequency of four commonest CNS tumours | Mean age (yrs) | M:F | Supra-tentorial (%) | Infra-tentorial (%) |
|---|
| | | 1 | 2 | 3 | 4 | | | | |
|---|
| Kaatsch P et al., [14] (2001) | Germany | 3268** | Astrocytic tumours (41.7%) | MB (18.1%) | Ependymoma (10%) | PNET (6.4%) | 10.7 | 1.2:1 | 46.2 | 48.3 |
| Makino K et al., [15] (2010) | Japan | 210 | Astrocytic tumours (35.7%) | Germ cell tumours (14.3%) | Craniophar-ngioma (10.5%) | MB (10.0%) | NS | 1.3:1 | NS | NS |
| Ahmed N et al., [20] (2007) | Pakistan | 81 | Low grade astrocytomas (I/II) (26.4%) | MB (10.6%) | Anaplastic Astrocytoma/Glioblastoma Multiforme (7.1%) | Ependym-oma (7.0%) | 8.8 | 2.5:1 | 33.3 | 66.7 |
| Ogun GO et al., [22] (2016) | Nigeria | 77 | Astrocytic tumours (30.5%) | Craniophar-yngioma (18.5%) | MB (14.6%) | Germ cell tumours (7.8%) | 7.2 | 1.3:1 | 49.4 | 50.6 |
| Current study (2019) | India | 147 | Astrocytoma (37.5%) | Nerve sheath tumours (37.1%) | Embryonal tumours (21.4%) | Meningioma (14.3%) | 11.06 | 1.1:1 | 61.2 | 38.8 |
NS: Not stated; MB: Medulloblastoma; PNET: Primitive neurectodermal tumour; **Spinal Cord and meningeal tumours not included
Comparison with other Indian studies.
| Study | Institution | Total no. of cases | Relative frequency of four commonest CNS tumours | Mean age | M:F | Supra-tentorial (%) | Infra-tentorial (%) |
|---|
| | | 1 | 2 | 3 | 4 | | | | |
|---|
| Jain A et al., [5] (2011) | AIIMS, New Delhi (Multi-institutional study) | 3,936 | Astrocytic tumours (34.7%) | MB and PNET (22.4%) | Craniopharyngioma (10.2%) | Ependymal tumours (9.8%) | NS | NS | NS | NS |
| Das U et al., [6] (2014) | Kidwai Memorial institute of Oncology, Bangalore | 341 | MB* | Astrocytic tumours and Ependymal tumours* | Gliomas* | PNET* | NS | 1.5:1 | NS | NS |
| Madhavan R et al., [7] (2016) | Madras Medical College, Chennai | 250 | Astrocytic tumours (52%) | MB (21.6%) | Ependymoma (10.4%) | Oligodendr-oglioma (6%) | NS | NS | 52 | 48 |
| Shirazi N et al., [8] (2017) | Himalayan Institute of Medical Sciences, Dehradun | 67 | MB (20.3%) PNET/ES (30.7%) in spinal cord | Pilocytic astrocytoma (16.6%) in brain Ependymoma (23%) in spinal cord | Glioblastoma (9.2%) | Ependymoma (7.0%) | 11.3 | 1.3:1 | 33.3 | 66.7 |
| Shah HC et al., [9] (2015) | B.J. Medical college and Civil Hospital, Ahmedabad | 76 | Astrocytomas (40.8%) | Embryonal tumours (29.0%) | Craniopharyngioma (11.8%) | Ependymoma (6.6%) | 10.6 | 1.2:1 | 52.6 | 47.4 |
| Current study (2019) | SVIMS, Tirupati. | 147 | Astrocytoma (37.5%) | Nerve sheath tumours (37.1%) | Embryonal tumours (21.4%) | Meningioma (14.3%) | 11.06 | 1.1:1 | 61.2 | 38.8 |
NS: Not stated; MB: Medulloblastoma; PNET: Primitive Neurectodermal tumour; * Percentage not mentioned
Astrocytoma was the most common neoplasm in this study similar to Western study by Keith HM et al., [23]. In contrast, the study by Nasir S et al., and Smoll NR and Drummond KJ, found Medulloblastomas to be the commonest paediatric brain tumour [18,21]. Increased incidence of Astrocytoma has also been reported from other Middle Eastern countries including Kuwait and Iran [19,24,25].
Craniopharyngiomas (14%) were the most common tumours in the study done by Aghayan Golkashani H et al., [26]. In contrast lesser incidence of Craniopharyngiomas (2.7%) was found in the present study. In studies done by Wilson PE et al., and Zhou D et al., they found an increased incidence of Teratomas (31%) and Ependymomas followed by Astrocytomas respectively in the paediatric spinal cord tumours whereas Schwannoma 12(8.16%) is most common in present study [27,28].
Among Western population Astrocytomas and Medulloblastomas are the two most common brain tumours in children, similar to the present study and various studies from other Asian centres. In the present study mesenchymal tumours are the forth most common brain tumour.
Craniopharyngioma is the third most common tumour as reported from India and also in various Asian studies from Japan, Beijing, Korea [5,15,28,29]. Another interesting finding is that the incidence of Mesenchymal, non-meningothelial tumours which is a rare tumour in most of these studies is quite high in the present study (12.2%). The reason could be that the present authors have included many tumours like cavernoma, haemangioma, neurofibrolipoma and haemangioblastoma under this category.
Limitation(s)
Sample size was not adequate because limited number of cases were received from paediatric department in contrast to Neurosurgery department.
Conclusion(s)
In this retrospective 25-year review in a tertiary centre, demographics of primary paediatrics CNS Tumours from a Tertiary Care Institute were described and it provides valuable data from Rayalseema region of Southern India. One of the prominent and contrasting findings of this study compared to previously published studies in the literature is the predominance of the supratentorial location of the tumours. The present study provides regional statistical analysis and adds to the overall national statistics.
SD- Standard deviation
Mesenchymal tumours include Haemangioblastoma, Cavernous angioma, Neurofibrolipoma, Haemangioma, papillary angioendothelioma
NS: Not stated; MB: Medulloblastoma; PNET: Primitive neurectodermal tumour; **Spinal Cord and meningeal tumours not included
NS: Not stated; MB: Medulloblastoma; PNET: Primitive Neurectodermal tumour; * Percentage not mentioned