Spatio-temporal Analysis of Dengue Fever Cases: A Retrospective Study
M Siva Durga Prasad Nayak1, KA Narayan2
1 Tutor, Department of Community Medicine, Government Medical College, Ongole, Andhra Pradesh, India.
2 Professor, Department of Community Medicine, Mahatma Gandhi Medical College and Research Institute, Pondicherry, India.
NAME, ADDRESS, E-MAIL ID OF THE CORRESPONDING AUTHOR: M Siva Durga Prasad Nayak, Falt No. 402, Sai Paanya Residency, Near Saibaba Temple, Santhapeta, Ongole-523001, Prakasham District, Andhra Pradesh, India.
E-mail: sivadurgaprasadnayak@gmail.com
Introduction
In India, during the last ten years, the dengue fever increased in incidence and in territorial extent. Several studies already described the dengue fever incidence in terms of time, place and person But in spatio-temporal analysis, space and time will be analysed together to identify the high priority areas and during which time period there is chance for occurrence of outbreaks in these high priority districts.
Aim
To identify the districts with high log likelihood ratio for high dengue fever incidence.
Materials and Methods
The current study design was a retrospective observational study conducted using the secondary data provided by Director of Public Health of Kerala state on a public domain. All the suspected dengue fever cases reported for a period of six months from 1st May 2017 to 4th November 2017 was used for the study. Weekly incidence rates of dengue fever cases and moving averages of dengue fever cases were calculated using MS Excel software. Retrospective spatio-temporal analysis was done with SaT Scan software using discrete poisson model.
Results
Total number of dengue fever cases reported was 52371. The incidence of dengue fever rose from May 1-7 to June 26-July 02 and later showed declining trend. Moving averages graph of actual data shows peaks and troughs with an approximate 7 day pattern and the troughs coincided with public holidays. Spatio-temporal analysis revealed that, ten districts out of fourteen districts were identified having significantly (p<0.005) high relative risk and high likelihood ratio for dengue fever cases.
Conclusion
Epidemic of dengue fever cases will start in the month of May, reaches peak in June and July, declines thereafter and reaches to normal by September. Time series analysis revealed the lacunae in surveillance system. Spatio-temporal analysis identified ten high priority districts out of which top four are in south Kerala.
Disease mapping, Discrete poisson model, Relative risk
Introduction
Dengue Fever (DF) is one of the emerging communicable disease causing major public health threat all over the world [1]. The disease is caused by single-stranded positive polarity Ribonucleic Acid (RNA) viruses of the family Flaviviridae which is transmitted mainly by the bite of Aedesaegypti mosquito and or also through Aedesalbopictus [1,2]. The burden of dengue fever incidence is not in uniform pattern in all the geographical areas and also in every season [3]. Many studies already proved the association between the burden of DF and meteorological factors such as rain fall, temperature, humidity in the atmosphere. Rainy season is the most favourable season for dengue fever outbreaks [4-6]. Population density in a particular geographical area, also influence the incidence of dengue fever. More number of cases reported from urban areas where population density is more when compared to rural areas [7].
In India, during the last ten years, the incidence of the dengue fever increased in territorial extent [8]. Now every year, all states in India are reporting dengue fever outbreaks. Among all the states in India, Kerala is one of the high risk state reporting highest numbers every year [8]. The geographical conditions and meteorological factors in Kerala state are more favourable for high incidence of dengue fever cases. Information about the incidence of suspected and lab confirmed cases of dengue fever will be collected through a surveillance system [9]. Detailed information about when and where DF/Dengue Haemorrhagic Fever (DHF) outbreaks occurred in the past can be a useful guide to the potential magnitude and severity of future epidemics.
Integrated disease surveillance program is daily collecting information about the communicable and non-communicable diseases from each and every village in the country. This provides the day and district wise reports of communicable diseases incident [10]. But these reports contain only the number of cases. These numbers can be converted into useful indicators and significant inferences regarding the risk factors can be concluded through different statistical analysis techniques. Different epidemiological studies can be conducted to understand the burden, trend of the disease and to identify the high risk districts for future dengue fever outbreaks [10].
Daily incidence can be summed up to calculate weekly incidence rates in the state which is better indicator to understand the burden of disease. Moving averages is one of the techniques in time series analysis to understand the trend and forecast the disease burden [11]. Weekly incidence or trend of the disease is not in uniform pattern in all the districts in the same state. Some districts report more number of cases at one point of time and some districts report high number of cases at another point of time. Spatio-temporal analysis is a useful technique to understand the impact of space and time on the incidence of dengue fever. This also helps in identifying the high risk districts of dengue fever out breaks and in which time period [12].
Describing the burden of disease in terms of time, place and person is the key in the descriptive epidemiological studies. Several studies already described the dengue fever incidence in terms of time, place and person [13]. But in spatio-temporal analysis, space and time will be analysed together to identify the high priority areas. This identifies during which time period there is chance for occurrence of outbreaks in these high priority districts.
Literature search in pubmed and google scholar with keywords “Dengue fever” and “Spatio-temporal analysis” and “India” revealed that, very few studies used spatio-temporal analysis techniques to understand the burden of dengue fever incidence in India. This is true in Kerala also. Based on this background, the current study was conducted with an aim to identify high risk districts for dengue fever incidence in Kerala state and the time period during which the population of this state are at its high risk using the spatio-temporal analysis technique.
Materials and Methods
The current study design was a retrospective observational study conducted using the secondary data of Kerala State extracted from diverse sources. The current study is purely based on secondary data available on public domain and does not involve any human beings in the research.
Director of Public Health of Kerala state (http://dhs.kerala.gov.in/index.php/publichealth) is providing daily reports of district wise distribution of communicable diseases for the state on a public domain [9]. Every year, the incidence of dengue fever in the state rises from the month of May and declines to normal level at the end of October [14]. The daily reports of communicable diseases for a period of six months from 1st May 2017 to 4th November 2017 were downloaded. The data of dengue fever cases was extracted from the downloaded files. All the suspected dengue fever cases reported in the Kerala state were considered for the study. Data did not consist of any personal information. It is a cumulative secondary data provided freely on government website. The District wise population data of Kerala state was collected from census 2011 [15]. Shape file of Kerala state having district borders was downloaded from http://www.gadm.org website [16].
According to census 2011 Kerala state population was 33406061 and population growth rate was 4.91% [15]. Population was standardised for the year 2017 using the population growth rate of the state. Based on these values estimated population in Kerala during the year 2017 was calculated as 34390204. Weekly incidence rates of dengue fever cases were calculated using the estimated population. In the same way, population in each district was also estimated for the year 2017 and used for spatio-temporal analysis. A moving average is a technique often used in technical analysis that smooths incidence history by averaging daily incidence over some period of time. This analysis is commonly used to smooth out short-term fluctuations and highlight longer-term trends or cycles [17].
Statistical Analysis
Moving averages of dengue fever incidence were calculated using Ms Excel software to observe the trend of dengue fever incidence during the epidemic period.
Retrospective spatio-temporal analysis was done with SaT Scan software using discrete poisson model, to identify the districts with high log likelihood ratio for high dengue fever incidence [18]. Log likelihood ratio was used to identify the districts which are most likely to have high incidence of dengue fever cases when compared to others [19]. All the districts have equal chances of having high number dengue fever cases was considered as null hypothesis. Null hypothesis was tested using SaTscan software and p-value less than 0.05 was considered as statistically significant to accept or reject null hypothesis. The software, scanned for areas of 30 km radius with high rates of dengue fever cases per day taken into consideration as 25 percent of population living in that area are at risk of disease. [Table/Fig-1] depicts the parameter settings used for spatio-temporal analysis.
Parameter settings for spatio-temporal analysis.
| Parameters | Analysis |
|---|
| Study period | 2017/05/01 to 2017/11/04 |
| Number of districts | 14 |
| Total number of cases | 52371 |
| Type of analysis | Retrospective space-time |
| Probability model | Discrete poisson |
| Scan for areas with | High rates |
| Time aggregation units | Day |
| Time aggregation length | 1 |
| Maximum spatial cluster size | 25 percent of population at risk |
| Maximum spatial cluster size | 30 km |
| Include purely temporal clusters | No |
| Window shape | Circular |
| Minimum temporal cluster size | 7 days |
| Maximum temporal cluster size 30 days | 30 days |
| Include purely spatial clusters number | No |
| Temporal adjustment | Log linear with automatically calculated trend |
| Adjust for weekly trends | Log likely hood ratios were measured with automatically calculated trend adjusted for weekly trends |
Results
Incidence Rates
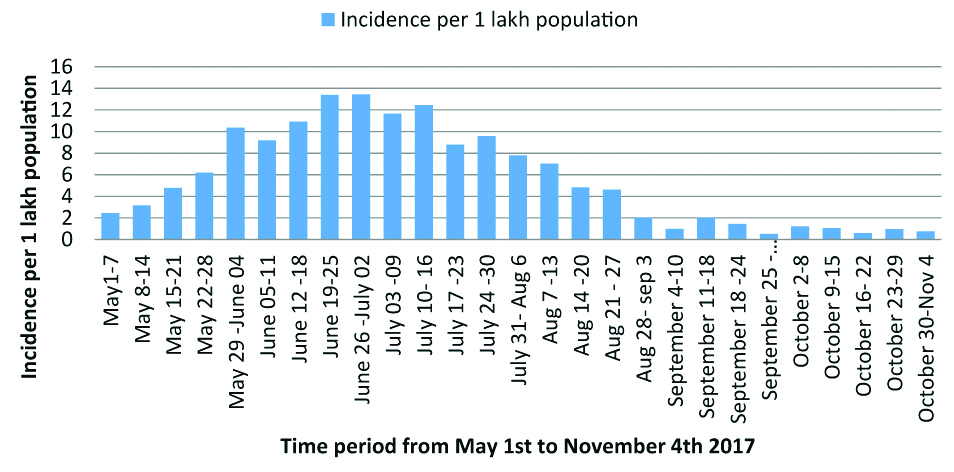
Total number of suspected dengue fever cases reported during the study period was 52371 with an incidence rate 152 per one lac population. Weekly incidence rates of dengue fever cases during the period from 1st May 2017 to 4th November 2017 were calculated and were depicted in [Table/Fig-2]. The incidence of dengue fever rose from May 1-7 to June 26-July 02 and later the incidence showed declining trend up to September 04-10.
Weekly Incidence of dengue fever cases per 1 lac population in Kerala state.
Moving Averages
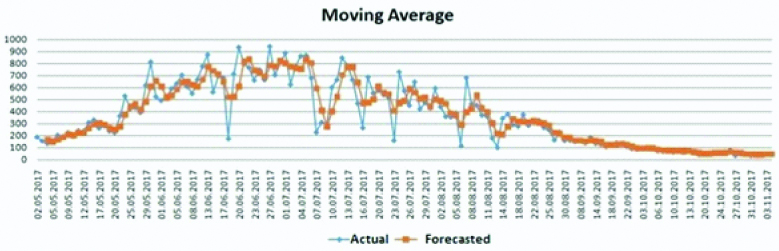
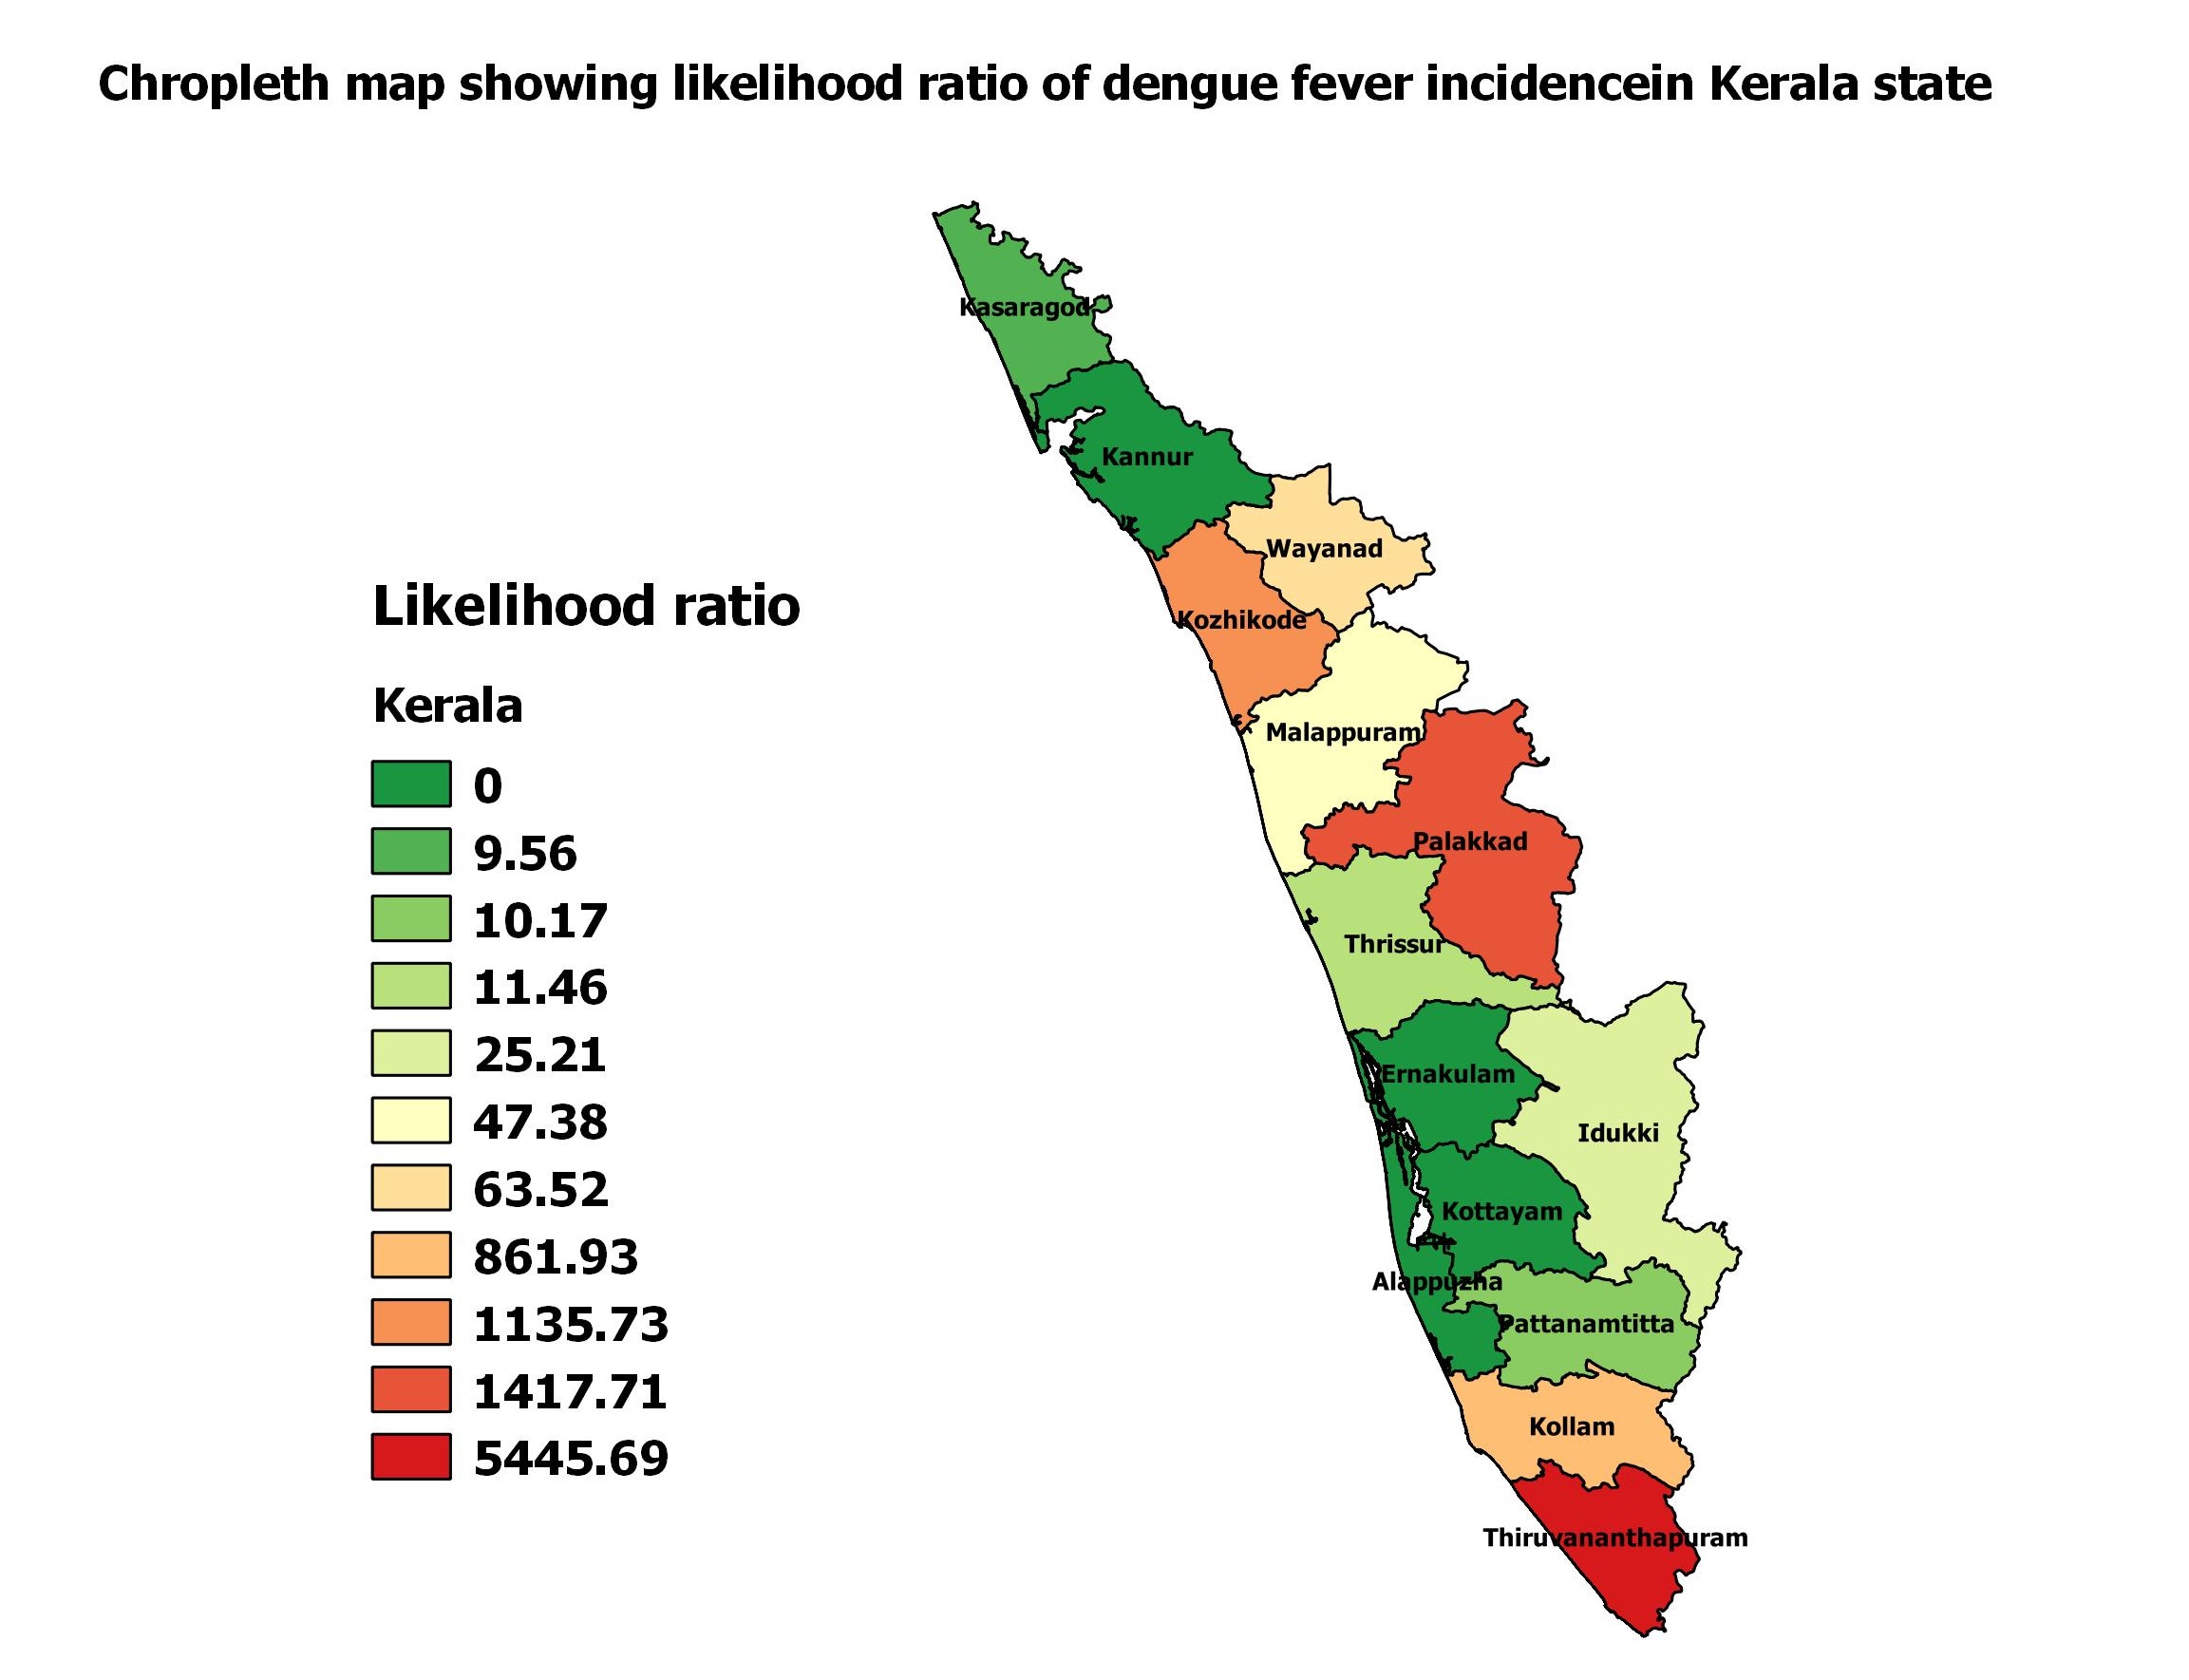
[Table/Fig-3] depicts the daily incidence and moving averages of dengue fever incidence from May 1st 2017 to November 4th 2017. This epidemic pattern of distribution has peak incidence in month of June-July. Log likelihood ratio of various districts in Kerala state in the form of table and choropleth map were depicted in [Table/Fig-4,5]. Thiruvanathapuram, Palakkad, Kozhikode and Kollam were the districts with high log likelihood ratio.
Moving average of dengue fever cases in Kerala state.
Districts of Kerala state having significantly high relative risk and log likelihood ratio.
| District | Relative risk | Log likelihood ratio | p-value | Start_date | End_date |
|---|
| Thiruvananthapuram | 6.37 | 5445.69 | <0.005 | 2017/6/20 | 2017/7/19 |
| Palakkad | 3.40 | 1417.71 | <0.005 | 2017/6/16 | 2017/7/15 |
| Kozhikode | 3.13 | 1135.73 | <0.005 | 2017/6/29 | 2017/7/28 |
| Kollam | 3.13 | 861.93 | <0.005 | 2017/7/12 | 2017/8/10 |
| Wayanad | 1.85 | 63.52 | <0.005 | 2017/6/29 | 2017/7/28 |
| Malappuram | 1.37 | 47.38 | <0.005 | 2017/6/19 | 2017/7/6 |
| Idukki | 1.91 | 25.21 | <0.005 | 2017/6/29 | 2017/7/5 |
| Kasaragod | 1.49 | 9.56 | <0.005 | 2017/6/30 | 2017/7/6 |
| Thrissur | 1.28 | 11.46 | <0.005 | 2017/6/27 | 2017/7/6 |
| Pattanamititta | 1.46 | 10.17 | <0.005 | 2017/6/27 | 2017/7/5 |
Choropleth map of Kerala state showing log likelihood ratio of dengue fever incidence in different districts.
Discussion
Bar diagram showing the weekly incidence of dengue fever cases depicted the epidemic distribution pattern. The incidence gradually rose in the month of May, reached peak in the months of June- July and later declined. These changes might be because of environmental differences. Many studies proved the association between rain fall and the incidence of dengue fever cases [4-6]. Increased number of mosquitoes boost transmission of dengue fever cases from person to person and later on, the burden of dengue fever cases decreases. Rainy season in Kerala state starts from from April and ends by July [14]. Mosquitoes burden increases from the month of May and declines after August. The same was depicted in the current study findings. Thus, administrators should take precautionary measures and anti-mosquito measures at least one month before the peak incidence of dengue fever cases, to control the future burden of disease.
[Table/Fig-2,3] represents the actual number of cases and the average number of cases of the last two data points, i.e., moving averages. The graph of actual data shows peaks and troughs with an approximate seven day pattern. When analysed further the troughs coincided with either the weekly holiday on Sunday or other public holidays. This only indicates the weakness of the reporting system. No epidemiological conclusions should be drawn. In such a situation the moving average provides a better understanding of the trend of the disease.
Surveillance system is the heart of any control program. An efficient surveillance system helps in assessing the impact of controlled measures in the community. Daily monitoring and reporting of dengue fever cases will yield valuable information to the administrators for better planning and preparedness [10]. These reports can be used for temporal analysis to understand the trend of incidence. Moving averages or Time series analysis is one of the temporal analysis techniques to forecast future incidence of diseases. Many researchers already conducted studies in different settings to forecast the dengue fever incidence [11,19]. This technique can be extended to Auto Regressive Integrated Moving Average (ARIMA) analysis based on the availability of the data of dengue fever incidence and its predictors. In the current study, temporal analysis was restricted to moving averages only. Temporal analysis revealed the sharp decline of dengue fever cases on public holidays. It might be because of lack of personnel to send the reports to the higher authorities. The systems should be strengthened to avoid the delay in reporting system. Then only, the actual burden of cases can be assessed.
Retrospective spatio-temporal analysis was used to identify the high-risk districts for dengue fever outbreaks. Relative risk and likelihood ratio of high priority districts can be assessed with spatio-temporal analysis. The relative risk represents commonly occurring disease in this district and time period as compared to the baseline. The estimated risk within the district is divided by the estimated risk outside the district. Setting a value of one is equivalent of not doing any adjustments. A value of greater than one is used to adjust for an increased risk and a value of less than one to adjust for lower risk. A relative risk of zero is used to adjust for missing data for that particular time and location. The null hypothesis is that the trends are the same within the district over a period of time, while the alternative is that they are different. Based on these hypotheses, a likelihood is calculated. [Table/Fig-4] depicts ten districts out of fourteen districts were identified having significantly (p<0.005) high relative risk and high likelihood ratio for dengue fever cases when compared to the other districts.
Although the trend of dengue fever incidence is in uniform pattern throughout the state, the burden of cases differs. Spatio-temporal analysis is useful to identify which districts significantly showed high risk and in which period of time. Spatio-temporal analysis of dengue fever cases is already conducted by several researchers in different settings and the study findings were depicted in [Table/Fig-6] [20-27].
Types of implant used for Internal Distraction Plating in Distal Radius Fractures.
| Author | Study title | Study setting | Result |
|---|
| Valson JS and Soman B [20] | Spatiotemporal clustering of dengue cases in Thiruvananthapuram district, Kerala | Thiruvananthapuram district, Kerala | Spatial and temporal clustering of dengue cases within the district and their association with climatic parameters. |
| Dawn A [21] | A Spatio-Temporal Analysis of Dengue Fever in West Bengal with Special Reference to Kolkata Municipal Corporation Area | Kolkata, West Bengal | Amongst the three administrative divisions, the Presidency division was found to be severely affected by the disease every year with Kolkata at its prime focus. |
| Shil P [22] | Rainfall and dengue occurrences in India during 2010-2016 | India | Rainfall influence the dengue occurrences differently in the northern and the southern states of India. |
| Akter R et al., [23] | Spatial and temporal analysis of dengue infections in Queensland, Australia: Recent trend and perspectives | Queensland, Australia | Clear spatiotemporal trend of recent dengue cases in Queensland, |
| Sedda L et al., [24] | The spatial and temporal scales of local dengue virus transmission in natural settings: a retrospective analysis. Parasit Vectors | Caratinga, in Southeast Brazil. | Strong and significant association between high DENV incidence in mosquitoes and the onset of symptoms in humans at specific spatial and temporal windows. |
| Zhu G et al., [25] | Spatiotemporal analysis of the dengue outbreak in Guangdong Province, China | Guangdong Province, China | Dengue incidence was highly spatial-autocorrelated with the inclination of clustering and nonuniformity |
| Mala S and Jat MK [26] | Geographic information system based spatio-temporal dengue fever cluster analysis and mapping | Delhi, India | Environmental factors in addition to other socio-economic, demographic and physiographic factors are responsible for the change in the trend of DF incidences over the study period |
| Telle O et al., [27] | The Spread of Dengue in an Endemic Urban Milieu-The Case of Delhi, India. | Delhi, India | The size of the dengue case cluster depends on the timing of its emergence emphasises the need for early case detection and implementation of effective mosquito control. |
In the current study, ten districts in Kerala had relative risk more than one. High priority areas were mainly in South Kerala. Among them Thiruvanathapuram and Palakkad had high relative risk during the period from middle of June to Middle of July. In Kozhikode the period of risk is from End of June to End of July. In Kollam the period of risk is from middle of July to middle of August. The remaining six districts had high risk for only a short period of time. This indicates that the epidemic starts in one district and later spreads to the other. This information is vital to administrators to understand where to focus and when to focus on high risk districts. Further spread could be mitigated by initiating prompt action at the start of epidemic period.
In the current study daily reports of six months period was used in which peak incidence of dengue fever cases were reported. It increased the strength of analysis. The data from the Government hospitals may not completely represent actual picture of dengue fever cases in Kerala.
Limitation(s)
The study was conducted using the secondary data of Integrated Disease Surveillance Program (IDSP) reports that available in public domain. Only suspected dengue fever cases were used for analysis which is a limitation of the current study. Quality of data in the reports will limit the study observations. Data of serotype of Dengue fever was not available in the public domain which will enable the researchers to differentiate between distribution of autochthonous and overseas acquired dengue fever cases.
Conclusion(s)
Epidemic of dengue fever cases will start in the month of May, reaches peak in June and July, declines thereafter and reaches to normal by September. Time series analysis revealed the lacunae in surveillance system. Spatio-temporal analysis identified ten high priority districts out of which top four are in south Kerala. Spatio-temporal association of environmental and socio-economic factors such as humidity, temperature, altitude, population density with dengue fever incidence can be understood with similar type of analysis. This can be done by conducting further studies with larger data.
Author Declaration:
Financial or Other Competing Interests: None
Was Ethics Committee Approval obtained for this study? Yes
Was informed consent obtained from the subjects involved in the study? NA
For any images presented appropriate consent has been obtained from the subjects. NA
Plagiarism Checking Methods: [Jain H et al.]
Plagiarism X-checker: Dec 28, 2019
Manual Googling: Feb 20, 2020
iThenticate Software: Mar 30, 2020 (14%)
[1]. A global brief on vector-borne diseases [Internet]. World Health Organization; 2014. Available from: https://apps.who.int/iris/bitstream/handle/10665/111008/WHO_DCO_WHD_2014.1_eng.pdf [Google Scholar]
[2]. Dengue and severe dengue [Internet]. [cited 2019 Apr 13]. Available from: https://www.who.int/news-room/fact-sheets/detail/dengue-and-severe-dengue [Google Scholar]
[3]. Mutheneni SR, Morse AP, Caminade C, Upadhyayula SM, Dengue burden in India: Recent trends and importance of climatic parametersEmerg Microbes Infect 2017 6(1):01-10.10.1038/emi.2017.5728790459 [Google Scholar] [CrossRef] [PubMed]
[4]. Kesetyaningsih TW, Andarini S, Sudarto Pramoedyo H, Determination of environmental factors affecting dengue incidence in Sleman District, Yogyakarta, IndonesiaAfr J Infect Dis 2018 12(1 Suppl):13-25.Published 2018 Mar 710.21010/ajid.v12i1S.329619427 [Google Scholar] [CrossRef] [PubMed]
[5]. Thammapalo S, Chongsuvivatwong V, Geater A, Dueravee M, Environmental factors and incidence of dengue fever and dengue haemorrhagic fever in an urban area, Southern ThailandEpidemiol Infect 2008 136(1):135-43.10.1017/S095026880700812617359563 [Google Scholar] [CrossRef] [PubMed]
[6]. Abinaya R, Velavan A, Anil J, Purty, Murugan N. Assessment of environmental factors associated with dengue spread in an urban area of PuducherryInt J Community Med Public Health 2018 5(7):3020-23.10.18203/2394-6040.ijcmph20182641 [Google Scholar] [CrossRef]
[7]. Schmidt WP, Suzuki M, Dinh Thiem V, White RG, Tsuzuki A, Yoshida LM, Population density, water supply, and the risk of dengue fever in Vietnam: Cohort study and spatial analysisPLOS Medicine 2011 8(8):e100108210.1371/journal.pmed.100108221918642 [Google Scholar] [CrossRef] [PubMed]
[8]. Nationwide data on outbreak-Today’s Paper-The Hindu [Internet]. [cited 2019 Apr 13]. Available from: https://www.thehindu.com/todays-paper/nationwide-data-on-outbreak/article3058678.ece [Google Scholar]
[9]. Public Health [Internet]. [cited 2019 May 5]. Available from: http://dhs.kerala.gov.in/index.php/publichealth.html [Google Scholar]
[10]. Deepak KR, Anil KB, Integrated disease surveillance in India: Way forwardGlobal Journal of Medicine and Public Health [Internet] 2014 4(3)Available from: www.gjmedph.org [Google Scholar]
[11]. Admin. Time-trend analysis, time series designs [Internet]. Health Knowledge. 2010 [cited 2020 Feb 16]. Available from: https://www.healthknowledge.org.uk/public-health-textbook/research-methods/1a-epidemiology/time-trend-analysis [Google Scholar]
[12]. López-Quílez A, Spatio-temporal analysis of infectious diseasesInt J Environ Res Public Health 2019 16(4):66910.3390/ijerph160406693082353 [Google Scholar] [CrossRef] [PubMed]
[13]. Ganeshkumar P, Murhekar MV, Poornima V, Saravanakumar V, Sukumaran K, Anandaselvasankar A, Dengue infection in India: A systematic review and meta-analysisPLoS Negl Trop Dis 2018 12(7):e000661810.1371/journal.pntd.000661830011275 [Google Scholar] [CrossRef] [PubMed]
[14]. ICMR bulletin. Dengue in Kerala-A critical review [Internet]. ICMR; p. 4-5. Report No.: ISSN 0377-4910, Vol 36. Available from: https://www.icmr.nic.in/sites/default/files/icmr_bulletins/april-may06.pdf [Google Scholar]
[15]. Census of India: Provisional Population Totals India: Paper1: Census 2011 [Internet]. [cited 2019 Apr 13]. Available from: http://censusindia.gov.in/2011-prov-results/prov_results_paper1_india.html [Google Scholar]
[16]. GADM [Internet]. [cited 2019 Apr 13]. Available from: https://gadm.org/ [Google Scholar]
[17]. Hayes A, Understanding Moving Averages (MA) [Internet]Investopedia [cited 2020 Mar 12] Available from: https://www.investopedia.com/terms/m/movingaverage.asp [Google Scholar]
[18]. Kulldorff M. SaTScanTM User Guide for version 9.6 [Internet]. 2018. Available from: https://www.satscan.org/cgi-bin/satscan/register.pl/SaTScan_Users_Guide.pdf?todo=process_userguide_download [Google Scholar]
[19]. Kembhavi RS, Saurabha US, Time series analysis of dengue cases reporting to a tertiary care hospitalInt J Community Med Public Health 2019 6(5):2200-05.10.18203/2394-6040.ijcmph20191844 [Google Scholar] [CrossRef]
[20]. Valson JS, Soman B, Spatiotemporal clustering of dengue cases in Thiruvananthapuram district, KeralaIndian J Public Health 2017 61(2):74 [Google Scholar]
[21]. Dawn A, A spatio-temporal analysis of dengue fever in West Bengal with special reference to Kolkata Municipal Corporation AreaIOSR Journal of Humanities and Social Science (IOSR-JHSS) 2014 19(1):46-55.10.9790/0837-191124655 [Google Scholar] [CrossRef]
[22]. Shil P, Rainfall and dengue occurrences in India during 2010-2016Biomed Res J 2019 6(2):5610.4103/BMRJ.BMRJ_15_19 [Google Scholar] [CrossRef]
[23]. Akter R, Naish S, Gatton M, Bambrick H, Hu W, Tong S, Spatial and temporal analysis of dengue infections in Queensland, Australia: Recent trend and perspectivesPLoS One 2019 14(7):e022013410.1371/journal.pone.022013431329645 [Google Scholar] [CrossRef] [PubMed]
[24]. Sedda L, Vilela APP, Aguiar ERGR, Gaspar CHP, Gonçalves ANA, Olmo RP, The spatial and temporal scales of local dengue virus transmission in natural settings: A retrospective analysisParasit Vectors 2018 11(1):7910.1186/s13071-018-2662-629394906 [Google Scholar] [CrossRef] [PubMed]
[25]. Zhu G, Xiao J, Liu T, Zhang B, Hao Y, Ma W, Spatiotemporal analysis of the dengue outbreak in Guangdong Province, ChinaBMC Infect Dis 2019 493https://doi.org/10.1186/s12879-019-4015-210.1186/s12879-019-4015-231164093 [Google Scholar] [CrossRef] [PubMed]
[26]. Mala S, Jat MK, Geographic information system based spatio-temporal dengue fever cluster analysis and mappingThe Egyptian Journal of Remote Sensing and Space Sciences 2019 22:297-304.10.1016/j.ejrs.2019.08.002 [Google Scholar] [CrossRef]
[27]. Telle O, Vaguet A, Yadav NK, Lefebvre B, Cebeillac A, Nagpal BN, The spread of dengue in an endemic urban Milieu-The case of Delhi, IndiaPLoS One 2016 11(1):e0146539Erratum in: PLoS One. 2016;11(3):e015284710.1371/journal.pone.014653926808518 [Google Scholar] [CrossRef] [PubMed]