Intensive care is basically given for patients who require a more detailed observation and extensive treatment which is difficult to be provided in general wards. They contain facilities for the diagnosis, prevention, and treatment of all the major severe health problems [1]. There are many reasons a patient may need care in an ICU. Some of the more common problems and conditions that may bring a patient to an ICU or that may develop while a patient is under ICU care are Pneumonia, Urinary Tract Infection (UTI), Blood Stream Infection (BSI), Shock, multiorgan system dysfunction and so on [2]. Among them, Nosocomial infections in the ICU are about 2 to 5 times higher than in general in-patient hospital population [3]. The incidence of nosocomial bacteraemia in ICU patients ranges from 2.5% to 26% and mortality is also high at 21-56% [4]. If an improper antimicrobial agent is chosen, it may not show beneficial effect leading to a worse prognosis [5]. Antibiotic policy and guideline in place which is based on local susceptibility pattern of pathogens, should be included in every institution, these guidelines will be helpful for the physicians to rationally prescribe and to choose the best effective, most appropriate empiric antibiotic for the patient [6]. Antimicrobials used in hospitalised patients were regular, with patients receiving antibiotics on 70% of their ICU days, and patients on the general in-patient wards receiving antimicrobials on ≥40% of their in-patient days [7].
World Health Organisation has proposed regional strategy on antimicrobial resistance with the goal to minimise the morbidity and mortality due to antimicrobial resistant infection, to preserve the effectiveness of antimicrobial agents in the treatment and prevention of microbial infections [8]. Perhaps no other factor is more important in the development of antimicrobial resistance than antimicrobial use. Many studies have established a correlation between antimicrobial use and antimicrobial resistance at the hospital level. At least 7 days of mechanical ventilation, previous antibiotic use and previous use of broad-spectrum antibiotics (third-generation cephalosporins, fluoroquinolones, carbapenem, or a combination) were the most important risk factors associated with the development of ventilator associated pneumonia caused by antibiotic-resistant pathogens [9].
Tremendous improvement in the marketing of new drugs, variation in the pattern of drug prescribed, delayed adverse effects and cost of drug have increased the importance of DUS (Drug Utilisation Studies) [10]. The principal focus of DUS is to imply prescription of the drug in an optimal dose on the right indication with the correct information and at an affordable price thereby facilitating rational use of drugs in a population. DUS contribute to rational drug use by increasing our understanding of how drugs are used, generate early signals of irrational use of drugs and enable us to intervene to improve drug therapy [11].
Appropriate use of drugs by health care providers can be assessed by the prescribing indicators independent of the diagnosis made [10]. Drug utilisation figures should ideally be presented as numbers of DDDs (Daily Defined Dose) per 1000 inhabitants per day or, when drug use by in-patients is considered, as DDDs per 100 bed-days. For anti-infectives (or other drugs normally used for short periods), it is often considered to be the most appropriate to present the figures as numbers of DDDs per 1000 inhabitant per year. Considering the importance of rationale prescribing of antimicrobials, the present study was carried out with the objectives of assessing their utilisation pattern using WHO Drug use indicators and DDD/1000 inhabitants/day, safety profile and calculate cost of AMAs prescribed based on DDD.
Materials and Methods
This was a prospective cross-sectional observational study, conducted at Medical Intensive Care Unit (MICU) of a tertiary care hospital. Sample size was calculated with reference to previous studies on AMAs by John LJ et al., using the formula 4 Pq/d2 [12]. The sampling technique used was non-randomised convenient sampling. The study was done during the period February 2016 to February 2017.
Inclusion criteria: Patients aged more than 18 years of either sex prescribed with antimicrobial drugs in Medical ICU.
Exclusion criteria: Patients not receiving any AMAs, those discharged/died within 24 hour of admission and those not willing to give written informed consent. Ethical clearance was obtained from Institutional Human Ethics Committee (Ref. No. SMIMS/IHEC/2016/A/21). Patients were explained about the study and written informed consent was obtained from them before recruiting them into the study. Standard case record form was used to collect the information regarding demographic data, clinical data, antibiotic use and adverse drug reactions. Antimicrobial use was analysed using WHO drug use indicators and Defined Daily Dose (DDD) [13].
WHO drug use indicators assessed were: Average number of drugs per prescription, percentage of drugs prescribed by generic name, percentage of prescriptions with an injection and percentage of drugs prescribed from Essential Drug List (EDL). Complementary Indicators of WHO like average drug cost per prescription per day and percentage of drugs cost spent on injections were calculated.
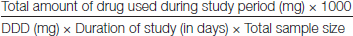
The data collected were compared with WHO prescribing indicators standard values. Daily Defined Dose was calculated as per guidelines for Anatomical Therapeutic Chemical (ATC) classification and DDD assignment (2013) as given by WHO collaborator centre for drugs, Statistics methodology, Oslo, Norway [13]. Utilisation of AMAs in ICU was expressed as number of DDD/1000 patients/day, calculated using the following formula:
The DDD is the assumed average maintenance dose per day for a drug used for its main indication in adults. In the present study, the target drug were the systemic antibacterial agents belonging to class J01 of the ATC/DDD classification system. The systemic antiviral (J05), the systemic antimycotic (J02), the antimycobacterial (J04) and drugs were not included in the study. The antimicrobials were classified using WHO Anatomical Therapeutic Chemical (WHO-ATC) classification system [13].
Prescribing pattern of AMAs was evaluated by prescription frequency of class of AMAs, prescription frequency of individual AMAs and percentage of patients on monotherapy or combination of AMAs. Cost per DDD was calculated for AMAs as given below:

Adverse effects of AMAs were assessed using WHO causality assessment [14].
Statistical Analysis
The data collected were entered into MS Excel-2016 and statistical parameters are analysed using descriptive statistics (mean, percentage etc.,).
Results
Totally 123 patients in the ICU were included in the study. These included 82 men and 41 women. The average age of the patient was 57.7 years. Maximum number of patients in the age group of 61-80 years were admitted in medical ICU. Majority patients were admitted with respiratory infection (24.39%, n=30).
Prescribing indicators and complementary indicators were calculated using WHO standards [13]. Polypharmacy was observed in the prescriptions (7-8 drugs) compared to WHO value (2-3 drugs). According to WHO standard, all drugs (100%) should be prescribed by their generic names. But in this study, only 30.67% drugs were prescribed by generic name. Most of the drugs were prescribed by branded name (69.33%). There was also overuse of injections which led to increase in cost spent on injections (Rs. 10939.95) for 123 prescriptions. There was a tendency to prescribe drugs from EDL (90.41%) which is similar to WHO value (80-100%) [Table/Fig-1].
Summary of prescribing indicators data.
| Prescribing indicator assessed | Average/Percent | WHO standard |
|---|
| Average number of drugs per encounter | 7-8 drugs | 2-3 drugs |
| Percentage of drugs prescribed by generic name | 30.67% | 100% |
| Percentage of encounters with injections | 100% | 16-20% |
| Percentage of drugs prescribed from EDL | 90.41% | 80-100% |
Complementary indicator data: The total cost of AMAs in this study was Rs. 25487/- for 123 encounters (including both oral and parenteral). Therefore average drug cost per encounter per day was Rs. 110.8. The total amount spent on parenteral AMAs was Rs. 10939.95 for 123 encounters. Therefore, the percentage of drugs cost spent on injections was 42.92%.
Beta-lactam antibiotics (11.97 DDDs/1000 Patients/day) were more utilised than other AMAs. Among the beta-lactam antibiotics, cephalosporins were most frequently utilised drugs (10.08 DDDs/1000 patients/day). Among the cephalosporins, ceftriaxone (6.45 DDDs/1000 patients/day) was most utilised drug. Total cost/DDD for all AMAs was Rs. 20772.90 (including individual and fixed dose combinations). Total cost/DDD for beta-lactam antibiotics was Rs. 402/-, Rs. 7140/- for carbapenems and Rs. 2623/- for glycopeptides (Vancomycin and teicoplanin) [Table/Fig-2]. Prescriptions with combination of AMAs were 65.85% [Table/Fig-3]. Twenty five different combinations of drugs were noticed in this study among the patients who were administered 2 AMAs’. Among them Ceftriaxone and metronidazole were the most commonly prescribed 2 AMAs (n=19, 15.44%).
Utilisation of AMAs expressed as number of DDD/1000 patients/day and cost/DDD.
| ATC code | AMAs | DDD/1000 patients/day | AMAs Cost/DDD* (Rs) |
|---|
| J01MA12 | Levofloxacin (O) | 0.55 | 7 |
| J01MA12 | Levofloxacin (P) | 0.15 | 129 |
| J01MA02 | Ciprofloxacin (O) | 0.11 | 20 |
| J01MA02 | Ciprofloxacin (P) | 0.57 | 40 |
| J01DD04 | Ceftriaxone (P) | 6.45 | 122 |
| J01DH02 | Cefotaxime (P) | 0.75 | 176 |
| J01DD08 | Cefixime (O) | 2.22 | 40 |
| J01CA01 | Ampicillin (P) | 0.22 | 64 |
| J01DH02 | Meropenem (P) | 1.25 | 3800 |
| J01AA12 | Tigecycline (P) | 0.13 | 6460 |
| J01AA02 | Doxycycline (O) | 1.11 | 3 |
| J01GB06 | Amikacin (P) | 0.22 | 124 |
| J01FA10 | Azithromycin (O) | 1.55 | 18.6 |
| J01FF01 | Clindamycin (O) | 0.33 | 56 |
| J01FF01 | Clindamycin (P) | 0.35 | 504 |
| J01XX08 | Linezolid (O) | 0.44 | 156 |
| J01XX08 | Linezolid (P) | 0.44 | 580 |
| J01XA01 | Vancomycin (P) | 0.35 | 1556 |
| J01XA02 | Teicoplanin (P) | 0.13 | 1067 |
| J01XD01 | Metronidazole (P) | 3.34 | 42 |
| J01XE01 | Nitrofurantoin (O) | 0.46 | 2 |
| Utilisation of fixed drug combination AMAs |
| J01DD62 | Cefoperazone (500) and Sulbactam (500) (P) | 0.66 | 960 |
| J01CR02 | Amoxicillin(500) and clavulanic acid (125) (O) | 0.13 | 20.80 |
| J01DD08 | Amoxicillin (1000) and clavulanic acid (250) (P) | 0.07 | 332.50 |
| J01EE01 | Sulfamethoxazole (800) and Trimethoprim (160) (O) | 0.62 | 2 |
| J01CR05 | Piperacillin and Tazobactam (P) | 3.5 | 1151 |
| J01DH51 | Imipenem and cilastatin (P) | 0.22 | 3340 |
O: Oral; P: Parenteral
Frequency of distribution of AMAs in each prescription.
| Prescription with AMAs | Number of cases | Percentage (%) |
|---|
| Single drug | 42 | 34.15 |
| 2 drugs | 63 | 51.22 |
| 3 drugs | 16 | 13.01 |
| 4 drugs | 2 | 1.63 |
| Total | 123 | 100% |
Most commonly used antimicrobial group was Beta-lactam antibiotics (n=120). Most commonly prescribed antibiotic was Ceftriaxone (n=56, 29.95%), followed by metronidazole (n=45, 24.06%) [Table/Fig-4].
Frequency of commonly prescribed antibiotics.
| Commonly prescribed antibiotics | Frequency | Percentage (%) |
|---|
| Ampicillin | 2 | 1.07 |
| Ceftriaxone | 56 | 29.95 |
| Cefotaxime | 9 | 4.81 |
| Cefixime | 1 | 0.53 |
| Meropenem | 9 | 4.81 |
| Imipenem | 2 | 1.07 |
| Sulford Forte (cefoperazone+Sulbactam) | 8 | 4.28 |
| Piptaz (piperacillin+tazobactam) | 31 | 16.58 |
| Augmentin (Amoxicillin+clavulanic acid) | 2 | 1.07 |
| Metronidazole | 45 | 24.06 |
| Levofloxacin | 2 | 1.07 |
| Clindamycin | 3 | 1.60 |
| Amikacin | 2 | 1.07 |
| Linezolid | 4 | 2.14 |
| Ciprofloxacin | 4 | 2.14 |
| Vancomycin | 5 | 2.67 |
| Teicoplanin | 1 | 0.53 |
| Tigecycline | 1 | 0.53 |
| Total | 187 | 100% |
The most common adverse drug reactions were nausea and gastritis [Table/Fig-5]. Based on WHO causality assessment scale nearly 30.77% (n=4) were assessed as probable [Table/Fig-6].
Frequency and percentage of encounter with ADRs.
| Type of ADR | Number | Percentage (%) |
|---|
| Diarrhoea | 2 | 15.38 |
| Gastritis | 3 | 23.08 |
| Hypersensitivity | 3 | 23.08 |
| Nausea | 4 | 30.77 |
| Urticaria | 1 | 7.69 |
| Total | 13 | 100.00 |
Causality assessment of ADRs as per WHO.
| WHO causality assessment scale | Number of case | Percentage (%) |
|---|
| Certain | 3 | 23.09 |
| Probable/Likely | 4 | 30.77 |
| Possible | 2 | 15.38 |
| Unlikely | 2 | 15.38 |
| Conditional/Unclassified | 2 | 15.38 |
| Total | 13 | 100% |
Discussion
The DDD system provide a tool for presenting drug utilisation statistics, which allows the measurement of drug consumption across therapeutic groups. It is difficult to treat patients in the ICU with multiple co-morbidities with less number of drugs as they require drugs for treatment of specific conditions as well as for prophylaxis, but it is also essential to keep a balance between the number of drugs and effective pharmacotherapy.
Among the organisms, aerobic gram-negative species and Staphylococcus species are the most prevalent agents for infections. Most studies show that the high prevalence of gram-negative bacteria isolated from patients in ICUs is associated with a high rate of mortality [15]. In the present study no mortality was found with infections caused by the above organisms.
Of the 123 patients admitted in Medical ICU, the most common diagnosis was respiratory infection (24.39%, n=30). In a study by Mathur P et al., secondary bacteraemia in their ICUs was mostly due to LRT (Lower Respiratory Tract) infections which is consistent with this study [16].
Male preponderance was seen in this study similar to that by Gajbhiya VP et al., on AMAs in the ICU of a rural tertiary care hospital [17]. The most likely reason for this finding could be that in India, male population has more access to medical facility compared to females, who even in critical illnesses are reluctant to utilise health care facilities, especially in those of lower socio-economic strata [6].
A study by Anand N et al., the maximum number of patients belonged to age group of 51-65 years (37%) [6]. In this study, the maximum patients belonged to the age group of 61-80 years (44.72%).
Average number of drugs per prescription is an important index as it tends to measure the degree of polypharmacy, providing scope for review and educational intervention in prescribing practices [10]. In this study the average number of overall drugs per encounter was 7-8 which when compared with WHO standard (2-3), is high. Poly pharmacy could enhance drug interaction which was not seen in this study. In a similar study performed in critical care unit of tertiary care teaching hospital in India, the average number of drugs per encounter was 13.54 which was higher than this study [18]. It is recognised that patients in ICU are generally prescribed more drugs than other patients. Besides patients had 1-3 co-morbid conditions. Atif M et al., documented in his article that, there were several other reasons for higher number of drugs in a prescription, like, incompetency on the part of physicians, unavailability of clinical practice guidelines, financial incentives to the prescribers, lack of continuous medical education of the prescribers and the shortage of therapeutically correct drugs [19]. Polypharmacy needs to be discouraged as a good number of ADRs results from drug-drug interactions [20].
There are high recommendations by WHO for generic prescription. The percentage of drugs prescribed by generic name were 30.67% which is low compared to the WHO standard (100%). It was noticed that most of the antimicrobial agents were prescribed by brand name (69.33%) which requires revision of current prescribing practice. Akl OA et al., stated that, WHO deems generic prescription as a safety measure for patients as it clearly depicts and gives easy accessible information, and leads to better communication among healthcare providers [21]. A national baseline study on drug use indicators in Ethiopia (2002) showed the percentage of drugs prescribed by generic name to be 87% which is higher than our finding (30.67%) [22].
The percentage of drugs prescribed from the EDL in this study was 90.41%. The proposed optimal value for the percentage of drugs prescribed from the EDL by WHO was 80-100%.
In the present study, the most frequent used AMA was ceftriaxone (29.95%, n=56) followed by metronidazole (24.06%, n=45). The most common AMA prescribed was ceftriaxone (22.7%) in the study by Anand N et al., [6] and it also showed that the maximum utilisation of AMA was cephalosporins and other beta-lactams followed by penicillins. In this study, the most commonly prescribed antimicrobial group was beta lactam antibiotics (n=120). Cephalosporins are commonly prescribed due to their relatively lower toxicity and broad spectrum activity.
In Malacarne P et al., study, there is widespread use of drug combinations [23]. Antibiotic combinations are widely accepted if used appropriately in certain patients. The present study shows 65.85% of patients were prescribed with combination therapy of AMAs.
In a study by Williams A et al., the total cost of antibiotics prescribed in 200 patients was Rs. 3,99,016, an average of Rs. 1995.08/patient [24]. While in the present study, the total cost of AMAs was Rs. 25487/- for 123 prescriptions. The average drug cost per encounter per day was Rs. 110.8/patient. Patanaik SK et al., in his study stated that cost of drug therapy was lower compared to developed countries, which was not similar to this study [25]. Cost spent on injections was Rs. 10939.95 (42.92% of total cost) which showed that higher cost was due to prescribing of injections especially carbapenem (7140/DDD) and glycopeptides (Vancomycin and Teicoplanin 2623/DDD). The cost/DDD for fixed dose combinations was Rs. 5806.03 which had increased the total cost.
There was high utilisation of beta lactam antibiotics (11.77/DDD/1000 patients/day) in the present study. Among the beta lactam antibiotics, cephalosporins were most frequently utilised drug (10.08 DDD/1000 patients/day). Among the cephalosporins, ceftriaxone (6.45 DDD/1000 patients/day) was most utilised drug. These results appear to be in agreement with those from other Asian countries such as China, where cephalosporins and penicillins were the most utilised antibiotics [26].
In this study, the frequency of ADRs were 13. The most common ADR was hypersensitivity. In a study by Dhar K et al., where assessment of ADR associated with antibiotics by WHO causality assessment scale was done, majority were possible 78 (61.9%) with a less number of probable and definite reactions [27]. But in this study, more frequency was towards probable ADRs (30.77%). There is an increased incidence of ADRs with increase in number of drugs [20]. Since polypharmacy is noted in 65.85% of prescriptions, it might have contributed to the ADRs seen in this study. Hence with rationale prescribing incidence of ADRs could have been minimised.
Limitation(s)
Small sample size, socioeconomic status of the patients was not analysed. Indirect cost like expenditure on investigations and travelling expenses were not calculated which would have more information on total cost for controlling infection in ICU.
Conclusion(s)
Antimicrobials are frequently utilised drugs in ICU. Prescribing guideline is required to reduce the prevalent poly-pharmacy and to promote appropriate use of antimicrobial drugs in ICU setting. Through longitudinal surveillance of AMAs use, a database can be created to compare the trends in the utilisation of AMAs and Antibiotic stewardship program could be implemented to reduce the AMA use.
Declaration by the authors: This study was done as a post graduate dissertation. All the above given data are a part of the dissertation work, and submitted on the university website as a routine procedure for all thesis submission. Presented poster at Clinicopharmacon National Conference on Clinical Trials and Research 2018.
O: Oral; P: Parenteral