Vitamin D binds to the intracellular VDR, which interacts with Retinoid X receptor and vitamin D responsive element to regulate transcription factors [1,2]. Polymorphisms in the VDR gene may show changes in transcription of the gene, mRNA stability and protein structure. These polymorphisms are frequently seen in the population and are related to variations in BMD, autoimmune diseases, cancers, osteoporosis, fractures, rickets, osteomalacia and Rheumatoid Arthritis (RA) [3-12]. Even though Fok1 polymorphism (ff genotype) was reported to be associated with nutritional rickets among children in Nigeria [13], it was not supported in study among the Indian population [14].
Hence, this study was planned to assess whether genotype frequencies are different among participants who had subtle features of vitamin D deficiency as against those who had no features at all and the effect of VDR polymorphisms on BMD.
Materials and Methods
Thirty cases and 30 controls were included in this case-control study. Sample size calculation was done by Online Sample Size Estimator (OSSE) by taking minor allele frequency for controls. Calculated sample size was 28 cases and 28 controls for Fok1 and 20 cases and 20 controls for Bsm1.
Participants were recruited from the OPD of Department of Endocrinology in a tertiary care hospital from Sri Venkateswara Institute of Medical Sciences, Tirupati, Andhra Pradesh from December 2015 to May 2016. All procedures performed were in accordance with the ethical standards of the institutional and/or national research committee and with the 1964 Helsinki declaration and its later amendments or comparable ethical standards. The study was approved by the Institutional Ethics Committee (IEC number -223/22-05-2012).
Vitamin D deficient participants {serum 25(OH)D <20 ng/mL} were recruited as cases if they had any clinical features (e.g., body ache, proximal muscle weakness or rachitic bone deformities) and any of the biochemical features {e.g., serum Alkaline Phosphatase (ALP) >90 IU/L, Plasma Intact Parathormone (PTH) >55 pg/mL or serum inorganic phosphorous <2.7 mg/dL} suggestive of vitamin D deficiency.
Relatives of the patients and hospital staff, who had vitamin D deficiency (serum 25OHD <20 ng/mL) without any clinical or biochemical features, were recruited as controls. Participants who had 25(OH)D >20 ng/mL, had Chronic Kidney Disease (CKD) or who were taking drugs like glucocorticoids, antitubercular therapy, antiepileptics or hormone replacement were excluded from the study. Participants were recruited after obtaining informed consent. Relevant clinical evaluation was done. Weight and height were recorded and BMI was calculated {BMI=weight (Kg)/{height (metres)}2}. BMD was measured by dual-energy X-ray absorptiometry (Discovery QDR, Hologic, Belgium) at the lumbar spine Antero Posterior (AP) and lateral, left hip (neck of femur) and forearm regions. The BMD of the participants was recorded in terms of absolute mineral content (in g/cm2) and T score (Asian database).
Biochemical assays {Calcium (Arsenazo iii, CPC-Diagonstics, Chennai), inorganic phosphorus (Phosphomolybdate method, Melrose health care, Chennai), ALP (Para- Nitro phenyl Phosphate method, Beckman system pack CA, USA), and albumin (Bromocresolgreen method, AGAPEE, Kerala)} were done on an auto analyser (Beckman Synchron CX9 fully automated, Beckman, USA), by using commercial kits. Serum 25(OH) D was assessed with a commercial Radio Immune Assay (RIA) kit (DiaSorin Inc, USA). Plasma PTH was assessed on an automated chemiluminescence immunoassay system (Beckman Access-2, USA).
Blood samples were collected from individuals for assessing plasma intact Parathyroid Hormone (iPTH), serum (ALP), calcium, inorganic phosphorus, albumin and 25(OH)D. Biochemical analysis was done with the commercial kits (Details in Electronic Supplementary material). DNA was isolated with a commercial kit (Qiamp DNA Mini Kit, QIAGEN Germany) and stored at -20°C for analysis.
Vitamin D Receptor Polymorphism
The VDR genotypes for Fok1 and Bsm1 sites were assessed after PCR amplification of the respective exons and introns.
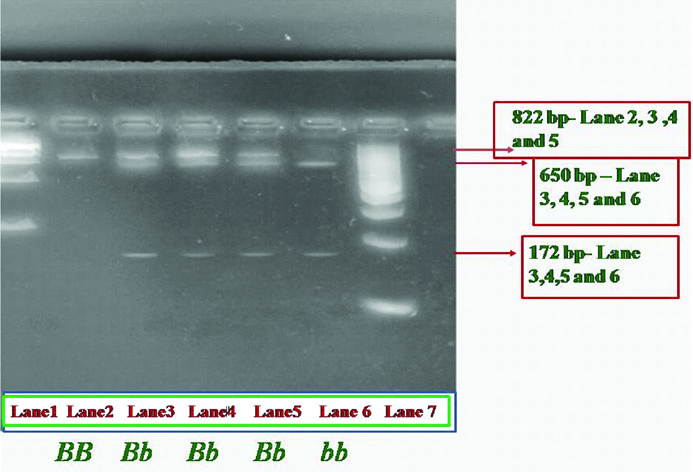
Bsm1: The forward (5’-CAA CCA AGA CTA CAA GTA CCG CGT CAG TG-3’) and reverse (5’-AAC CAG CGG GAA GAG GTC AAG GG-3’) primers (Eurofins, Bangalore) were used to amplify the intron 8 of VDR gene [18]. The conditions for PCR (Corbett, USA) amplification were as follows: 5 μL of isolated DNA, 1 μL of (10 pmol) each primer, 0.2 μL of each 10 mM deoxynucleoside triphosphate (dNTPs), 1 μL of 2.5 mmol MgCl2, 2.5 μL of 10X Taq buffer and 0.5 μL of Taq DNA polymerase were constituted in 25 μL of reaction mixture (dNTPs, Mgcl2, Taq Buffer and Taq polymerase-Genetix Biotech Asia Pvt. Ltd, Chennai). The initial denaturation was performed at 94°C for 5 min, followed by 35 Cycles at 94°C for 40 seconds, 65°C for 35 seconds, 72°C for 1 minute, and a final extension at 72°C for 15 minutes. The band size produced after PCR was 822 Base Pairs (bp). The PCR products were purified by gel elution technique with commercial Gel Elution kit (Quick Gel extraction Kit, INVITROGEN, Germany). After purification, the purified PCR product was digested with 4 U Bsm1 (New England Biolabs, Massachusetts, United states) at 37°C following manufacturer’s protocol. The digested products were electrophoresed on ethidium bromide stained 4% agarose gel in 1X Tris-Borate (TBE) buffer for 2 hour and visualised with a Ultraviolet transilluminator [Table/Fig-1]. Bsm1 endonuclease, detects the A→G substitution in the VDR gene at intron 8 [6]. Homozygotes having ‘A’ at this site show an intact band of 822 bp (genotypes BB- absence of restriction site), whereas homozygotes having G at this position show 2 bands of 650 and 172 bp (‘bb’ presence of restriction site). Heterozygous participants show 3 bands of 822, 650 and 172 bp respectively (‘Bb’).
Gel images of vitamin D receptor -Bsm1 polymorphism -Restriction digestion.
Polymerase chain reaction-Restriction fragment length polymorphism (PCR-RFLP) analysis of VDR- Bsm1 polymorphism showing bands of three different base pairs (bp). Lane 1 (from left to right) shows 1 kilo base pair marker starts from 250, 500, 750, 1000 ... 5000. Lane 2 indicated as BB shows intact 822 bp band. Lane 3, 4, 5 indicated as Bb (heterozygotes) showing three bands of 822, 650 and 172. Lane 6- indicated as bb (homozygous) shows bands of 650 and 172 bp. Lane 7 is 100 bp marker starts from 100,200,300..... 1000
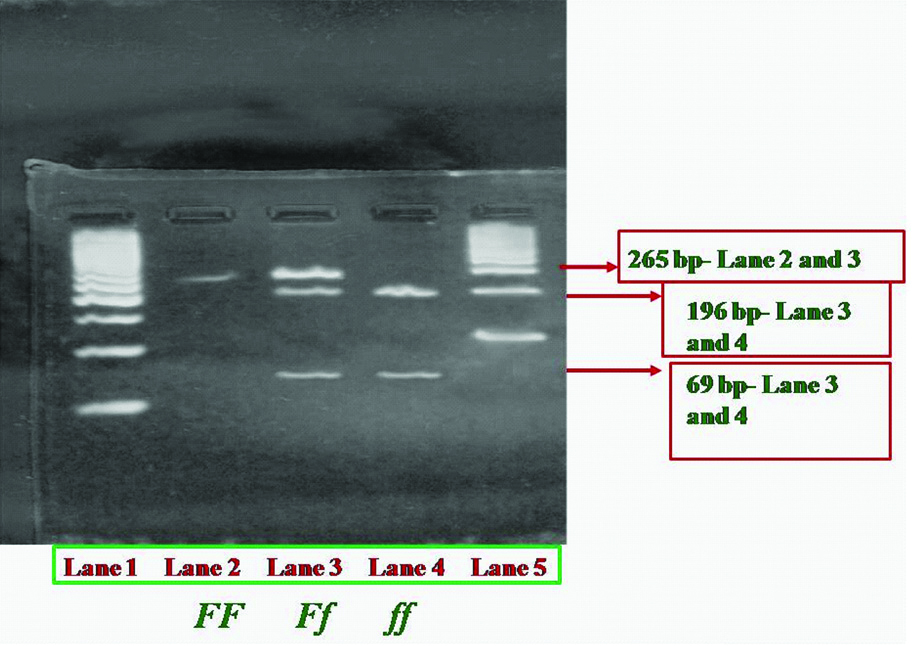
Fok1: The forward (5’- ACA GGG ATG GAG GCA ATG GC -3’) and reverse (5’- ACC TTG CTT CTT CTC CCT -3’) primers (Eurofins, Bangalore) were used to amplify the exon 2 of VDR gene [3]. The conditions for PCR (Corbett, USA) amplification were as follows: 5 μL of isolated DNA, 1 μL of (10 pmol) each primer, 0.2 μL of each 10 mM dNTPs, 1 μL of 2.5 mmol MgCl2, 2.5 μL of 10X Taq buffer and 0.5 μL of Taq DNA polymerase were constituted in 25 μL of reaction mixture (dNTPs, Mgcl2, Taq Buffer and Taq polymerase-Genetix Biotech Asia Pvt., Ltd., Chennai). The initial denaturation was performed at 94°C for 5 min, followed by 35 Cycles at 94°C for 40 seconds, 61°C for 35 seconds, 72°C for 1 minute, and a final extension at 72°C for 15 minutes. The band size produced after PCR was 265 base pairs (bp). The PCR products were purified as described above. After purification, the product was digested with 4 U Fok1 (New England Biolabs, Massachusetts, United states) at 37°C following manufacturer’s protocol. The digested products were electrophoresed as described above [Table/Fig-2]. In exon 2 of the VDR, Fok1 restriction endonuclease defines the presence or absence of polymorphism at first two translation intiation sites [19]. T→C substitution at exon 2 of VDR gene leads to the restriction site for Fok1 enzyme [3], unsubstituted ‘T’ results in an intact 265 bp band for homozygous participants (FF- absence of restriction site) whereas substitution with ‘C’ at this position results in two bands of 196 and 69 bp, respectively (ff- presence of restriction site) for homozygotes. Heterozygous participants show 3 bands of 265, 196 and 69 bp, respectively (Ff) [6].
Gel images of vitamin D receptor -Bsm1 polymorphism -Restriction digestion.
Polymerase chain reaction-Restriction fragment length polymorphism (PCR-RFLP) analysis of VDR- Fok1 polymorphism showing bands of three different base pairs (bp). Lane 1 (from left to right) shows 50bp marker starts from 50, 100, 150, 200, 250, 300 ... 1000. Lane 2 indicated as FF shows intact 265 bp band. Lane 3 indicated as Ff (heterozygotes) showing three bands of 265, 196 and 69. Lane 4- indicated as ff (homozygous) shows bands of 196 and 69 bp. Lane 5 is 100 bp marker starts from 100,200,300....1000
Statistical Analysis
Data were presented as mean±SD (normal distribution) or median (IQR) (non-normal distribution) as appropriate. Genotype frequencies were presented as percentages. Categorical data were compared with Chi-Square test among different groups. Continuous variables were compared with non- parametric Mann-Whitney U test or one way ANOVA, as appropriate. Pearson’s coefficient was calculated for correlation. Linear regression analysis was performed to assess the relationship of BMD with other indices. Multivariate analysis was performed to assess the independent effect of each variable separately. Significance was assumed at level <0.05.
Results
Demographic and other characteristics were compared among cases (n=30, male=3, female=27) and controls (n=30, male=5, female=25). Age, BMI, serum 25(OH)D and serum calcium were comparable. As expected, plasma iPTH and serum ALP were higher and serum phosphate was lower among the cases when compared to controls. BMD was comparable among both the groups [Table/Fig-3].
Comparison of Demography, biochemical indices and bone mineral density between cases and controls.
| Characteristics | Cases (n=30) | Controls (n=30) | p-value |
|---|
| Age (years) | 59 (53-66) | 60 (49-65) | 0.894 |
| BMI (Kg/m2) | 27 (24-30) | 26 (22-29) | 0.451 |
| Serum 25(OH)D (ng/mL) | 12 (8-16) | 13 (9- 16) | 0.424 |
| Plasma iPTH (pg/mL) | 39 (20-59) | 29 (19-38) | 0.029* |
| Serum calcium (mg/dL) | 9.7 (9.4-10) | 9.9 (9.5-10.1) | 0.117 |
| Serum phosphorous (mg/dL) | 3.2 (2.7-3.7) | 3.8 (3.3-4.3) | 0.003* |
| Serum alkaline phosphatase (IU/L) | 105 (93-123) | 70 (61-78) | 0.001* |
| Serum albumin (g/dL) | 4.1 (3.9-4.2) | 4.2 (4.1-4.2) | 0.331 |
| Serum creatinine (mg/dL) | 0.8 (0.67-0.90) | 0.8 (0.65-0.90) | 0.754 |
| Lumbar spine total (AP) | -1.7 (-2.4 to -0.67) | -2.0 (-2.5 to -1.1) | 0.446 |
| Lumbar spine lateral- Total | -1.7 (-2.3 to -0.9) | 1.6 (-2.2 to- 0.3) | 0.653 |
| Left Hip-Neck | -1.4 (-1.7 to -0.87) | -1.4 (-1.8 to-0.98) | 0.836 |
| Fore Arm- UD | -1.7 (-2.3 to -0.9) | -1.6 (-2.2 to- 0.3) | 0.653 |
Data given as median (IQR); *Significance- <0.05; Mann-Whitney U test
BMI: Body mass index; 25(OH)D: 25 hydroxy vitamin D; iPTH: intact parathormone; BMD: bone mineral density given as T score. Reference range: Serum 25(OH)D >20 ng/mL; Plasma iPTH 13-55 pg/mL; Serum calcium 8.5-10.5 mg/dL; Serum phosphorus 2.5-4.5 mg/dL Serum alkaline phosphatase- 40-90 IU/L; Serum albumin 3.4-5.4 g/dL; Serum creatinine <1.5 mg/Dl
Age correlated negatively with BMD and positively with systolic blood pressure and serum creatinine. BMI correlated positively with BMD. Serum 25(OH)D, phosphorus and iPTH did not correlate with either age or BMI.
When all the participants (both cases and controls) were grouped according to age (group 1 age >60 years and group 2 age ≤60 years), older participants had lower BMD T-scores at 2nd and 3rd lumbar vertebra at lateral projections. Fore arm BMD was also lower in group 1. Blood pressure was higher in older participants when compared to younger ones, while serum 25(OH)D, ALP, Phosphorus, creatinine, iPTH were comparable among the groups.
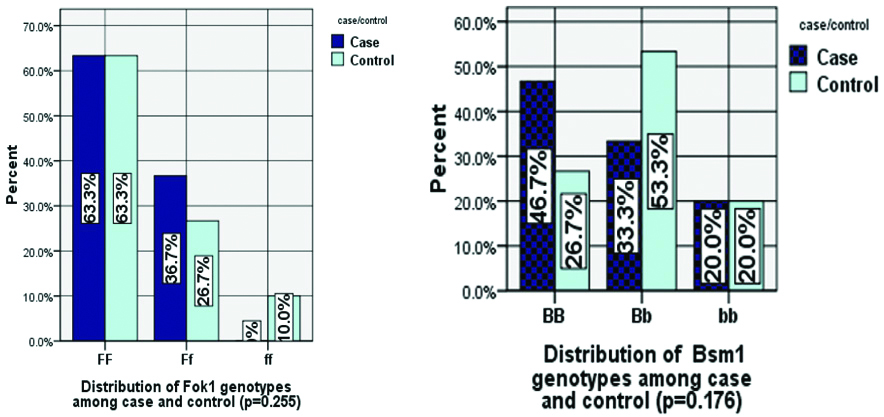
Genotype frequency of FF, Ff and ff Fok1 among the cases was 63.3%, 36.7%, 0% and the controls was 63.3%, 26.7%, 10% respectively (p-value 0.255). Genotype frequency of BB, Bb and bb of Bsm1 among the cases was 46.6%, 33.3%, 20% and the controls was 26.7%, 53.3%, 20%, respectively (p-value 0.175) [Table/Fig-4].
Distribution of Fok1 and Bsm1 genotypes among case (n=30) and control (n=30).
BMD at L3 vertebra (lumbar spine lateral) was found to be different among participants (both case and controls) with different FokI genotypes. It was higher in Ff genotype when compared to FF genotype. Serum 25(OH)D, ALP, phosphorus and iPTH were similar among different Fok1 genotypes [Table/Fig-5].
Comparison of the demography, biochemical indices and bone mineral density among Fok1 genotypes.
| Demography (n=60) | FF | Ff | ff | p-value |
|---|
| Age (years) | 58±10 | 56±11 | 58±12 | 0.81 |
| BMI (Kg/m2) | 26.3±4.5 | 27.6±4.8 | 24.9±2.8 | 0.463 |
| Serum 25(OH) D (ng/mL) | 12.8±4.2 | 11.9±4.4 | 13.5±3.7 | 0.667 |
| Plasma iPTH (pg/mL) | 37.8±27 | 41.6±35 | 32±7.8 | 0.839 |
| Lumbar spine Total (AP) | -1.7±1.1 | -1.3±1.5 | -2.6±0.3 | 0.074 |
| Lumar spine lateral- L3 | -2.2±1.4 | -1.1±1.0 | -2.9±1.5 | 0.01* |
| Lumbar spine lateral- Total | -1.6±1.2 | -0.9±0.9 | -2.5±0.8 | 0.08 |
| Left Hip neck | -1.3±0.9 | -1.2±0.8 | -1.4±0.2 | 0.9 |
| Forearm UD | -1.3±1.2 | -0.8±1.0 | -1.9±0.5 | 0.2 |
Data given as Mean±SD; *Significance- <0.05, BMD- bone mineral density given as T score. BMI: Body mass index, 25(OH) D- 25 hydroxy vitamin D, iPTH: Intact Parathormone; Reference range: Serum 25(OH) D >20 ng/mL; Plasma iPTH 13-55 pg/mL
BMI and BMD (lumbar spine L4 vertebra) were found to be different among different BsmI genotypes. BMI was higher among participants with BB in comparison to bb genotype. BMD at lumbar spine (L4 vertebra), was lower in bb when compared to Bb genotype (both case and controls-pooled data) [Table/Fig-6].
Comparison of the demography, biochemical indices and bone mineral density among Bsm1 genotypes
| Demography (n=60) | BB | Bb | bb | p-value |
|---|
| Age (years) | 59±10 | 57±12 | 58±6 | 0.7 |
| BMI (Kg/m2) | 27.8±4.2 | 27±4.8 | 23.7±3.3 | 0.033* |
| Serum 25(OH) D (ng/mL) | 11±4 | 13±4 | 14±5 | 0.66 |
| Plasma iPTH (pg/mL) | 37±34 | 41±25 | 35±26 | 0.84 |
| Lumbar spine L4 (AP) | -1.8±1.4 | -1.0±1.6 | -2.4±0.4 | 0.011* |
| Lumbar spine Total (AP) | -1.7±1.2 | -1.3±1.4 | -2.2±0.6 | 0.11 |
| Lumbar spine Total Lateral | -1.4±1.1 | -1.2±1.3 | -1.4±1.1 | 0.5 |
| Left Hip neck | -1.4±0.8 | -1.01±1.0 | -1.3±0.5 | 0.5 |
| Forearm UD | -1.0±1.1 | -1.2±1.3 | -1.4±1.1 | 0.6 |
Data given as Mean±SD; *Significance- <0.05;
BMI: Body mass index; 25(OH) D- 25 hydroxy vitamin D; iPTH: Intact parathormone; BMD: Bone mineral density given as T score
Reference range: Serum 25(OH) D >20 ng/mL; Plasma iPTH 13-55 pg/mL
The effect of genotypes and other biochemical indices on BMD of the participants was further analysed with Multivariate analysis (MANOVA) with covariates. Serum iPTH, serum phosphorus, age and Bsm1 genotypes were found to have effect on the BMD of the participants [Table/Fig-7]. BMD at lumbar spine (AP, including all the individual vertebrae and total) was affected by iPTH and phosphorus, lumbar spine lateral (L2, L3) by genotype of Bsm1 (Bb genotype) and ALP and left hip (neck of femur) by age and serum phosphorus.
Factors affecting BMD, Multivariate analysis
| Dependent variable | Independent variables | Regression coefficient | p-value |
|---|
| Lumbar spine L1 (AP) | Plasma iPTH (pg/mL) | -0.018 | 0.03* |
| Serum phosphorus (mg/dL) | -0.481 | 0.04* |
| Lumbar spine L2 (AP) | Plasma iPTH (pg/mL) | -0.018 | 0.02* |
| Lumbar spine L3 (AP) | Plasma iPTH (pg/mL) | -0.016 | 0.01* |
| Serum phosphorus (mg/dL) | -0.88 | 0.001* |
| Lumbar spine L4 (AP) | Serum phosphorus (mg/dL) | -0.770 | 0.011* |
| Lumbar spine Total (AP) | Plasma iPTH (pg/mL) | -0.015 | 0.012* |
| Serum phosphorus (mg/dL) | -0.699 | 0.005* |
| Lumbar spine lateral L2 | Serum phosphorus (mg/dL) | -0.488 | 0.04* |
| Bsm1(Bb) | 3.511 | 0.029* |
| Lumbar spine lateral L3 | Serum alkaline phosphatase (IU/L) | -0.015 | 0.04* |
| Left hip neck | Age (years) | -0.039 | 0.001* |
| Forearm- UD | Age (years) | -0.040 | 0.001* |
| Plasma iPTH (pg/mL) | -0.011 | 0.03* |
| Serum phosphorus (mg/dL) | -0.456 | 0.03* |
| Forearm- MID | Age (years) | -0.042 | 0.03* |
| Fore arm -1/3 | Age (years) | -0.037 | 0.04* |
| Fore arm- Total | Age (years) | -0.043 | 0.02* |
*Significance- <0.05; iPTH: Intact Parathormone; BMD: Bone mineral density given as T-score; Reference range: Plasma iPTH 13-55 pg/mL; Serum alkaline phosphatase- 40-90 IU/L; Serum phosphorus 2.5-4.5 mg/dL
Discussion
Sixty participants were studied with vitamin D deficiency, divided into cases and controls based on symptoms and biochemical indices. Cases and controls were similar in age, BMI, serum 25(OH)D, serum calcium and BMD and as expected, differed in plasma PTH, serum ALP and phosphate. Males and females could not be recruited in equal numbers, as vitamin D deficiency is seen more commonly among females [20]. Age correlated negatively with BMD lumbar spine lateral (L3 and total) and forearms (UD, MID, 1/3 and Total) [21] while BMI correlated positively with BMD at hip and forearm.
Association of serum PTH, ALP and BMD, as found in the present study is as per other published reports [5,17,22,23]. Low serum inorganic phosphorus in this study could be a biochemical manifestation of secondary hyperparathyroidism, which could be associated with low BMD. However, in some other studies, serum phosphorus was not found to be associated with BMD [22,24]. One of these was among patients with primary hyperparathyroidism, where the effect of high PTH might have overwhelmed effect of other factors [22].
The population frequency of different genotypes of Fok1, as reported from India [5,25-28] and from the other countries [3,29,30], was similar to the present study. However, there is more heterogeneity in population distribution of Bsm1 genotypes than with Fok1 [26]. There was a trend towards a higher frequency of Ff and BB genotypes and a lower frequency of bb genotype among the cases, which did not reach statistical significance. In a similar study from Delhi, it was reported that the only factors associated with osteomalacia were sunshine exposure and dietary calcium intake, PTH and VDR gene polymorphisms (Bsm1 or Fok1) showed no association [14].
BMI was found to be higher among participants with BB genotype. This finding can be a chance occurrence due to small sample size. However, a study from Delhi also found higher BMI in BB genotype of Bsm1 than Bb and bb [6]. Vitamin D alters expression of an Uncoupling Protein (UCP3) and vitamin D supplementation has been shown to prevent obesity in animal experiments [31]. However, data on humans is not robust enough to draw any conclusions.
Serum biochemical indices, suggestive of physiological effect of vitamin D deficiency were also not found to be different among the Bsm1 and Fok1 genotypes. Similar lack of difference has been reported from Delhi among the Bsm1 and Fok1 genotypes [6], among healthy males and females. Only subtle manifestations of vitamin D deficiency were studied but not the patients with overt rickets or osteomalacia, who are likely to have more pronounced abnormalities.
There is no association found between BMD and of any of the Fok1 genotypes, similar to what was reported from Delhi [6]. Similar results were also shown by some European [2,32,33] and other studies. However, a study from Mumbai reported higher BMD at spine and hip for FF genotypes than those with ff [4]. Reason for this disparity might be population specific effects of the VDR genotype or small sample size.
Among Bsm1 genotypes, only Bb genotype was found to have association with BMD lumbar spine (L2, AP view). A study from Egypt [8] reported that BB and Bb genotypes had lower BMD at lumbar spine and femur compared to bb. Another study from Mumbai [4] also reported the same results, but the study from Delhi [6], did not report any association of areal BMD at any of the studied sites with genotypes of Bsm1.
Limitation(s)
This is the first study to the best of our knowledge, to assess the effect of VDR polymorphisms among participants with vitamin D deficiency, while including both, the symptomatic, as well as the asymptomatic participants. The shortcoming of the study is small sample size, because of which many interesting trends could not be reported with certainty.
Conclusion(s)
Among the vitamin D deficient participants, Bsm1 (Bb) polymorphism was associated with higher BMD at lumbar spine. Bsm1 polymorphism was also found to be associated with BMI. However, VDR polymorphisms (Bsm1 and Fok1) were not associated with subtle clinical or biochemical manifestations of vitamin D deficiency.
Data given as median (IQR); *Significance- <0.05; Mann-Whitney U test
BMI: Body mass index; 25(OH)D: 25 hydroxy vitamin D; iPTH: intact parathormone; BMD: bone mineral density given as T score. Reference range: Serum 25(OH)D >20 ng/mL; Plasma iPTH 13-55 pg/mL; Serum calcium 8.5-10.5 mg/dL; Serum phosphorus 2.5-4.5 mg/dL Serum alkaline phosphatase- 40-90 IU/L; Serum albumin 3.4-5.4 g/dL; Serum creatinine <1.5 mg/Dl
Data given as Mean±SD; *Significance- <0.05, BMD- bone mineral density given as T score. BMI: Body mass index, 25(OH) D- 25 hydroxy vitamin D, iPTH: Intact Parathormone; Reference range: Serum 25(OH) D >20 ng/mL; Plasma iPTH 13-55 pg/mL
Data given as Mean±SD; *Significance- <0.05;
BMI: Body mass index; 25(OH) D- 25 hydroxy vitamin D; iPTH: Intact parathormone; BMD: Bone mineral density given as T score
Reference range: Serum 25(OH) D >20 ng/mL; Plasma iPTH 13-55 pg/mL
*Significance- <0.05; iPTH: Intact Parathormone; BMD: Bone mineral density given as T-score; Reference range: Plasma iPTH 13-55 pg/mL; Serum alkaline phosphatase- 40-90 IU/L; Serum phosphorus 2.5-4.5 mg/dL