Introduction
Vision is more precious than anything else as it helps us to look at the world. Imagine how hard it would be to see the world if we start losing our eyesight. But, humans are susceptible to a variety of common retinal eye diseases [1] such as age-related macular degeneration, diabetic retinopathy, glaucoma, retinoblastoma, and cataract. Early detection of these diseases is necessary to preserve the delicate organs like eyes. Prior detection can be helpful to possibly cure the disease. Disease undetected over a more extended period results in blindness.
Glaucoma is one of the major eye diseases. It is the second leading cause of preventable blindness [2]. Glaucoma is also known as “Silent Thief of Sight,” because once sight is lost, it cannot be recovered. It most often occurs in people over the age of 40, young adults, and children [3]. In African-Americans glaucoma usually occurs at an earlier age and with greater loss of vision. Glaucoma usually causes no symptoms and warnings. Regular eye examinations are more helpful for diagnosis of this disease.
According to the World Health Organisation (WHO), glaucoma is responsible for approximately 5.2 million cases of blindness worldwide (15% of the total burden of world blindness) [4] and will increase to 11.2 million people by 2020. Around the world, 60 million people have glaucoma of which 2.4 million new cases are reported every year. According to the research, 90% glaucomatous cases were unaware of their diagnosis [5].
Glaucoma damages the optic nerve. The optic nerve supplies visual information to the brain from the eyes. Glaucoma is caused due to an abnormal increase of Intra-Ocular Pressure (IOP) inside drainage system of the eyes. Aqueous humour flowing inside the eye, creates pressure on internal surface of the eye. Normal IOP ranges between 12 to 22 mm of Hg. If increased IOP range is above 22, the eye is set to be affected by glaucoma [6].
During initial stage peripheral vision is lost; if not treated at the correct time it will directly lead to permanent vision loss.
Types, Symptoms, and Risk of Glaucoma
Glaucoma has five different categories. They are the following [7]:
Primary open angle glaucoma
Angle-closure glaucoma
Normal tension glaucoma
Congenital glaucoma
Secondary glaucoma
The two most common types being primary open angle glaucoma and angle-closure glaucoma.
A. Primary Open Angle Glaucoma
Primary Open Angle Glaucoma (POAG) has a wide-open angle between the iris and cornea. It is also known as “primary or chronic glaucoma” [7]. The normal drainage system gets blocked partially and causes an increase in IOP. It usually affects primary vision with sight gradually being lost towards the center of the eye.
Symptoms:
In the early stage there are no signs.
Gradually as time increases it can cause mild pain in the eye.
Side vision loss may occur in a gradual manner.
Night vision loss.
Risk:
Patients who have a family history of glaucoma.
African Americans.
Patients who have myopia and diabetes.
People over 35 years of age.
B. Angle-closure Glaucoma
Angle-closure glaucoma has closed or narrow-angle between the iris and cornea [7]. It is also known as “acute glaucoma or narrow-angle glaucoma.” The drainage canal of the eye becomes suddenly blocked due to which pressure rises within the inside of retina at a quick rate. Complete blindness can occur in 3 to 5 days.
Symptoms:
Severe pain.
Pressure over the eye.
Cloudy cornea.
Eye extremely sensitive to light.
Lights around halos seen.
Nausea or vomiting.
Risk:
Same as POAG.
C. Normal Tension Glaucoma
It is also called “less-tension or normal-pressure glaucoma.” This type of glaucoma occurs when there is damage to the optic nerve without an increase in IOP. Normal Tension Glaucoma (NTG) has the same characteristics as POAG [7].
Symptoms:
In the early stages there are no signs.
With increasing time there is mild pain in the eye.
Lights around halos appear.
Gradually there is loss of side vision.
Risk:
Patients who have a family history of NTG.
People of Japanese ancestry.
People having a history of systemic heart disease.
D. Congenital Glaucoma
It is also referred to as “childhood glaucoma, paediatric or infantile glaucoma.” This type of glaucoma is common in infants or babies. Hence, it is also called as children glaucoma. Congenital glaucoma presents as a condition from birth [7]. Congenital glaucoma is mainly of two types:
Primary congenital glaucoma:
Children are born with eye disease conditions such as abnormal development of anterior chamber angles.
Secondary congenital glaucoma:
It is the result of disorders in the eye or body, which may or may not be genetic. Both cases block the normal drainage of fluid from the eye which causes increased pressure in the inside of the eye to consequently cause damage to the optic nerve [7].
Symptoms:
Cloudiness of the cornea due to oedema.
Enlargement of the eye.
Sensitive to light.
Risk:
Genetic consanguinity and affected siblings.
The risk of this type of glaucoma in the second child is approximately 5% and the risk increases to 25% with two affected siblings.
E. Secondary Glaucoma
Usually, this glaucoma develops due to several causes: abnormal deposits of fluid in the eye, uveitis, lens changes, drugs, and haemorrhage. Pigmentary and neovascular glaucoma are examples of secondary glaucoma [7].
Pigmentary glaucoma:
It can develop when tiny pieces of the iris gets broken. These minute particles then can lodge themselves in the normal drainage canals and slowly clog them, leading to an increase in eye pressure [7].
Neovascular glaucoma:
Open angle glaucoma is caused due to abnormal formation of blood vessels on the iris. IOP of eye increases due to formation of new blood vessels which block the fluid exiting through drainage canals [7].
Tools for Diagnosis
Glaucoma is best detected by an ophthalmologist during routine eye examinations. There are several methods used for detecting glaucoma. Main detection tests are:
Estimation of IOP.
Vision assessment.
Damage evaluation of optic nerve part [8].
Effectiveness of treatment can also be ascertained through these tests. Variety of tools are used to examine the different factors for glaucoma diagnosis discussed in [Table/Fig-1].
Glaucoma diagnostic tools.
| Name of the test | Factors examined |
|---|
| a) | Tonometry | Measurement of eye pressure (IOP) |
| b) | Gonioscopy | Determine the angle where the iris meets the cornea |
| c) | Perimetry | Determine visual field |
| d) | Ophthalmoscopy | Evaluation of optic nerve (shape and colour) |
| e) | Pachymetry | Measurement of corneal thickness |
| f) | Slit lamp examination | Evaluation of illumination |
| g) | Stereo disc photography | Abnormal cupping in the ONH determination |
| h) | Stratus OCT | Measurement of the retinal nerve fiber layer |
It is not necessary to conduct all of these tests on every patient, during each visit. The primary objective is to determine if glaucoma damage has progressed over time.
Causes of Glaucoma
IOP in retina increases due to improper balance between the amounts of internal fluid called aqueous humour and the amount that drains away through the channels in iris. The ONH gets damaged because IOP increases and it leads to sight loss. It causes the pressure in the eye to rise which cannot always be predicted. However, one or more factors may play a role [9].
✓ Eye drops.
✓ Drainage of the eye is blocked or restricted.
✓ Medications.
✓ Optic nerve blood flow is reduced.
✓ Blood pressure is high.
Treatment of Glaucoma
Glaucoma treatment aims to reduce IOP to prevent any further eye sight loss. Typically, a doctor will begin treatment with prescription eye drops [9]. If these don’t work or more advanced therapy is needed, the doctor may suggest one of the following procedures:
Medications: Available forms are eye drops or pills.
Laser surgery: It can reduce the need for medications.
Filtration surgery: Creates a new drainage channel.
Laser irdotomy: A small hole to slice the iris.
Prevention of Glaucoma
Glaucoma is a major leading cause of vision loss, affecting nearly 60 million people. Glaucoma cannot be cured, but it is an early preventable disease to begin treatment from getting worse. It was initially thought that lifestyle prospect does not play a role. Different recent studies show that lifestyle factors can influence eye pressure, which is a significant risk factor for the disease [9]. In general, an age-wise eye checking for glaucoma should be done:
Younger than age 40: every two to four years
Age between 40 and 54: every one to three years
Age between 55 and 64: every one to two years
Age 65 and above: every six to 12 months
List of activities that may help reduce the risk of losing vision from glaucoma.
Exercise regularly by doing physical activities such as walking, swimming, or working in the yard.
Maintain a healthy body weight.
Eat fruits and vegetables, especially green, leafy ones.
It is better to drink tea instead of coffee. High amounts of caffeine may increase eye pressure.
Consider taking a magnesium supplement. It improves circulation and seems to have a beneficial effect on glaucoma patients’ vision.
Avoid inverted postures in yoga. Head-down positions can increase eye pressure.
Avoid neckties. Too-tight necktie may increase blood pressure inside the eyes.
For people of African American origin, taking prescription eye drops could reduce the risk of getting glaucoma by half.
Fundus Image Features for Glaucoma
Fundus imaging is used in primary healthcare widely. Fundus photography is performed by a fundus camera which consists of a low power microscope with an attached camera. It is designed to capture an image of the posterior pole of the eye as well as the whole retina. Fundus image features are retina, Optic Disc, Optic Cup, and blood vessels which are used to diagnose glaucoma effectively [10].
Retina: Light sensitive membrane of the retina lines the inner surface of the back of the eye. The lights are focused on the cornea and lens and is received by photoreceptor cells in the layer. Then it is converted into neural electrical signals which are transported to visual centres in the brain, by way of the optic nerve.
Optic disc: It is sometimes called as ONH because nerve head is enters the eye from brain. Optic Disc (OD) is a circular area where the optic nerve connects to the retina [10]. Typically appears as a brighter yellowish or white colour area and also large blood vessels are found in the vicinity of the OD. This disc is known as the “anatomical blind spot” because it contains no photoreceptors.
Optic cup: OD has a central region called the “Optic Cup (OC)” [10] which is usually quite small, about one-third the size of the OD in normal patients’. It consists of a bright region of whiteness with a direct/indirect bend with the blood vessel.
Blood vessels: The major branches of the retinal vessels originate from the center of the OD to the four quadrants of the retina [10].
Retinal Fundus Image Databases
Glaucoma feature detection methodologies are tested on various publicly available datasets, for example, DRIONS, DRIVE, STARE, DHRISTI-GS1, MESSIDOR, ORIGA, RIM-ONE, HRF, DIARETDB0, and DIARETDB1. This section provides a summary of these datasets.
DRIONS: Digital Retinal Images for Optic Nerve Segmentation dataset images are collected from Ophthalmology Service at Miguel Servet hospital, Spain. It deals explicitly with the segmentation of the ONH in fundus images [11]. It provides 110 colour retinal images; 50 images are standard retinal images, remaining 60 images suggest diseases of glaucoma. Image size and resolution are 600×400 and 8 bits/pixel. Image Format is JPEG.
DRIVE: Digital Retina Images for Vessel Extraction database images are obtained from an eye screening research program in the Netherlands [12]. It enables research on the segmentation of blood vessels in the retinal image. Dataset consists of 40 pictures. These images have been divided into two groups, a training set, and a test set, each group has 20 images. Image size is 565×584 pixels and Field of View (FOV) is 45°. Image Format is TIF.
STARE: Structured Analysis of the Retina dataset is funded by the US National Institutes of Health. STARE database contains 400 fundus images [13]. Among these, 40 images are blood vessels annotated and 80 images are ONH is localised. The sizes of all images are 700×605 pixels and FOV is 35°.
DHRISTI-GS1: The images in the Drishti-GS dataset are collected and annotated by Aravind Eye Hospital, Madurai, India. This dataset has been created for glaucoma validation for segmenting OD, and OC [14]. It consists of a total of 101 images. These are divided into 50 training and 51 testing images. All dataset images FOV is 30° and of dimensions 2896×1944 pixels and PNG uncompressed image format.
MESSIDOR: Messidor dataset contains 1200 images, acquired by three ophthalmologic departments with a 45 degree FOV. The 1200 images are packaged in three sets and sizes of images are 1440*960, 2240*1488 or 2304*1536 pixels. For each image, retinopathy grade and risk of macular oedema diagnosis are provided by the medical experts [15].
ORIGA: Online Retinal Fundus Image Dataset for Glaucoma Analysis and Research images are acquired through the Singapore Malay Eye Study (SiMES) [16]. An extensive collection of image signs, critical for glaucoma diagnosis are annotated. This dataset consists of 650 images, which include 168 glaucomatous and 482 randomly selected non-glaucoma photos [16].
RIM-ONE: Open Retinal Image Database for Optic Nerve Evaluation database [17] was developed by three hospitals namely Hospital Universitario de Canarias, Hospital Clínico San Carlos [18] and Hospital Universitario Miguel Servet. The purpose of this database is to design an automated software system that supports glaucoma diagnosis. This database consists of 169 images including standard 118 images, early glaucoma (12 images), Moderate Glaucoma (14 images) and ocular hypertension (OHT-11 images). The image format is BMP.
HRF: High-Resolution Fundus image database is provided by Pattern Recognition Lab (CS5). It was created to support studies on automatic segmentation algorithms on retinal fundus images [19]. This dataset contains at the moment 15 images of healthy patients, 15 images of patients with diabetic retinopathy and 15 pictures of glaucomatous patients.
DIARETDB0: This dataset contains 130 images which were acquired from the Kuopio University Hospital in Finland with 50° FOV. Among 130 fundus images, 20 were standard images and 110 images exhibited signs of diabetic retinopathy.
DIARETDB1: It is a DIAbetic RETinopathy DataBase calibration level [20]. These images were acquired from the Kuopio University Hospital in Finland. This dataset [21], consists of 89 colour fundus images including 84 images with diabetic retinopathy and 5 images are normal. A digital fundus camera captured the images with 50° FOV.
Image Processing Detection Methods
The general flow diagram for the detection process of glaucoma is shown in [Table/Fig-2]. In this section different steps of Glaucoma detection process are discussed.
Generic process for automatic glaucoma detection.
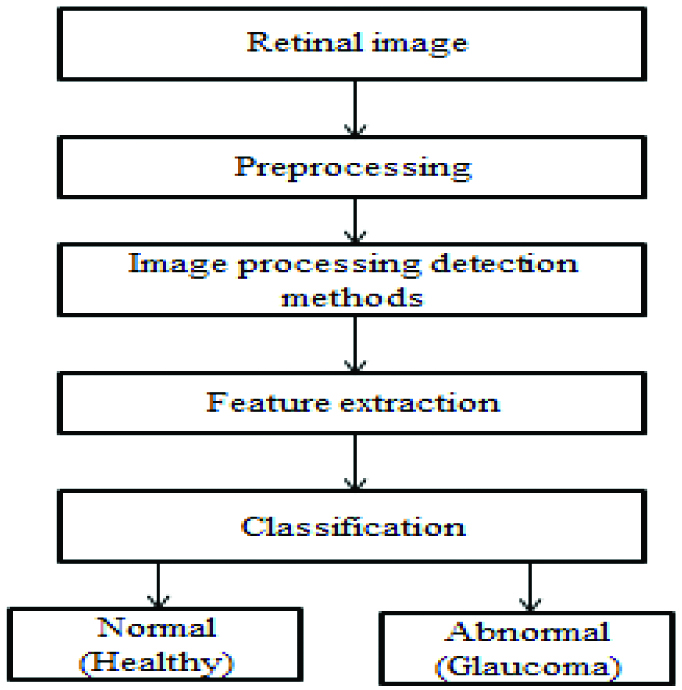
STEP 1: Collecting the database. Retinal images can be taken from the hospital (local) or are available online from database like DRIONS, RIM-ONE, STARE, DRIVE, HRF, etc.
STEP 2: This step involves the preprocessing of data. The primary motive of preprocessing is an improvement of the image that suppresses distortions or enhances some image feature which is essential for further processing steps, although geometric transformation of images (example rotation, scaling and translation) are classified under preprocessing methods. Most commonly used different preprocessing methods have been discussed below:
Separation of RGB channel: These channels are termed as Red, Green, and Blue (RGB) channels and also a gray channel, which is further used for the enhancement of features from the picture [21].
Image enhancement: It includes varying brightness, contrast improvement, and edge sharpening of the image [22]. It also provides filtering and histogram equalisation. It comes under the preprocessing step to enhance various features of the retinal picture.
Histogram equalisation: It is defined as a process which can be used for modifying image intensities to improve the contrast [23].
Noise removal: Noise means, the pixels in the image show different intensity values instead of actual pixel values obtained from the image. Noise removal is a process of removing or reducing the noise from the picture [24,25].
Image resizing: The process of the interpolation is performed by resizing of an image. It is a process which resamples the image to determine values between defined pixels [26]. Thus, the resized image contains more or fewer pixels than that of an original image. The intensity values of additional pixels are obtained through interpolation if the resolution of the model is increased.
Fractal analysis: Fractal analysis is a process where the vital parameter is the colour of the image [27]. Fractal dimension is an automatic identification for all levels of the chosen channel of colour information, i.e., Red, Green, Blue, Hue, Saturation, etc.
STEP 3: The image processing techniques such as morphology, image registration, fusion, segmentation, feature extraction, and classification are used for early and automatic detection of glaucoma. These have been briefly described as follows:
Morphology
The word ‘Morphology’ is derived from the Greek word morphe, meaning shape or form. Set of image processing non-linear methods characterise the image by shapes [28]. These methods use a different structuring element as a mask in the input image which results in the same size output image. The structuring element has a matrix that consists of only 0’s and 1’s that can have any arbitrary shape and size [29]. Basic morphological operations used are dilation and erosion.
Image Registration
Currently, image registration is an essential technique for the detection and diagnosis of eye diseases [30], because retinal images are captured under different conditions at different times and angles. Two or more such images are joined together for further processing which is called image registration.
Image Fusion
It is a process of combining information acquired from the number of imaging devices. Its goal is to reduce the amount of data to identify the object quickly.
Segmentation
Segmentation is a process of dividing/partitioning the image into homogenous, self-consistent regions corresponding to different objects in the picture. It separates the image into meaningful parts. Image segmentation is typically used to detect the object location and boundaries (lines, curves, etc.,) in pictures. Each of the pixels in an area is similar for some characteristic or computed property, such as gray level, colour, intensity, texture, depth or motion. Adjacent pixels are significantly different concerning the same characteristic. Several general-purpose algorithms have been developed for image segmentation. These are the following: Level set, Thresholding, Region growing, Edge detection, Active contour modeling, Principle component analysis, Hough transform and Clustering based approach, etc.
STEP 4: Feature extraction is a low-level image processing operation which is usually performed as the first operation on an image. A feature can be defined as the exciting part of an image. OD, OC, blood vessels are retinal features of glaucoma. The desired property for a feature detector is repeatability. Step edges, lines, and junctions usually convey the most relevant information of an image.
STEP 5: Image classification [31] (whether normal or abnormal/glaucoma) is the analysis done using different features and consolidate the data for the rating as early, moderate, and adverse stages of the disease. There are different types of classifications like SVM, Naïve Bayes, Random forest, Artificial neural network, Thresholding, K-mean clustering classifier and many more depending upon the data used for the analysis.
Survey of Different Detection Techniques
Preprocessing and OD localisation:
Abramoff MD and Niemeijer M, presented a k-Nearest Neighbors (KNN) regression method to detect the approximate location of the OD center. Features like intensity, size, and space were used [32]. This method result was blurred to handle noise. It was tested on 1000 screening images and was able to find the correct position in 99.9% of all cases. Kolar R et al., suggested a method which depends on the fractal analysis followed by the classification of images [33]. For fractal dimensions estimation, two ways were given which explained different image information. Retinal nerve fibers were analysed taken from the colour images of fundus. Retinal 30 images were acquired from the Eye Clinic of MU Dr. Kubena in Zlin. The accuracy of this method is sufficiently high and computationally undemanding, which makes it convenient for clinical usage.
Nyul LG, proposed illumination correction, vessel improvement, and normalisation as a preprocessing step [34], and also suggested a generic method for feature extraction and Support Vector Machine (SVM) as a classifier. Mahfouz AE and Fahmy AS, suggested a method for locating OD center by obtaining two projections of image features that encode the x and y coordinates of the OD [35]. The OD center was located by using retinal vessel orientation and OD brightness.
Lu S proposed an OD detection technique by using circular transformation [36]. Features of shape and brightness of OD region were determined by maximum pixel variation along radial line segments. This proposed method was tested on STARE, ARIA and MESSIDOR datasets and achieved an accuracy of 99.75%, 97.5%, and 98.77% with computational time of 5s.
Dehghani A et al., proposed a new method of identifying the position of OD centre which is essential for vessel segmentation, retinal diagnosis and recognition [37]. They extracted the histograms of each colour component and then calculated the average of histograms for each colour as the template for localising the centre of the OD. They evaluated the proposed algorithm on DRIVE, STARE and collected a local dataset in Razi eye clinic, 64, Keshavarz Blvd, 14188, Tehran, Iran. Overall accuracy achieved was 100%, 91.36%, and 98.9%, respectively.
Pruthi J and Mukherjee S proposed a method for diagnosis of glaucoma by calculating Cup to Disk Ratio (CDR) [38]. The features of cup and disc region were extracted by morphological operations, and ellipse fitting techniques. These methods were tested using 20 retinal images which were obtained from Vitreo Retina Unit, AIIMS, New Delhi, India and Optos, Scotland, UK. The accuracy obtained for this method was 98.12%.
Ramakanth SA and Babu RV proposed a method used as feature match, an Approximate Nearest Neighbour Field (ANNF) algorithm to find the correspondence between the image patches in the query image which was close to the reference image [39]. The likelihood map used to obtain the distribution of pieces in query image was used for OD detection. Shape, Colour, Brightness features used in ANNF method were evaluated on five publicly available DIARETDB0, DIARETDB1, DRIVE, STARE and MESSIDOR databases, with a total of 1540 images to achieve an average detection accuracy of 99% and computation time of 0.2 s per image.
Gopalakrishnan A et al., presented a method to segment the OD from a colour retinal fundus image using edge detection, coarse approximation using circular Hough transform and excellent approximation using curve fitting algorithms [40]. It was applied for the detection of Glaucoma at an early stage. This algorithm was tested on RIGA database of 200 images. But the accuracy of the method was 68%. Agarwal A et al., have proposed an adaptive thresholding method in which features like mean and standard deviation to segment the OD to OC are extracted from the images which are independent of the noise and image quality [41].
Abdullah M et al., proposed a method of morphological operations performed to remove blood vessels and to enhance the OD [42]. Circular Hough transforms used for the approximation of the OD center, and the grow-cut algorithm was employed to segment the OD boundary. The method was evaluated on five publicly available retinal image databases DRIVE, DIARETDB1, CHASE_DB1, DRIONS, ONHSD, MESSIDOR and one local Shifa International Hospital Database to achieve success rate of 100% for all of these databases except 99.09% and 99.25% for the DRIONS, MESSIDOR, and ONHSD databases, respectively. The OD boundary detection achieved an average spatial overlap of 78.6%, 85.12%, 83.23%, 85.1%, 87.93%, 80.1%, and 86.1%, respectively, for these databases.
Wu X et al., worked to build a model for network vessels which forms as a parabolic shape in OD region [43]. OD feature of shape and brightness were used to locate the center effectively. The method was applied on nine publicly available databases such as STARE, ARIA, DIARETDB0, DIARETDB1, MESSIDOR, DRIVE, ROC, ONHSD, DRIONS database and achieved an accuracy of 100% for each database.
Devasia T et al., developed a new method to localise OD in retinal images [44]. This method used morphological operations and edge detection techniques followed by the Circular Hough transform to identify the center location of the OD. This algorithm tested for 549 images from different public datasets and real time images captured from Giridhar Eye Institute, Kochi. The new method achieved an average accuracy of 97.3% for the localisation of OD and this algorithm reduced the processing time and cost.
Muhammed LAN suggested an algorithm that has recursive steps for testing the entropy of different patches in the image; a non-overlapping and overlapping sliding window technique was used to extract OD patches in a specific way [45]. The results of practical work were obtained using different common datasets such as CHASEDB, DRIONS, DRIVE, DIARETDBI, Special dataset of 35 retinal images was taken from medical model and signal processing research center, which achieved good accuracy with less computation time.
Gui B et al., proposed a method to view the fast disc location method based on improved Corner Detection algorithm to avoid the complicated problem of vessel segmentation [46]. In the corner points distribution of retinal images, the candidate points of OD corner were extracted by the simplified FAST corner extraction algorithm. The above experiments showed that the algorithm has a better localisation effect on standard images and retinal images with mild lesions. In general, the detection efficiency was better and proved the feasibility of corner detection algorithm in OD localisation.
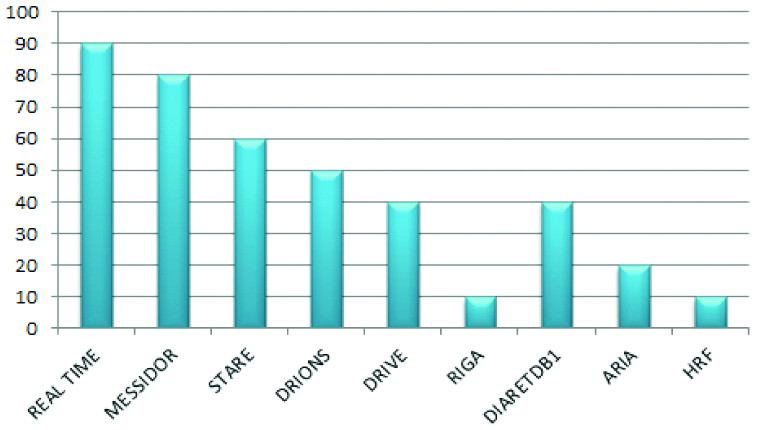
In the survey, various databases used by researchers in the past shown in [Table/Fig-3].
Survey of databases used by researchers in the past.
Optic Cup and Optic Disc segmentation:
Several researchers have reported in the last few years on the detection and classification of glaucoma. Summary of various OC and OD segmentation methods is shown in [Table/Fig-4] [32-46]. Noronha K et al., found the brightest circular part of the fundus and applied Hough transform to determine the OD and its center [47]. Xu J et al., proposed a technique that modified the original snake technique; used to find the boundary of cup and disc [48]. Balasubramanian M et al., developed a new framework for Proper Orthogonal Decomposition (POD) method to detect the changes in the ONH of an eye [49]. This framework captured the instrument measurement variability and inherent structure variability thus improving the ability to detect glaucomatous change over time.
Summary of various preprocessing and OD localisation approaches [32-46].
| Year/author | Database | Preprocessing | OD localisation | Benefits | Drawbacks |
|---|
| 2006/Abramoff MD and Niemeijer M. [32] | 1000 test images collected by screening programs in the Netherlands | NA | KNN regression model | Fast (30s) and easier to optimise | Detection failed because of vessels edge usually due to low contrast. |
| 2008/Kolář R and Jan J [33] | 30 retinal images collected by Eye Clinic of MU Dr. Kubena in Zlin. | Fractal analysis | NA | Accuracy sufficiently high | Low linear dependency |
| 2009/Nyul LG [34] | Erlangan glaucoma registry. | Illumination correction and Vessel removal. | Principal Component Analysis | Automatic detection method | It provides better understanding of glaucoma but method performance is poor |
| 2010/Mahfouz AE and Fahmy AS [35] | STARE and DRIVE. | Image resizing | Model based method | Less computation time and search space dimensionality is reduced | It is expensive. Robustness for localisation of OD is difficult |
| 2011/Lu S [36] | STARE, ARIA and MESSIDOR. | Down sampling. | B-Spline Filtering | Algorithm runs faster and also accuracy gets improved | OD segmentation may introduce error. OD boundary pixels cannot be determined based on symmetry. |
| 2012/Dehghani A et al., [37] | DRIVE, STARE, and a local dataset including 273 retinal images. | Average filter, separate colour components. | Histogram matching | Simple technique | Retinal images have other pathological regions with high number of vessels, this method failed to localise OD center. |
| 2013/Pruthi J and Mukherjee S [38] | Batch of 20 images obtained from Vitreo Retina Unit, AIIMS, New Delhi, India and Scotland, UK. | Illumination Correction, blood vessel and noise removal. | NA | The computed Cup/Disc ratio values show good compatibility | The method fails for some images as other pathologies are present. |
| 2014/Ramakanth SA and Babu RV. [39] | DIARETDB0, DIARETDB1, DRIVE, STARE and MESSIDOR. | RGB channel separation | Approximate Nearest Neighbor Field (ANNF) | Performance is good (99% accuracy) and less computation time | Due to anomalies in retinal images, the localisation may not always converge around the correct OD location |
| 2015/Gopalakrishnan A et al., [40] | 200 images for RIGA dataset | RGB channel separation and vessel removal | Circular Hough transform | Robustness is high | Accuracy is less |
| 2015/Agarwal A et al., [41] | 110 images Local database (Venue Eye Research Centre, New Delhi) | Red, Green and Blue channel extraction. | Adaptive thresholding | Efficient method and detection speed is high | Artifacts other than OD cannot be handled by this method |
| 2016/Abdullah M et al., [42] | DRIVE, DIARETDB1, ONHSD, DRIONS, MESSIDOR and Shifa International Hospital (Pakistan). | Morphological operations. | Circular Hough transform | Computationally fast in processing, robust variation in image contrast and illumination, works well in pathological retinal images | Detection speed is low. |
| 2016, Wu X et al., [43] | STARE, ARIA, DIARETDB0, DIARETDB1, MESSIDOR, DRIVE, ROC, ONHSD, and DRIONS. | NA | Relaxed biparabola directional model | Achieves a high accuracy rate | Detection has failed to extract OD for low contrast images |
| 2018/Devasia T et al., [44] | DRIVE, DRIONS, HRF, DIARETDB0, DIARETDB1, and Local database acquired from Gridhar Eye Institute, Kochi | Morphological operations and edge detection techniques. | Circular Hough transform | This technique works pretty well even though the input image is in a low contrast condition | Processing consistency needs to be improved |
| 2018/Muhammed LAN [45] | DRIVE, CHASEDB, DRIONS-DB, DIARETDBI, and special dataset of 35 retinal images. | Green channel extraction | Entropy Based Algorithm | There is no need for any preprocessing enhancement steps for OD center detection, and simple technique. | Not suited for less illuminated images |
| 2018/Gui B et al., [46] | DRIVE, STARE and MESSIDOR | RGB channel separation, gray conversion and histogram equalisation. | Corner detection algorithm | Detection efficiency is better | The STARE database, OD location accuracy is relatively low, because the image contains more serious lesions destroyed. |
Vahabi Z et al., proposed Sobel filtering, texture analysis, intensity and template matching methods as filtering method to detect OD [50].
Yavuz Z performed a method for applying Gabor filter to enhance the blood vessels and then subject a Top-hat transform to detect the blood vessel [51]. Finally, this output was converted into a binary image with p-tile thresholding. Dey NJ determined CDR using Harris corner detector [52]. It was based on the local auto-correlation function of a signal. Cheng J et al., presented a super pixel classification method to detect the optic disc and cup [53].
Naz S and Rao SN proposed a method in which the anisotropic filtering process was performed to eliminate noises [54]. The disc was extracted using three techniques, i.e., the edge detection method, optimal thresholding method, and manual threshold analysis. Agarwal A et al., have proposed an adaptive thresholding method to segment the OD to OC from the retinal images [41].
Gopalakrishnan A et al., proposed a technique to segment the OD using Circular Hough transform and curve fitting boundary from the retinal images [40]. Ayub J et al., had suggested a method of K-mean clustering to detect the OD and Cup [23]. After that, ellipse fitting techniques were used for smoothening the boundary of OC and OD. Abdullah M et al., proposed a method of Circular Hough transform using the approximation of the OD center, and the grow-cut algorithm was employed to segment the optical disc boundary [42].
Devasia T et al., developed a new method that used morphological operations and edge detection techniques followed by the Circular Hough transform to identify the center location and boundary of the optic disc [44].
The segmentation performance was improved by approximating the optic cup region by ellipse fit model. Jaikla C and Rasmequan S proposed a maximally stable external regions technique. This research method automatically identifyied the position of Optic Disc and Cup on low contrast Retinal Fundus images [55]. [Table/Fig-5] shows summary of various segmentation approaches and performance metrics [23,27,47-55].
Summary of various segmentation approaches and performance metrics used [23,27,40-42,44,47-55].
| Year/Author | Segmentation | OD | OC | Performance metrics |
|---|
| 2006/Noronha K et al., [47] | Circular hough transform | Yes | No | _ |
| 2007/Xu J et al., [48] | Snake technique | Yes | Yes | Accuracy |
| 2009/Balasubramanian M et al., [49] | Proper orthogonal decomposition | Yes | Yes | Image Euclidean distance and Sensitivity |
| 2010/Vahabi Z [50] | Model based methods | Yes | Yes | _ |
| 2011/Yavuz Z [51] | Tophat transform | Yes | Yes | Sensitivity, specificity and accuracy |
| 2012/Dey NJ [52] | Harris corner detector | Yes | Yes | _ |
| 2013/Cheng J et al., [53] | Super pixel classification | Yes | Yes | Overlapping area ratio, specificity |
| 2014/Naz S and Rao SN [54] | Thresholding | Yes | No | Mean square error, pixel signal to noise ratio and signal to noise ratio |
| 2015/Agarwal A et al., [41] | Adaptive thresholding | Yes | Yes | Mean and standard deviation |
| 2015/Gopalakrishnan A et al., [40] | Circular hough transform | Yes | Yes | Overlapping area |
| 2016/Ayub J et al., [23] | K-mean clustering | Yes | Yes | Accuracy and mean square error |
| 2016/Abdullah M et al., [42] | Grow-cut algorithm | Yes | No | Sensitivity, specificity, accuracy, dice score, overlap area ratio and precision |
| 2018/Devasia T et al., [44] | Circular hough transform | Yes | No | Accuracy and scatter plot analysis |
| 2017/Kumar JRH et al. [27] | Kåsa’s circle fitting technique | No | Yes | Sensitivity, specificity, accuracy, precision, jaccard and dice index |
| 2018/Jaikla C and Rasmequan S. [55] | Maximally Stable Extremal Regions | Yes | Yes | Recall, precision, accuracy, true negative rate, true positive rate, false negative rate |
Diagnosing Parameters
Following are the various parameters which need to be identified to diagnose glaucoma:
CDR (Cup-to-Disc Ratio)
CDR is the ratio of the cup to disc horizontal length, vertical length and area given by equation 1, 2 and 3 respectively. If the rate is 0.3 or less, the eye is considered as a normal eye [56]. But if the ratio exceeds 0.3, the eye is under the threat of abnormality (Glaucoma affected eye). As the cup/disc size increases, it also changes the Neuro Retinal Rim (NRR).
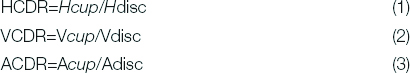
Where,
HCDR is the Horizontal Cup Disc Ratio, Hcup is the Horizontal length of the OC, and Hdisc is the Horizontal length of the OD, VCDR is the Vertical Cup Disc Ratio, Vcup is the vertical length of the OC, and Vdisc is the vertical length of the OD. ACDR is the Area Cup Disc Ratio, Acup is an area of the OC, and Adisc is an area of the optical disc.
NRR (Neuroretinal Rim Ratio)
NRR is used to classify whether the retinal image is glaucomatous or non-glaucomatous by finding the area of nasal, temporal, inferior and superior region. If the area ratio covered by NRR in nasal and temporal is thicker than area covered by NRR in inferior and superior region, then that input image is considered as glaucomatous image [57].
ISNT (Inferior Superior Nasal Temporal) Rule
ISNT rule is the ordering of rim area of inferior, superior, nasal and temporal regions in order as given in eqn. 4. The normal eye follows the sight which follows this behaviour is considered as standard while others as abnormal.

Here, I is Inferior, S is superior, N is nasal, and T is temporal area.
DDLS (Disk Damage Likelihood Scale)
DDLS is the scale which calculates disc damage likelihood, i.e., the severity of disease and is estimated as given equation 5.
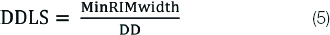
Here, DDLS is disk damage likelihood, MinRIMwidth is a minimum width of rim and DD is disc diameter.
GRI (Glaucoma Risk Index)
GRI is the combination of various principal components and is calculated as given equation 6.

Here, GRI is glaucoma risk index and PC1 to PC5 are principal components calculated using Principal Component Analysis (PCA). If the range of GRI is (8.68±1.67) eye is considered normal, and if the scale is (4.84±2.08), the eye is considered as abnormal.
PPA (Parapapillary Atrophy)
PPA is a crescent-shaped part that consists of an alpha-zone and beta-zone. Alpha zone is not affected by glaucoma. Beta zone is changed more frequently in patients with glaucoma, which has the characteristic white colour. Both types of PPA are located outside the area of the disc.
RNFL (Retinal Nerve Fibre Layer)
It looks like a bunch of fibers that distribute colored light evenly on the normal eye. In the normal eye RNFL is seen in the inferior temporal area, followed by superior temporal, superior nasal and inferior nasal areas. RNFL is observed by ophthalmoscopy and full angle photos without the red color.
Performance Metrics
In medical image processing, the sensitivity and specificity measures are widely used for diagnosis purpose. This section evaluates the performance results shown [Table/Fig-6].
Performance metrics validation.
| PREDICTED CLASS |
|---|
| ACTUAL CLASS | Test outcome | Class=Yes | Class=No |
| Class=Yes | True Positive | False Negative |
| Class=No | False Positive | True Negative |
This outcome both existing (ground truth image) and proposed (segmented image) techniques images can be used to validate regarding accuracy, sensitivity, specificity, precision, fscore, gmean, jaccard, and dice index, overlap, and nonoverlap area ratio.
◯ True Positive (TP)-Sick people correctly identified as sick.
◯ True Negative (TN)-Healthy people are correctly identified as healthy.
◯ False Positive (FP)-Healthy people are incorrectly identified as sick.
◯ False Negative (FN)-Sick people are incorrectly identified as healthy.
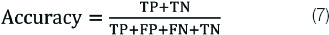
Accuracy (A)
The accuracy of the diagnostic test can measure how correctly a diagnostic test identifies and excludes a given condition. It is calculated as follows given by equation 7.
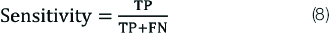
Sensitivity (S)
Sensitivity is also known as the recall, hit rate or True Positive Rate (TPR). It refers to the test’s ability to accurately detect ill patients who have the disease. Mathematically, this expressed as given by equation 8:
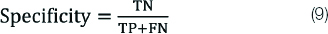
Specificity (Sp)
Specificity is also called the selectivity or True Negative Rate (TNR). It relates to the test’s ability to reject healthy patients without a condition correctly. Mathematically, this is expressed as given by equation 9:
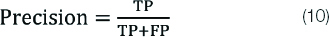
Precision (P)
Precision is also called positive predictive value. It is the ratio of correctly predicted and the total predicted positive observations. It can br obtained by equation 10.
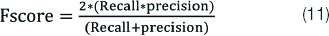
F Score (F)
The F score or F1 score is a measure of a test’s accuracy and is defined as the weighted harmonic mean test of the precision and recall. It can be obtained by equation 11.
G Mean (G)
G mean or geometric mean is the square root product of sensitivity and specificity. It ca be obtained by equation 12 as follows.

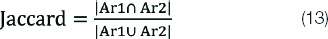
Jaccard Index (J)
Jaccard index is defined as the intersection between the union of two objects; its value varies from 0 to 1. If the value is 1, the two objects are identical, and their sets have no common regions. It can be calculated as a ratio of segmented image (Ar1) and gold standard image (Ar2) as given by equation 13:
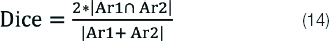
Dice Index (D)
Dice index is a metric which is used to compare the similarity between two fields, i.e., segmented area and ground truth. It can be calculated as given by equation 14:
Overlap Area Ratio (O)
The overlap area ratio is the metric which assesses how well the segmented area matches the actual ground truth area and is given by equation 15 as follows:

Non Overlap Area Ratio (N)
The non-overlap area ratio is the metric which assesses the dis-similarity between segmented area and ground truth area and is given by equation 16 as follow:

Conclusion(s)
In this review paper, basic history of Glaucoma, types, symptoms of glaucoma and their leading causes, disease diagnosis tools, various treatment methods used by ophthalmologists are discussed and also how to prevent glaucoma at early and later stages are overviewed elaborately. From the review of the above papers and different features, it can be concluded that many different techniques, and diagnosing parameters can be used to detect glaucoma using different fundus features. These techniques will be of great help in the medical field to detect glaucoma at early stages. It requires fewer data and expertise to test. Finally we have discussed, detection data validated by the different performance analysis to verify their outcomes effectively. Early detection of glaucoma can save a person from blindness.
[1]. Bhadra AA, Jain M, Shidna S, Automated detection of eye diseasesIEEE International Conference on Wireless Communications, Signal Processing and Networking (WiSPNET) 2016 :1341-45.10.1109/WiSPNET.2016.7566355 [Google Scholar] [CrossRef]
[2]. WHO. World health organization (who).dispon vel em: http://apps.who.int/ghodata/?vid=5200, accessed in October 2014 [Google Scholar]
[3]. P. Rojpongpan (March 2009). Glaucoma is the second leading cause of blindness[Online]. Available: http://www.manager.co.th/QOL/ViewNews [Google Scholar]
[4]. Quigley HA, Number of people with glaucoma worldwideBr J Ophthalmol 1996 80(5):389-93.10.1136/bjo.80.5.3898695555 [Google Scholar] [CrossRef] [PubMed]
[5]. Sakata K, Sakata LM, Sakata VM, Santini C, Hopker LM, Bernardes R, Prevalence of glaucoma in a south brazilian population: Projeto glaucomaInvestigative Ophthalmology and Visual Science 2007 48(11):4974-79.10.1167/iovs.07-034217962447 [Google Scholar] [CrossRef] [PubMed]
[6]. Nath MK, Dandapat S, Techniques of glaucoma detection from color fundus images: A ReviewInternational Journal Image, Graphics and Signal Processing 2012 :44-51.10.5815/ijigsp.2012.09.07 [Google Scholar] [CrossRef]
[7]. Gorasia S, Anwar RA, Review paper on detection of glaucoma using retinal fundus imagesInternational Journal for Research in Applied Science & Engineering Technology (IJRASET) 2016 4(1):166-70. [Google Scholar]
[8]. Sharma P, Sample PA, Zangwill LM, Schuman JS, Diagnostic tools for glaucoma detection and managementAn International Review Journal Survey of Ophthalmology 2008 53(6):S17-32.10.1016/j.survophthal.2008.08.00319038620 [Google Scholar] [CrossRef] [PubMed]
[9]. Weinreb RN, Aung T, Medeiros FA, The pathophysiology and treatment of glaucoma. Clinical review & educationJAMA 2014 311(18):1901doi:10.1001/jama.2014.3192S10.1001/jama.2014.319224825645 [Google Scholar] [CrossRef] [PubMed]
[10]. Sekhar S, Al-Nuaimy W, Nandi AK, Automated localization of optic disk and fovea in retinal fundus imagesProceedings of Signal Processing Conference 2008 :01-05. [Google Scholar]
[11]. Haleem MS, Han L, Hemert JV, Li B, Automatic extraction of retinal features from color retinal images for glaucoma diagnosis: A reviewComputerized Medical Imaging and Graphics 2013 37(7-8):581-96.10.1016/j.compmedimag.2013.09.00524139134 [Google Scholar] [CrossRef] [PubMed]
[12]. Staal J, Abramoff M, Niemeijer M, Viergever M, Ginneken BV, Ridge based vessel segmentation in color images of the retinaIEEE Transactions on Medical Imaging 2004 23(4):501-09.10.1109/TMI.2004.82562715084075 [Google Scholar] [CrossRef] [PubMed]
[13]. Goldbaum M, The STARE Project 2000. [Online]Available: http://www.parl.clemson.edu/~ahoover/stare/index.html. [Accessed 28 July 2013] [Google Scholar]
[14]. Sivaswamy J, Krishnadas SR, Joshi GD, Jain M, Tabish AU, Drishti GS, Retinal image dataset for optic nerve head (ONH) segmentationIn Proceedings of IEEE 11th International Symposium on Biomedical Imaging 2014 :53-56.10.1109/ISBI.2014.6867807 [Google Scholar] [CrossRef]
[15]. MESSIDOR: Methods for evaluating segmentation and indexing technique dedicated to retinal ophthalmology, 2004, http://messidor.crihan.fr/index-en.php [Google Scholar]
[16]. Zhang Z, Yin FS, Liu J, Wong WK, Tan NM, Lee BH, ORIGA-light: An online retinal fundus image database for glaucoma analysis and researchIn Proceedings of the Annual International Conference of the IEEE Engineering in Medicine and Biology Society (EMBC ’10) 2010 :3065-68. [Google Scholar]
[17]. Fumero F, Alayon S, Sanchez JL, Sigut J, Hernandez GM, RIM-ONE: An open retinal image database for optic nerve evaluationProc. 24th Int. Symp. Comput. Med. Syst 2011 :02-07.10.1109/CBMS.2011.5999143 [Google Scholar] [CrossRef]
[18]. Hospital Clínico San Carlos, Madrid, Spain, http://www.madrid.org/cs/Satellite?pagename=HospitalClinicoSanCarlos/Page/HCLN_home [Google Scholar]
[19]. https://lme.tf.fau.de/category/dataset/. [Accessed November 27, 2019] [Google Scholar]
[20]. Kauppi T, Kalesnykiene V, Kamarainen JK, Lensu L, Sorri I, Uusitalo H, DIARETDB0: Evaluation database and methodology for diabetic retinopathy algorithms, machine vision and pattern recognition research groupLappeenranta University of Technology, Lappeenranta. Finland 2006 [Google Scholar]
[21]. Kauppi T, Kalesnykiene V, Kamarainen J, Lensu L, Sorri I, Raninen A, The DIARETDB1 diabetic retinopathy database and evaluation protocolIn Proceedings of the British Machine Vision Conference (BMVC ’07) 2007 :01-10.10.5244/C.21.15 [Google Scholar] [CrossRef]
[22]. Beaula L, Asirvatham M, Kalimuthu T, Earlier Detection of glaucoma using empirical wavelet transformInternational Journal for Research in Applied Science & Engineering Technology (IJRASET) 2017 5:1311-16.10.22214/ijraset.2017.4234 [Google Scholar] [CrossRef]
[23]. Ayub J, Ahmad J, Muhammad J, Glaucoma detection through optic disc and cup segmentation using kmean clusteringInternational Conference on Computing, Electronic and Electrical Engineering 2016 :1252-57.10.1109/ICECUBE.2016.7495212 [Google Scholar] [CrossRef]
[24]. Acharya UR, Eddie YK Ng, Eugene L, Noronha KP, Lim CM, Prabhakar Nayak K, Decision support system for glaucoma using Gabor transformationBiomedical Signal Processing and Control 2015 :18-26.10.1016/j.bspc.2014.09.004 [Google Scholar] [CrossRef]
[25]. AntoBennet M, Dharini D, MathiPriyadharshini M, Detection of blood vessel segmentation in retinal images using adaptive filtersJournal of Chemical and Pharmaceutical Research 2016 8(4):290-98. [Google Scholar]
[26]. Jaikla C, Rasmequan S, Segmentation of optic disc and cup in fundus images using maximally stable extremal regionsIEEE International Workshop on Advanced Image Technology 2018 10.1109/IWAIT.2018.8369788 [Google Scholar] [CrossRef]
[27]. Kumar JRH, Harsha S, Kamath Y, Jampala R, Seelamantula CS, Automatic optic cup segmentation using kasa’s circle fitting techniqueProc. of the 2017 IEEE Region 10 Conference (TENCON), Malaysia 2017 :05-08.10.1109/TENCON.2017.8227830 [Google Scholar] [CrossRef]
[28]. Sakthivel K, Narayanan R, An automated detection of glaucoma using histogram featuresInternational Journal of Ophthalmology 2017 :194-200. [Google Scholar]
[29]. Radhika C, A morphological approach for discrimination between glaucomatous and nonglaucomatous eyes by optic disc localizationInternational Journal of Advanced Research in Computer Engineering & Technology 2102 1(4) [Google Scholar]
[30]. Lee S, Abramoff MD, Reinhardt JM, Reinhardt Validation of retinal image registration algorithms by a projective imaging distortion model29th Annual International Conference of the IEEE EMBSCité Internationale, Lyon, France 2007 :6472-75.10.1109/IEMBS.2007.435384118003507 [Google Scholar] [CrossRef] [PubMed]
[31]. Chandrika S, Nirmala K, Analysis of CDR detection for glaucoma diagnosisInternational Journal of Engineering Research and Applications (IJERA) 2013 :23-27. [Google Scholar]
[32]. Abramoff MD, Niemeijer M, The automatic detection of the optic disc location in retinal images using optic disc location regressionProceedings of the 28th IEEE EMBS Annual International Conference New York City, USA 2006 10.1109/IEMBS.2006.25962217947087 [Google Scholar] [CrossRef] [PubMed]
[33]. Kolář R, Jan J, Detection of the glaucomatous eye via color fundus images using fractal dimensionsRadio Eng 2008 17(3):109-14. [Google Scholar]
[34]. Nyúl LG, Retinal image analysis for automated glaucoma risk evaluationIn Proc. of SPIE 2009 :749710.1117/12.851179 [Google Scholar] [CrossRef]
[35]. Mahfouz AE, Fahmy AS, Fast localization of the optic disc using projection of image featuresIEEE Transactions on Image Processing 2010 19(12):3285-89.10.1109/TIP.2010.205228020550999 [Google Scholar] [CrossRef] [PubMed]
[36]. Lu S, Accurate and efficient optic disc detection and segmentation by a circular transformationIEEE Transactions on Medical Imaging 2011 30(12):2126-33.201110.1109/TMI.2011.216426121843983 [Google Scholar] [CrossRef] [PubMed]
[37]. Dehghani A, Moghaddam HA, Mohammad S, Optic disc localization in retinal images using histogram matchingEURASIP Journal on Image and Video Processing 2012 1:01-11.10.1186/1687-5281-2012-19 [Google Scholar] [CrossRef]
[38]. Pruthi J, Mukherjee S, Computer-based early diagnosis of glaucoma in biomedical data using image processing and automated early nerve fiber layer defects detection using feature extraction in retinal colored stereo fundus imagesInternational Journal of Scientific & Engineering Research 2013 4(4) [Google Scholar]
[39]. Ramakanth SA, Babu RV, Approximate nearest neighbor field based optic disk detectionComputerized Medical Imaging and Graphics 2014 38(1):49-56.10.1016/j.compmedimag.2013.10.00724290957 [Google Scholar] [CrossRef] [PubMed]
[40]. Gopalakrishnan A, Almazroa A, Raahemifar K, Lakshminarayana V, Optic disc segmentation using circular hough transform and curve fitting2nd International Conference on Opto-Electronics and Applied Optics (IEM OPTRONIX) 2015 10.1109/OPTRONIX.2015.7345530PMC4315050 [Google Scholar] [CrossRef] [PubMed]
[41]. Agarwal A, Gulia S, Choudhary S, Dutta MK, Burget R, Automatic glaucoma detection using adaptive threshold based technique in fundus image38th International Conference on Telecommunications and Signal Processing (TSP) 2015 10.1109/TSP.2015.729629526139803 [Google Scholar] [CrossRef] [PubMed]
[42]. Abdullah M, Fraz MM, Barman SA, Localization and segmentation of optic disc in retinal images using circular Hough transform and grow-cut algorithmPeerJ10(4):e200310.7717/peerj.200327190713 [Google Scholar] [CrossRef] [PubMed]
[43]. Wu X, Dai B, Bu W, Optic disc localization using directional modelsIEEE Transactions on Image Processing 2016 25(9):4433-42.10.1109/TIP.2016.259083827416600 [Google Scholar] [CrossRef] [PubMed]
[44]. Devasia T, Jacob P, Thomas T, Automatic optic disc localization in color retinal fundus imagesAdvances in Computational Sciences and Technology 2018 11(1):01-13. [Google Scholar]
[45]. Muhammed LAN, Localizing optic disc in retinal images automatically with entropy-based algorithmInternational Journal of Biomedical Imaging 2018 201810.1155/2018/281516329552029 [Google Scholar] [CrossRef] [PubMed]
[46]. Gui B, Ren-Jun Shuai, Ping Chen, Optic disc localization algorithm based on improved corner detection8th International Congress of Information and Communication Technology (ICICT). Procedia Computer Science 2018 131:311-19.10.1016/j.procs.2018.04.169 [Google Scholar] [CrossRef]
[47]. Noronha K, Nayak J, Bhat SN, Enhancement of retinal fundus Image to highlight the features for detection of abnormal eyesTENCON 2006- 2006 IEEE Region 10 Conference:1-4.10.1109/TENCON.2006.343793 [Google Scholar] [CrossRef]
[48]. Xu J, Chutatape O, Sung E, Zheng C, Kuan PCT, Optic disk feature extraction via modified deformable model technique for glaucoma analysisPattern Recognition 2007 40(7):2063-76.10.1016/j.patcog.2006.10.015 [Google Scholar] [CrossRef]
[49]. Balasubramanian M, Bowd C, Weinreb R N, Zangwill L M, A Framework for detecting glaucomatous progression in the optic nerve head of an eye using proper orthogonal decompositionIEEE Transactions on Information Technology In Biomedicine 2009 13(5):781-93.10.1109/TITB.2009.202015819369163 [Google Scholar] [CrossRef] [PubMed]
[50]. Vahabi Z, The new approach to Automatic detection of optic disc from non-dilated retinal imagesProceedings of the 17th Iranian Conference of Biomedical Engineering (ICBME 2010) 2010 :03-04.10.1109/ICBME.2010.5704960 [Google Scholar] [CrossRef]
[51]. Yavuz Z, Retinal blood vessel segmentation using gabor filter and tophat transformIEEE 19th Signal Processing and Communications Applications Conference (SIU 2011) 2011 :978-1-457710.1109/SIU.2011.592970821935789 [Google Scholar] [CrossRef] [PubMed]
[52]. Dey NJ, Optical cup to disc ratio measurement for glaucoma diagnosis using harris corner 2012 10.1109/ICCCNT.2012.6395971 [Google Scholar] [CrossRef]
[53]. Cheng J, Liu J, Xu Y, Yin F, Wong DW, Tan NM, Classification based optic disc and optic cup segmentation for glaucoma screeningIEEE Transactions on Medical Imaging 2013 32(6):1019-32.10.1109/TMI.2013.224777023434609 [Google Scholar] [CrossRef] [PubMed]
[54]. Naz S, Rao SN, Glaucoma detection in color fundus images using a cup to disc ratioThe International Journal of Engineering and Science 2014 3(6):51-58. [Google Scholar]
[55]. Jaikla C, Rasmequan S, Segmentation of optic disc and cup in fundus images using maximally stable extremal regionsIEEE International Workshop on Advanced Image Technology 2018 78-1-5386-2615-3/1810.1109/IWAIT.2018.8369788 [Google Scholar] [CrossRef]
[56]. Thakur N, Juneja M, Survey on segmentation and classification approaches of optic cup and optic disc for diagnosis of glaucomaBiomedical Signal Processing and Control 2018 :162-89.10.1016/j.bspc.2018.01.014 [Google Scholar] [CrossRef]
[57]. Tan NM, Xu Y, Goh WB, Liu J, Robust multi-scale superpixel classification for optic cup localizationComput. Med. Imaging Graph 2015 :182-93.10.1016/j.compmedimag.2014.10.00225453464 [Google Scholar] [CrossRef] [PubMed]