The AFI is a rapid onset of fever within one week’s duration which is accompanied by symptoms such as muscle and joint pains, headache and chills. It is common in the sub-tropics and tropics and can be caused by diverse pathogens [1,2]. Dengue, malaria and enteric fever are common differential diagnoses in these patients, all of which can show a significant overlap in the clinical presentation and baseline investigative laboratory parameters. Recently, scrub typhus is being increasingly recognised as a major cause of acute febrile illness in India [3]. A host of investigations including serological and microbiological analyses leads to the detection of the pathogen causing disease after which specific treatment is instituted.
In AFI, if a clue to the diagnosis could be obtained from the baseline investigations itself, then significant time delay in diagnosis and costs in performing exhaustive special investigations could be averted. Among the baseline investigations for AFI, complete blood counts using automated haematology analyser, along with Peripheral Smear (PS) examination are performed routinely to detect parasites [4,5]. However, routine screening of PS for every case becomes tedious. Recently, it has been shown that the cell abnormalities sought for on PS examination that helps diagnose parasitic/viral/rickettsial infections can be detected on automated blood cell counters itself from abnormal WBC scattergrams and the flagging system [6]. Following this, only the specific investigation directed by the clue obtained from the automated cell counter can be performed for confirmation. The present study focuses on this aspect.
Recent advances in automated blood cell counting offer new possibilities to analyse leukocyte differentials by fluorescence RNA/DNA staining combined with scattered light intensity [6,7]. Fluorescent technology enables the machine to reliably differentiate normal and abnormal WBC populations [8]. Abnormal patterns in the scatterplots have been generated in the presence of reactive lymphocytosis, malarial parasites, immature granulocytes and circulating blasts [9-11]. Generally, peripheral blood smears are examined in all cases of febrile illnesses. This study aimed to explore whether the abnormal scatterplots can replace a peripheral smear with reasonable accuracy in diagnosing common causes of acute febrile illnesses. A systematic study will enable exploration of the potential use of this function in the differential diagnosis of acute febrile illnesses and improve upon the time and resources spent in a detailed peripheral smear examination. The objectives of this study include differentiation of normal scatterplot patterns from the scatterplot patterns of AFI.
Materials and Methods
This descriptive study was done in the haematology laboratory of Jawaharlal Institute of Postgraduate Medical Education and Research, Puducherry, India between July and August 2018 using a descriptive study design. The clearance of the Institute Ethics Committee was obtained with reference number JIP/IEC/2018/0188.
Inclusion Criteria
K2 EDTA blood samples of cases with acute febrile illnesses (>37.8°C and <1 week duration) as the study samples and samples received in the laboratory with normal counts and differentials and no history of fever as control.
Exclusion Criteria
Inadequate or clotted samples and samples with no scatterplot patterns were excluded.
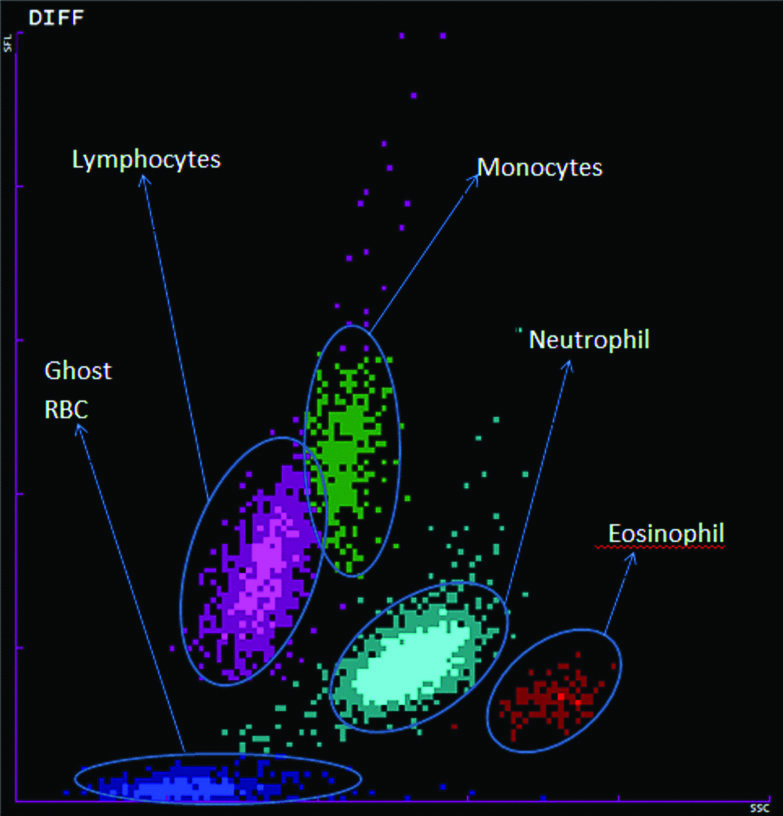
An amount of 2 mL of venous blood was collected in EDTA and analysed in the laboratory by automated haematological analyser (SysmexXT2000i) and the peripheral blood smears studied. The smear was stained by Leishman stain with 2 minutes fixation and 15 minutes staining. On an average, 100 cases of AFI are reported in the laboratory on a daily basis. The present authors assumed that a specified pattern in at least 60% of cases depicts abnormal cell counts and patterns. Using this percentage with 15% relative precision at 95% confidence, limits the sample size needed for this objective as 284. Hence a minimum of 300 cases of AFI had to be examined. A total of 323 samples of AFI and 100 control samples were processed in and simultaneous identification of aetiology by culture and serological investigations was done. The scatterplot patterns of AFI were compared with a scatterplot pattern representative of the control population and with each other [Table/Fig-1].
Different populations of cells in a normal scatterplot pattern.
Study was done on K+ EDTA blood samples received in the laboratory for routine diagnostic tests. No extra blood was collected. The patient’s demographic details were kept anonymous.
Statistical Analysis
The scatterplot pattern was analysed by the instrument which displayed various scatterplots based upon the side scatter, forward scatter and fluorescence values of the white blood cells.
The normal pattern was summarised as frequency percentages and 95% confidence intervals were used. The scatterplots of all acute febrile illnesses were compared with the peripheral smear findings and serological investigations. Taking the peripheral smear findings and/or serology as the gold standard, the sensitivity and specificity of the scatterplot pattern for various causes of AFI were calculated.
Results
A total of 323 cases of acute febrile illness were collected and their simultaneous serology/culture (based on the clinical diagnosis) and complete blood count was done. WBC scatterplot patterns were also generated with the cell counts by the automated Sysmex XT-2000i analyser. The following aetiologies were attributed:
Bacterial-158, Fungal-18, Helminth-1, Viral-17, Tuberculosis-9, Malarial-5, Other Rickettsial infections-1, Enteric fever-2, Culture and serology negative samples-139.
Superimposed bacterial infection was identified in 16 of the 18 fungal positive cases, seven viral, 3 tuberculous and 1 helminth case. For comparison purposes, those having superimposed infections were classified in both groups.
Comparison of each scatterplot generated from these cases was done with the prototype control pattern and the abnormalities were noted after corresponding with the absolute cell counts and the differential counts [Table/Fig-1]. Sensitivity-specificity was calculated if the finding was present in greater than 50% cases. The various changes seen in the scatterplot are depicted as a composite image in [Table/Fig-2]. A summary of the important findings can be found in [Table/Fig-3]. The following changes were noted for the corresponding aetiologies:
Different scatterplot patterns showing abnormal findings seen in acute febrile illnesses.
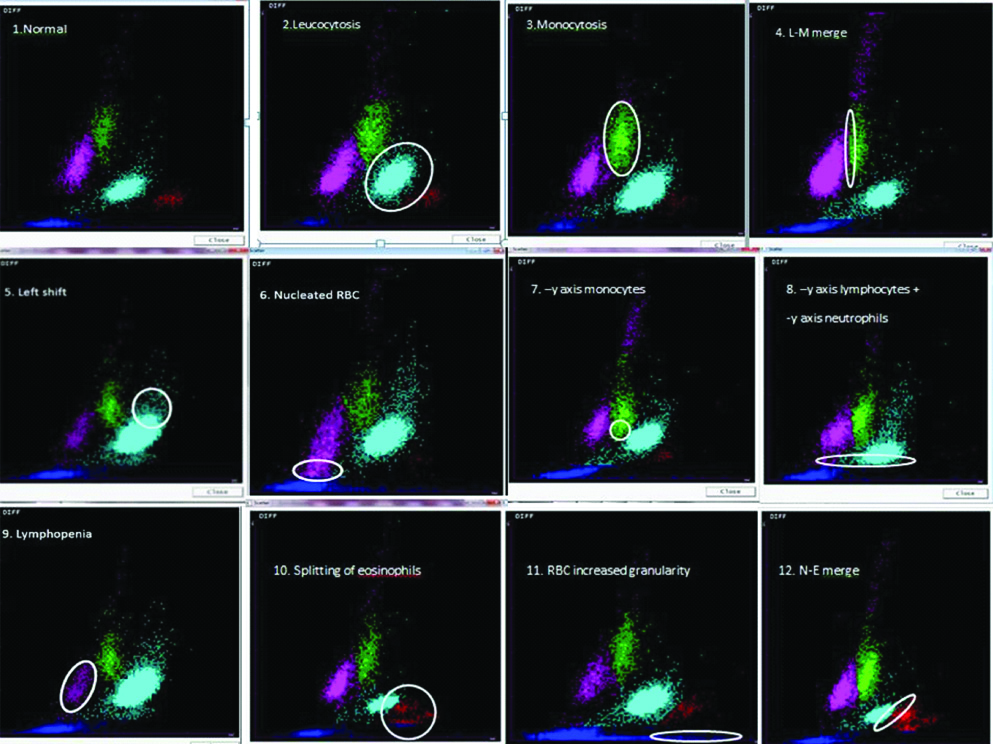
Table showing the most important scatterplot findings in each subgroup of acute febrile illness.
| Scatter plot findings | Bacteria | Virus | Mycobacteria | Fungi | Malaria |
|---|
| 1. Neutrophilic leucocytosis | ✓ | | ✓ | ✓ | |
| 2. y-axis deviation of monocyte | ✓ | ✓ | ✓ | ✓ | |
| 3. Monocytosis | ✓ | ✓ | | ✓ | |
| 4. Lymphopenia | ✓ | | | ✓ | |
| 5. y-axis deviation of lymphocytes | ✓ | | | | |
| 6. Lymphocyte-monocyte merge | ✓ | | | | |
| 7. Left shift | | | | ✓ | |
| 8. Nucleated RBCs | | ✓ | | | |
| 9. Splitting of eosinophils | | | | | ✓ |
| 10. Increased ghost RBC side scatter | | | | | ✓ |
| 11. Neutrophil-eosinophil merge | | | | | ✓ |
Bacterial Infections
Repeat samples were excluded from the study because of repeating results causing a bias in the observations. This excluded eight samples. Thus, a total of 150 cases of bacterial infections were studied.
The major change observed was a decrease in the y-axis deviation of monocytes indicating a decreasing trend in the size of monocytes. Out of the 150 bacterial samples, 130 samples showed a decrease in the monocyte size. (Sensitivity-0.87, specificity-0.62) [Table/Fig-2].
Neutrophilic leukocytosis indicated the next major abnormality obtained being reported in 118 out of the 150 bacterial samples obtained. Neutrophilic leukocytosis was noted as a finding based on either of the following criteria:
a) An increase in the area covered by neutrophils,
b) An increase in the intensity of the light blue colour of neutrophils [Table/Fig-2],
c) An increase in the regularity of shape associated with the same area covered as the prototype normal by the neutrophils.
When either of the above changes was noted, the blood counts of the sample were compared with the normal neutrophil counts and differentials and if both showed deviation from normal, then only it was counted as a case of neutrophilic leukocytosis. (Sensitivity-0.79, specificity-0.65).
Monocytosis also formed a sizeable part of the noted abnormality, being recorded in 86 of the 150 bacterial samples. Findings which pointed towards monocytosis included:
a) An increase in the area of green i.e., representative of monocytes,
b) Since monocytes represent a minor part of the WBC differential, points of increased luminosity also hinted towards the finding [Table/Fig-2],
c) Regularity of shape was also considered a criteria.
If either of the above changes was noted, the blood counts were compared with the normal counts and differentials and fulfilling of both the criteria only increased the count of monocytosis (Sensitivity-0.57, specificity-0.62).
Lymphopenia was noted in 97 of the 150 samples obtained, indicated by:
a) Decrease in the pink area covered by lymphocytes,
b) Decrease in the intensity of the colour of the pink region [Table/Fig-2],
c) The region of atypical lymphocytes indicated by a presence above the monocyte area was however excluded from the above criterion.
Satisfaction of the above criteria along with a corresponding decrease in the lymphocyte count and differentially indicated lymphopenia (Sensitivity-0.65, specificity-0.58).
A decrease in the lymphocyte size indicated by a decrease in the y-axis was noted in 61 of the 150 samples (Sensitivity-0.41, specificity-0.94) [Table/Fig-2].
Lymphocyte-monocyte merge was observed in 64 samples. This included those which were a part of the triple merge along with isolated lymphocyte-monocyte merge which followed similar criteria of merging as mentioned above (Sensitivity-0.43, specificity-0.62) [Table/Fig-2]. All the above findings were cross verified with the cell counts.
Thus, the highest sensitivity for bacterial infections was found to be 0.87 for negative y-axis deviation of monocytes whereas the most specific finding was a negative y-axis deviation of lymphocytes of 0.94.
Fungal Infections
Decrease in monocyte size indicated by a negative y-axis deviation of green showed the maximum frequency being present in 15 out of 18 cases [Table/Fig-2] (Sensitivity-0.88, specificity-0.20).
Neutrophilic leukocytosis was a close second in the finding obtained reported in 14 out of the 18 cases (Sensitivity-0.78, specificity-0.30) [Table/Fig-2].
Lymphopenia was also observed in 14 of the 18 (Sensitivity-0.78, specificity-0.41) [Table/Fig-2].
Left shift/Immature granulocytes indicated by an exaggeration of the neutrophilic slope or an increase in the light blue area above the majority neutrophil area parallel or above the y-axis area of monocytes was seen in 10 of the 18 samples (Sensitivity -0.56, specificity-0.67) [Table/Fig-2].
Monocytosis was recorded in 9 of the 18 fungal samples (Sensitivity-0.50, specificity-0.49) [Table/Fig-2].
The highest sensitivity was obtained for negative y-axis deviation of monocytes-0.88 but none of the findings was specific at all.
Viral Infections
The major change observed was a decrease in the y-axis deviation of monocytes indicating a decreasing trend in the size of monocytes. Out of the 17 viral samples, 14 samples showed a decrease in the monocyte size (Sensitivity-0.82, specificity-0.21) [Table/Fig-2].
Monocytosis was found in 9 of the 17 viral samples. Findings which pointed towards monocytosis were the same as above (Sensitivity-0.53, specificity-0.45) [Table/Fig-2].
Nucleated RBC showed its presence in 9 of the 17 samples and was different from bacterial samples in that there was no association with a negative y-axis deviation of lymphocytes (Sensitivity-0.53, specificity-0.79) [Table/Fig-2].
y-axis deviation of monocytes had the highest sensitivity of 0.82 but none were very specific.
Tuberculosis
The next major change was a decrease in monocyte size indicated by a negative y-axis deviation found in 5 samples [Table/Fig-2] (Sensitivity-0.56, specificity-0.19).
None of the findings in tuberculosis were very sensitive or specific.
Malaria
Splitting of eosinophils was a common finding encountered in malaria cases showing a positive result in 3 out of 5 cases. Splitting referred to two different populations of eosinophil clusters separated either by a difference in size or a difference in the granularity [Table/Fig-2] (Sensitivity-0.6, specificity-0.98).
An increase in RBC granularity also showed its presence in 3 out of the 5 cases. Increase in granularity was defined as either:
a) An increase in the density of the ghost RBC more than 2 divisions of the x-axis which is greater than the region before two divisions,
b) Increase in the density more than three divisions of x-axis with intensity greater than basic blue of ghost RBC and present in clusters.(Sensitivity-0.6, specificity-0.99) [Table/Fig-2].
Neutrophil-eosinophil merge was also seen in three cases.
a) Blending of eosinophil as a part of the neutrophils shape and,
b) Straight line indicating intermingling and breach of area seen in either of the regions.
The aforementioned criteria were interpreted as a neutrophil-eosinophil merge [Table/Fig-2] (Sensitivity-0.6, specificity-0.83).
Rest of the Cases
The two cases of enteric fever, the single case of rickettsial infection and the single case of helminth infection did not show any specific change. Anyway, the number was too few to comment. Culture and serology negative cases could not be classified and hence were not included as a part of the study.
Discussion
AFI constitutes a significant part of the disease burden faced by any tertiary health care institute. While it can be of varied aetiologies, scrub typhus, dengue, malaria, leptospirosis, enteric fever form a large proportion. Scrub typhus and dengue show a spike in the monsoon and post-monsoon period based on a decrease in the extrinsic incubation period. On the other hand, malaria and enteric fever are shown to have an annual prevalence [12,13]. The major reason why many samples of the aforementioned aetiologies.
A detailed literature search did not yield any study where the scatterplot was compared in bacterial infections. However, a study by Choccalingam C, on 24 viral infections using the VCS technology showed a trough at T1, which was slightly obliterated, and the F1 curve mildly extended to the right. The scatterplot for viral disease showed lymphocytes extending to the variant lymphocyte window. In acute viral disease, the mean lymphocyte scatter was significantly decreased [14]. In the present study, the following common findings were seen in the 17 cases of viral infections:
1) Negative y-axis deviation of monocyte; 2) Monocytosis; 3) Nucleated RBC
However, none of these were very specific for them.
Negative y-axis deviation of monocytes was found in bacterial, fungal, viral and tuberculosis positive cultures in a high proportion. Most of the fungal positive cases had a superimposed bacterial infection which confounds, whether the change could be ascribed to the fungal infection or was a part of the pre-existing bacterial infection. The two samples which did however only test positive for fungal culture, also showed a negative deviation of monocyte towards y-axis. In the viral positive and the tuberculosis positive cases also there was a sizeable population of dual infections but unlike the fungal cases, all of the negative populations for negative y-axis deviation of monocytes only consisted of single positive infections. This makes it an important flag to look out for while checking the WBC scattergram, although it is not a very specific finding for any of the particular aetiologies of AFI.
Neutrophilic leukocytosis was the next common finding and the distinction of a bacterial or fungal infection couldn’t be made. However, viral and mycobacterial were negative for this parameter when the superimposed infection were counted out. Further interesting to note was that all the fungal and TB positive lymphopenia cases were found to be overlapping with neutrophilic leukocytosis case. In the viral positive cases though, a reversal was observed in which the viral positive cases without a bacterial superimposed infection reported a higher incidence of lymphopenia compared to those which had one.
Monocytosis besides presenting as a significant finding in bacterial infection had an increased prevalence among the viral and fungal cases as well. It was also intriguing to note that all the viral infections with a superimposed infection lacked this finding.
The relative preponderance of nucleated RBC in viral positive samples is also an important finding in this study.
Another important finding which needs to be stressed out is to keep infectious aetiology also in mind when faced with a scatterplot pattern showing left shift. Especially fungal positive cases reported an increased count in left shift.
Decreased lymphocyte y-axis deviation and lymphocyte-monocyte merge were two parameters found markedly increased in bacterial population and despite the decreased sensitivity, almost always pointed towards a bacterial aetiology when present. Also, it was noticed that a decreased lymphocyte y-axis deviation was always present with a similar negative monocyte y-axis deviation and all the negative neutrophil y-axis deviation was also present as a triple negative shift indicating that both the lymphoid and myeloid series were affected together. Lymphocyte-monocyte merge was also often associated with a triple merge especially in bacterial population, more so in the bacterial positive cases where almost two-thirds of those showing lymphocyte-monocyte merge also showed a triple merge. In fact, such an attempt to link these merge patterns with the diagnosis of AFI has never been made and needs to be investigated. In the viral infections, especially dengue, an upward shift of lymphocyte region has been described ascribed to the presence of atypical lymphocytes [9-11]. However, authors did not encounter any cases of dengue in the present study. Earlier studies on scatterplot patterns based on AFI have largely remained confined to malaria. They have found changes such as increase in the fluorescence of monocytes, lymphocytes, neutrophils, pseudo-eosinophila and greying of neutrophilic area as relevant findings which make it pertinent to checking for malarial parasites in peripheral blood smear [15,16].
The [Table/Fig-3] highlights the important findings to be kept in mind for each aetiology of acute febrile illness. Combining clinical suspicion, observation of these scatterplot patterns and routine gold standard diagnostic methods may yield a better result.
Limitation(s)
Limitations of the study included the small sample size for malaria, viral, fungal, tuberculosis and rickettsial infections as the samples couldn’t be collected since the study was conducted in the pre-monsoon period of July and August in the geographic area. Serologic and culture confirmation and follow-up were also not obtained in 139 samples (43%) of the cases.
Conclusion(s)
Automated cell counters are now an integral part of most haematology laboratories. Scatterplot patterns obtained from a complete blood count can aid in the diagnosis of the aetiologies of acute febrile illnesses. Notable differences were found in the scatterplot patterns of the normal and the bacterial, fungal, viral infections. Most of them were non-specific findings, found in acute febrile illnesses except in malaria. These findings can be correlated with other models of automated haematological analysers. Nevertheless, they are useful and it is necessary for a clinician and the laboratory personnel to be aware of these differences from the usual scatterplot pattern.