Acute Myeloid Leukaemia (AML) is a mixed group of malignant disorders of myeloid haematopoietic cells, where accumulation of immature cells occurs due to maturation arrest in different stages of development. This leads to the different symptoms and signs of the disease secondary to bone marrow failure [1]. Acquired genetic alterations along with epigenetic changes in haematopoietic progenitor cells are associated with the disease development [2].
Materials and Methods
The current case-control study was carried out on 60 adult de novo patients with AML. Sixty adult healthy individuals with normal laboratory investigations were incorporated as a control group, during the period from December 2016 to November 2017. The sample size was determined according to the availability of patients fulfilling the inclusion criteria, and who could be followed after two months. The study inclusion criteria were adult (age ranged from 18 to 60 years, only one patient was 65 years), primarily diagnosed AML patients before receiving any treatment. Paediatric, Acute Lymphoblastic Leukaemia (ALL), secondary AML-M3, and patients under treatment were excluded from the research.
Both cases and controls were employed from the National Cancer Institute (NCI) and Beni-Suef University Hospital. Data confidentiality was conserved according to the Revised Helsinki Declaration of Bioethics (2008). Informed consent was taken from all the patients who agreed and joined this study. Patients’ samples were taken prior to treatment. Revised Helinski Declaration of Bioethics (2008) was followed for Data confidentiality. Informed consent was taken from the study participants who agreed to enroll for the same.
Diagnosis of AML was based on: 1) morphologic findings from Giemsa-stained smears of Bone Marrow (BM) aspirates; 2) cytochemical stains criteria such as positivity of Myeloperoxidase (MPO) and Sudan Black B (SBB); and 3) Immunophenotyping (IPT) criteria as positivity of CD13 and CD33 by flow cytometry.
The patients were subjected to: a) history taking, full clinical examination; including liver, spleen and lymph node examination, chest X-ray, abdominopelvic ultrasound and other radiological examination if required, routine biochemical investigations including: kidney function tests, liver function tests; b) all Laboratory Investigations essential for diagnosis and classification of AML including: Complete Blood Count (CBC); bone marrow examination, cytochemical stain studies and Immunophenotyping analysis (IPT); c) specific Laboratory Investigation: detection and quantification of LATS2 gene expression using peripheral blood samples by RT-QPCR technique.
Treatment of AML patients: Patients received the treatment according to the standard AML protocol of the National Cancer Institute (NCI). All patients received a course of 12 mg/m2 novantrone on Day 1, 3 and 5; Ara-C 100 mg/m2 every 12 hours from Day 1 to 7. If there was no remission after the course, this protocol would be repeated. If no or minimal response, patients received high dose chemotherapy. Patients in remission had received four courses of high dose Ara C as consolidation. This was Ara-C 2 gm/m2 on two hours infusion every 12 hours on Day 1, 3 and 5.
By the end of 28 days of induction therapy, Remission for AML is defined as [8]:
Morphologic Complete Remission (CR) [
8]
absolute neutrophil count ANC ≥1,000/mcL,
platelet count ≥100,000/mcL,
<5% bone marrow blasts,
no Auer rods,
no evidence of extramedullary disease.
Partial Remission (PR) [
8]
ANC ≥1,000/mcL;
platelet count >100,000/mcL;
at least a 50% decrease in the percentage of marrow aspirate blasts to 5-25%, or marrow blasts <5% with persistent Auer rods.
No complete remission was established in the case of patients who didn’t meet the above-mentioned criteria.
Sample Collection
For each patient and control, 3-5 mL of venous blood was collected under sterile aseptic conditions and dispensed into vacutainer tube containing preservative free Ethylenediaminetetraacetic Acid (EDTA) and mixed immediately to avoid clotting. For optimal results, blood samples were processed within few hours of collection. Messenger RNAs (mRNAs) from blood cells have different stabilities. To ensure that the isolated RNA contains a representative distribution of mRNA, samples were not stored for longer periods before isolating RNA.
Principle of the PCR: Polymerase Chain Reaction (PCR) is a very sensitive, rapid and powerful technique of amplifying specific DNA sequence in vitro [9].
The cycling reactions: The three main steps of PCR {Denaturation (at 94°C), Annealing (at 54°C), and Extension (at 72°C)} are recurring for 30 to 40 cycles. These reactions occur in an automated cycler that can heat and cool the tubes with the reaction mixture in a very short period.
Quantitative PCR (Q-PCR) was used to quantitate small amounts of DNA and Q-RT-PCR was used to measure RNA. Q-PCR and Q-RT-PCR methods use an internal control that is co-amplified with the target sequence.
RNA Extraction
RNA extraction was done using RNA isolation kit (QIAamp® RNA Blood Mini Kits Catalog No. 52304), procedure according to manufacture kits.
Complementary DNA Formation
cDNA was synthesised from total RNA samples using High-Capacity cDNA Archive Kit. Applied Biosystems Part Number: 4322171, procedure according to manufacture kits.
Real-time PCR Quantification
Real-time PCR quantification was done by TaqMan® Gene Expression Assay (TaqMan® MGB probes, FAM™ dye-labelled) Applied Biosystems, procedure according to manufacture kits: Cat.N.4331182 (mix of pre-formulated assay 1 probe and 2 primers), and TaqMan Endogenous Control Assays: GAPDH, VIC® dye-labelled probe): Cat.N.4326317E. Sequence of GAPDH:-The forward primers: F (5′-GTC CAT GCC ATC ACT GCC AC-3′)- The reverse primers: R (5′-ATG ACC TTG CCC ACA GCC TT-3′).
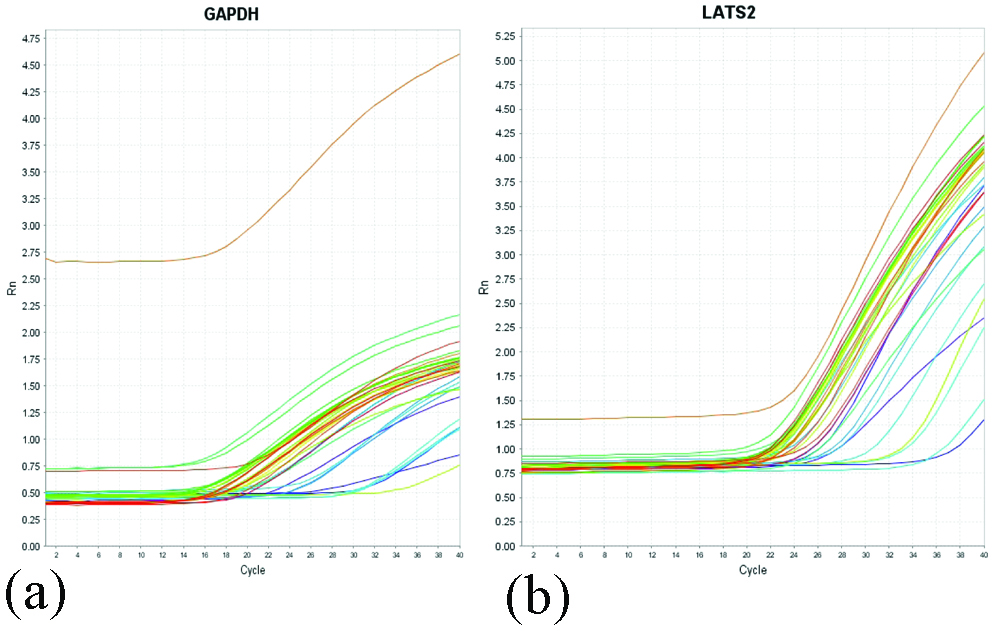
Real time PCR amplification plot of GAPDH (a), and LATS2 Gene (b).
Comparative CT method was used for the interpretation of results for Relative Quantification according to this Arithmetic Formulas [9]:
Relative Quantification (RQ)=2-ΔΔCT
Arithmetic formulas: The amount of target, normalised to an endogenous reference and relative to a calibrator, is given by: 2-ΔΔCT
Where’s CT=Threshold cycle.
ΔCT=CT Target Gene (LATS2)-CT Reference Gene (GAPDH)Where’s ΔCT=the difference in threshold cycles for target and reference genes.
ΔΔCT=ΔCTcase-ΔCT calibratorsThe Comparative CT method requires endogenous control, which is a gene target used to normalise quantitative PCR results. The endogenous control should consistently express in all samples and the expression level should not be altered by any experimental condition.
The LATS2 gene expression in a sample was determined by subtracting the cycle threshold of the reference gene from that of the target gene to get the normalised amount of the LATS2 gene, then comparing this value to the value of the calibrators.
Statistical Analysis
IBM SPSS advanced statistics version 22.0 (SPSS Inc., Chicago, IL) was used to analysed the data. Numerical data were expressed as mean and standard deviation or median and range as appropriate. Qualitative data were expressed in the form of frequency and percentage. Relation between qualitative variables was tested by chi-square test. Mann-Whitney test (non-parametric t-test). was used to compare between two groups for not normally distributed quantitative data. Comparison between three groups was done by Kruskal-Wallis test (non-parametric ANOVA). Spearman-rho method was used to test correlation between numerical variables. All tests were two-tailed. p-value <0.05 was considered significant.
Results
Patients were 38 males (63.3%) and 22 (36.7%) females. Their age ranged between 18-60 years, except one patient of 65 years old. As for the controls; they were 33 (55.0%) males and 27 females (45.0%), with age ranged between 19-60 years. All data of patients and control group are shown in [Table/Fig-2]. Follow-up of patients was performed for two months.
Comparison between AML patients and controls.
| AML group N=60 | Control group N=60 | p-value |
|---|
| Age (years) |
| Mean±SD | 42.1±15.8 | 33.8±10.9 | 0.1 |
| Range | 18-65 | 19-60 |
| Median | 41.5 | 33 |
| Gender: |
| Male | 38 (63.3%) | 33 (55%) | 0.508 |
| Female | 22 (36.7%) | 27 (45%) |
| TLC (x109/L) |
| Mean±SD | 41.6±49.2 | 7.3±1.6 | <0.05 |
| Range | 1.0-209.1 | 4.7-10.0 |
| Median | 26.0 | 7.7 |
| Hb (gm/dL) |
| Mean±SD | 7.4±2.0 | 13.0±0.9 | <0.001 |
| Range | 4.3-13.8 | 11.8-14.8 |
| Median | 6.9 | 12.9 |
| Plt (x109/L) |
| Mean±SD | 52.2±44.7 | 292.1±75.9 | <0.001 |
| Range | 2-204 | 178-410 |
| Median | 37 | 290.0 |
| LATS2 level |
| Mean±SD | 156.4±187.7 | 0.30±0.27 | <0.001 |
| Range | 2.0-790.9 | 0.05-1.0 |
| Median | 37.2 | 0.20 |
There was a highly statistically significant difference between AML patients and controls regarding LATS2 Gene expression level as mean expression level were 156.4±187.7 in AML patients compared to 0.30±0.27 in controls (p-value <0.001). There was a statistical significant difference between AML patients and control as regarding Total Leucocytic Count (TLC) as mean was 41.6±49.2×10⁹/L in AML patients compared to 7.3±1.6×10⁹/L in controls (p-value <0.05).
There was a highly statistical significant difference between AML patients and controls as regarding haemoglobin (Hg) level as mean was 7.4±2.0 gm/dL in AML patients compared to 13.0±0.9 gm/dL in control (p-value <0.001). There was a highly statistically significant difference between AML patients and control as regarding platelet count as mean was 52.2±44.7×10⁹/L in AML patients compared to 292.1±75.9×10⁹/L in controls (p-value <0.001).
The patient’s clinical findings, FAB classification, and treatment response data were summarised in [Table/Fig-3].
Characteristic of 60 AML patients (clinical data, blasts, FAB classification and complete remission).
| Parameter | NO (%) |
|---|
| Hepatomegaly | 22/60 cases (36.7%) |
| Splenomegaly | 20/60 cases (33.3%) |
| Lymph node enlargement | 4/60 cases (6.7%) |
| Bone marrow blasts (%) |
| Mean±SD | 70.4±19.2 |
| Range | 30-99 |
| Median | 72.5 |
| FAB classification: |
| M0: No (%) | 8 (13.3%) |
| M1: No (%) | 20 (33.3%) |
| M2: No (%) | 21 (35.0%) |
| M4: No (%) | 7 (11.7%) |
| M5: No (%) | 3 (5.0 %) |
| M6: No (%) | 1 (1.7%) |
| Complete Remission (CR): | 40/60 (66.7%) |
| Partial Remission (PR): | 8/60 (13.3%) |
| No CR: | 12/60 (20.0%) |
There was a statistically significant difference between LATS2 gene expression level and hepatomegaly as p-value=0.044. LATS2 mean expression level was higher in hepatomegaly patients (162.7±152.4) than patients with no hepatomegaly (145.6±240.5) [Table/Fig-4]. There was a statistically significant difference between LATS2 gene expression level and splenomegaly as p-value=0.047. LATS2 gene mean expression level was higher in splenomegaly patients (176.93±238.70) than patients with no splenomegaly (146.15±158.72).
Association between LATS2 gene expression level and hepatomegaly and splenomegaly.
| Parameter | No of patients (%) | LATS2 gene level | p-value |
|---|
| Hepatomegaly | | Mean±SD | Range | Median | |
|---|
| Present | 22 (36.7%) | 162.7±152.4 | 2.40-790.88 | 175.95 | 0.044 |
| Absent | 38 (63.3%) | 145.6±240.5 | 2.00-444.56 | 20.64 |
| Splenomegaly |
| Present | 20 (33.3%) | 176.93±238.70 | 2.89-790.88 | 47.07 | 0.047 |
| Absent | 40 (66.7%) | 146.15±158.72 | 2.00-444.56 | 37.24 |
No association was found between LATS2 gene expression level and lymph node enlargement of patients (p-value=0.507).
There was a statistically significant difference between LATS2 gene expression level and follow-up of patients as (p-value=0.002). LATS2 gene mean expression level was higher in patients who didn’t achieve CR {NO CR (239.83±281.08)} than patients who achieved partial remission {PR (147.18±160.24)} which again was higher than patients who achieved CR (77.45±100.29) [Table/Fig-5].
Association between LATS2 gene expression level and patients follow-up.
| Parameter | No of patients (%) | LATS2 gene level | p-value |
|---|
| Follow-up: | AML patients=60 | Mean±SD | Range | Median | |
|---|
| Complete Remission (CR): | 40 | 77.45±100.29 | 2.00-222.01 | 13.65 | 0.002 |
| Partial Remission (PR): | 8 | 147.18±160.24 | 2.19-444.56 | 32.20 |
| No CR | 12 | 239.83±281.08 | 3.33-790.88 | 115.69 |
No association was found between LATS2 gene and gender of the patient as (p=0.222).
A significant positive correlation was found between LATS2 gene and patient TLC as p-value=0.021 and r=0.298.
No correlation were found between LATS2 gene and patients age, Haemoglobin level, platelets count or BM blasts as p-value (>0.05).
Discussion
AML is a disorder described by a clonal proliferation of primordial haematopoietic stem cells or progenitor cells. Atypical differentiation of primitive myeloid cells leads to the raise of immature malignant cell populations instead of the regular differentiation into red blood cells, platelets and white blood cells [10]. The disease dominantly happens in older people (>60-year-old), however, it may arise at any age. AML typically presents with a rapid onset of symptoms due to bone marrow failure and may be fatal in weeks or months if left without treatment [10].
To define and claify AML and its subtypes, immunophenotyping, cytogenetic and molecular classification are required [11].
LATS2 gene, a tumour suppressor gene mapped on chromosome 13q11-12 encodes a novel serine/Threonine Kinase [5]. LATS2 is essential in detecting mitotic stress that happens during hyperproliferation leading to oncogene activation as it promotes activation of p53-dependent checkpoints, which may prompt either G1/S arrest or apoptosis [12].
In attempt to comprehend the relation between LATS2 and AML patients, the present research investigated LATS2 gene in AML patients with a specific aim to identify gene relation to clinical signs and laboratory findings at diagnosis, and its correlation with disease progression, treatment response and outcome in AML patients.
In the current study, the expression level of LATS2 gene was higher in AML patients than in control group. The mean expression level of LATS2 was higher in AML patients than in controls. The difference was highly statistically significant (p<0.001).
To the best of authors’ knowledge, only two studies studied LATS2 gene in AML Gholami M et al., and Movafagh A et al., [7,13]. The results are in accordance with both researchers groups findings of LATS2 gene expression in AML patients. They studied the LATS2 gene in a group of untreated AML patients by RT-PCR and found higher expression of LATS2 gene in these patients.
As LATS2 is a component of hippo signalling pathway, Da Costa Cacemiro M et al., found that the Hippo pathway plays an essential role in the regulation of fundamental cellular mechanisms and exerts a dual role in the development of diverse types of cancers, including haematological malignancies [14].
Moreover, the kinase activity is required for the mechanism by which LATS2 can downregulate the expression of the anti-apoptotic proteins BCL-xL and BCL2, the LATS2-p53 functional axis can control apoptosis through both the downstream activation of p53 transcriptional target genes and by the non-transcriptional mechanisms [15].
In the present study, a significant correlation was found between LATS2 gene and patient’s total leukocytic count as p-value (0.021), r=0.298 but there wasn’t any correlation between LATS2 gene expression and age (p-value 0.067, r=0.238), Haemoglobin level (p-value 0.920, r=-0.013), platelets count (p-value 0.169, r=-0.239), and BM blast (p-value=0.064, r=0.240).
In Gholami’s study, a positive correlation was observed between LATS2 gene expression and patient’s age and gender while TLC, Haemoglobin and platelets count, BM blast were not clarified [7]. Although both Gholami M et al., and Movafagh A et al., didn’t correlate clinical data such as hepatomegaly, splenomegaly, and lymph nodes enlargement to LATS2 expression in their studies; these correlations were performed in the current study [7,13].
In the present study, a positive association between LATS2 gene and hepatomegaly was studied. Mean expression level of LATS2 was higher in the 22 AML patients (36.7%) with hepatomegaly than the 38 (63.3%) patients without hepatomegaly. The difference was statistically significant (p=0.044).
In the present study a positive association was found between LATS2 gene and splenomegaly. Mean expression level of LATS2 was higher in the 20 patients (33.3%) with splenomegaly than the 40 (66.7%) patients without splenomegaly. The difference was statistically significant (p=0.047).
Meanwhile; there wasn’t any association between LATS2 gene and lymph nodes enlargement p=0.507.
In the present study, regarding follow-up of patients after induction therapy (28 days); 40 patient out of 60 AML patient achieved complete remission (66.7%) compared to 8 AML patients (13.3%) who achieve partial remission and 12 AML patients (20%) who didn’t achieve complete remission. The highest LATS2 gene expression was observed in patients who didn’t achieve complete remission. Meanwhile, the patients who achieved partial remission, had higher mean expression level than the patients who achieved complete remission. The difference was statistically significant (p=0.002).
Gholami M et al., didn’t include follow-up of the patients but they suggested that LATS2 mRNA expression might serve as a significant factor independent of the other classic prognostic factors [7]. Moreover, Movafagh A et al., suggested that LATS2 may participate in the leukaemogenesis of AML and also affects the clinical outcome of the disease [13].
As far there are few information on the machinery underlying the association between LATS2 expression and its role in AML.
According to Jiménez-Velasco A et al., LATS2 gene can also be a target of methylation epigenetic mechanisms, whose reduced expression in ALL is related to patient’s poor prognosis and worst survival [15]. Additionally, Kawahara M et al., suggested that the low expression of LATS2 in both adult T cell and natural killer leukaemia/lymphoma results in low expression of proapoptotic genes in addition to leukaemic cells’ resistance to chemotherapy [16].
In congruence with Gholami M et al., and Movafagh A et al., researches, the current research advocated that the overexpression of LATS2 mRNA levels were significantly increased in patients with AML in comparison with the control group [7,13]. This is consistent with many studies Zhang Y et al., study revealing that LATS2 protein was found to be over-expressed in Nasopharyngeal Carcinoma (NPC) tumour tissues and NPC cell line, Kamikubo Y et al., who proved that overexpression of LATS2 in Hela cells can cause G2/M arrest [17,18] and finally, Ke H et al., proved that in lung cancer cell lines (A549 and H1299), overexpression of LATS2 induces apoptosis [6]. Whereas Li Y et al., showed that in transformed NIH-3T3 cells, excess LATS2 inhibits G1/S. Thus the special effects of LATS2 on cell proliferation or apoptosis appear to be dependent on cell type or cell status [19]. The defined mechanism underlying LATS2- regulated cell survival in AML needs to be investigated in future studies.
Limitation(s)
There are two major limitations in this study that could be addressed in future research. First, the study focused on adult onset AML only; while this result suggests that LATS2 may be an important target for anticancer therapy. Second, the sample size seemed to be small, but recruitment of patients, with the study inclusion criteria, was not easy. Hence, further studies are required in order to clarify the role of LATS2 gene expression and the biological activity of its products in the mechanism of leukemogenesis in AML.
Conclusion(s)
The present study established that LATS2 gene expression might be associated with AML. Higher levels were found in patients with extramedullary infiltration as hepatomegaly and splenomegaly. Higher level of LATS2 expression may be associated with bad prognosis as it was higher in patients who didn’t achieve CR than patients with PR which were higher than patients who achieved CR. So LATS2 gene might be a valuable new marker in the diagnosis and prognosis of AML patients.