Main cause of glaucoma is damage to RGCs by multiple factors that inturn slowly results into damage to RNFL resulting in functional visual impairment [1]. Asians will have 47% of disease worldwide by 2020 [2]. Glaucoma accounts for 12% of blindness and 11.4% of low vision in India [3]. Due to lack of early symptoms and early clues of the diagnosis, prevention and treatment of glaucoma is little challenging. Structural changes have already occurred before the development of ONH cupping and visual field loss [4,5]. OCT is a non-contact imaging with a high resolution of images. The ocular application of OCT provides numeric measurements of the macular retinal thickness, peripapillary Nerve Fibre Layer (NFL) thickness, and topographical representation of the ONH. The RGC layer in the macula is more than one cell layer thick, and RGC bodies have 10 to 20 times the diameter of their axons. Because the RGC and the RNFL are layers prone to damage in glaucoma, central macular thickness has been suggested as a sensitive scanning region for early glaucoma detection [6].
SD-OCT has the function to produce 3D datasets, hence assessment of all ONH parameters for glaucoma evaluation can be done with more precision and also progression detection can be done. A 3D imaging of the ONH region enables fast, accurate and reproducible measurements of ONH parameters. SD-OCT can differentiate glaucomatous population and age-matched healthy controls by ONH parameters and RNFL thickness. Although RNFL thickness and its correlation with visual field has been established [7]. Macular GCC and its correlation with retinal sensitivity has not been explored. Due to scarcity of studies to evaluate the macular thickness, ONH parameters and its comparative study with RNFL parameters in glaucoma. The present study was conducted to evaluate role of Ganglionic Cell Complex, Retinal Nerve Fibre Layer in Glaucoma Evaluation, in Indian population.
Materials and Methods
This study was a case control observational study conducted in a tertiary teaching hospital from August 2015 to November 2017. Institutional ethical clearance was taken and tenants of a declaration of Helsinki were adhered to. Participants were given detailed information and consent was taken. All the cases were divided into two groups.
Sample size was calculated assuming 95% Confidence Interval, marigin of error 5 μm and SD of 21 using sample size formula. Group I consisted of 55 newly diagnosed POAG patients aged between 40 years to 70 years applying inclusion and exclusion criteria. Group II consisted of 50 non-glaucoma subjects coming for routine ophthalmolgical check up and were age and gender matched with the cases.
Inclusion criteria for group 1 was typical of ONH changes of glaucoma (NRR thinning and disc haemorrhage, notch, bayonetting, baring of circumlinear vessels or vertical cup-to-disc ratio >0.5 or difference in cup-disc-ratio of more than 0.2 in the two eyes in the absence of significant difference in disc size), presence of glaucomatous visual field defects that corresponded with clinical examination, open angles, refractive error of less than +3D to −3D.
Exclusion criteria were any macular or retinal pathology, known case of uncontrolled hypertension, coronary artery disease on treatment or any other invasive procedure, diabetes and any past cerebrovascular accident, Best-Corrected Visual Acuity (BCVA) equal or worse than 6/18, the presence of significant cataract, SD-OCT signal strength less than 6.
Inclusion criteria for group II (normal population) included corrected Intra Ocular Pressure (IOP) <21 mmHg, a normal optic disc head, open angles, no RNFL defect in red free light and normal visual field examination. The exclusion criteria were BCVA of <6/18, chronic ocular disease, systemic diseases affecting the eyes and systemic corticosteroid use.
All the cases, as well as controls, were registered for the study. Detailed medical history was recorded and through systemic examination was done. The ocular examination includes corrected BCVA, patchy corrected IOP by applanation tonometry, slitlamp biomicroscopy for anterior segment examination, gonioscopy, disc examination with 90D lens, central corneal thickness and visual field by static perimetry Humphrey VF 30-2. Single well trained examiner performed OCT in all subjects after dilating the patients (minimum 4 mm of dilatation) (Model 400 by Carl Zeiss Meditec) for RNFL, ONH and macular GCC. ONH analysis and RNFL analysis were performed using standard ONH scans and GCC analysis was done by macular cube 512×128 protocol.
Statistical Analysis
The SPSS 15.0 programme was used to analyse the result. To compare the measured parameters values between two groups an analysis of variance (ANOVA) was used. The p-value <0.05 was considered significant. To look for RNFL thickness and macular thickness measurement differences between the two groups one-way ANOVA and post-hoc Tukey honest significant difference test were applied. Method of regression analysis was utilised to establish the relationship between mean RNFL, GCC thickness. To assess the correlations between continuous variables Pearson’s correlation coefficients were used. ROC curves were used to differentiate glaucomatous eyes from healthy eyes using SD-OCT parameters (RNFL and GCC thickness) .
Results
In this study, 55 patients were included as cases in group 1 and 50 subjects were included as controls group II (total of 210 eyes: 100 normal eyes and 110 POAG patients). Mean age in group 1 was 62.07±1.95 years and 57.98±2.14 years in Group II. In group 1, 32 (58.18%) were males and 23 (41.18%) were females and in group II, 33 (66%) were males and 17 (34%) were female. No statistically significant difference was found in age distribution, sex, pachymetry distribution between the groups (p>0.05).
RNFL thickness was significantly thinner in glaucomatous groups as compared to the control subjects. RNFL thickness showed significant difference with the Mean Deviation (MD) of the visual field in glaucoma subjects (p=0.01) [Table/Fig-1].
Mean values of retinal nerve fiber layer analysis in between POAG and normal group.
| Parameters | POAG (Cases) | Normal (Control) |
|---|
| Average RNFL | 66.04±11.48 μ | 92.12±8.54 μ |
| Superior RNFL | 73.11±16.24 μ | 111.07±17.07 μ |
| Temporal RNFL | 49.65±9.76 μ | 60.10±7.19 μ |
| Inferior RNFL | 73.44±21.35 μ | 116.82±16.93 μ |
| Nasal RNFL | 58.03±10.31 μ | 73.01±9.41 μ |
Overall GCC thickness analysis also showed significant difference in two groups where GCC overall thickness was significantly thinner in glaucomatous groups as compared to the control subjects. GCC overall thickness showed significant difference with the MD of the visual field in glaucoma subject (p=0.01). GCC overall thickness decreased with increasing severity of Visual Fields (HAP classification). Average GCC values were higher in normal than POAG 83.22±5.52 μ and 65.62±7.65 μ respectively.
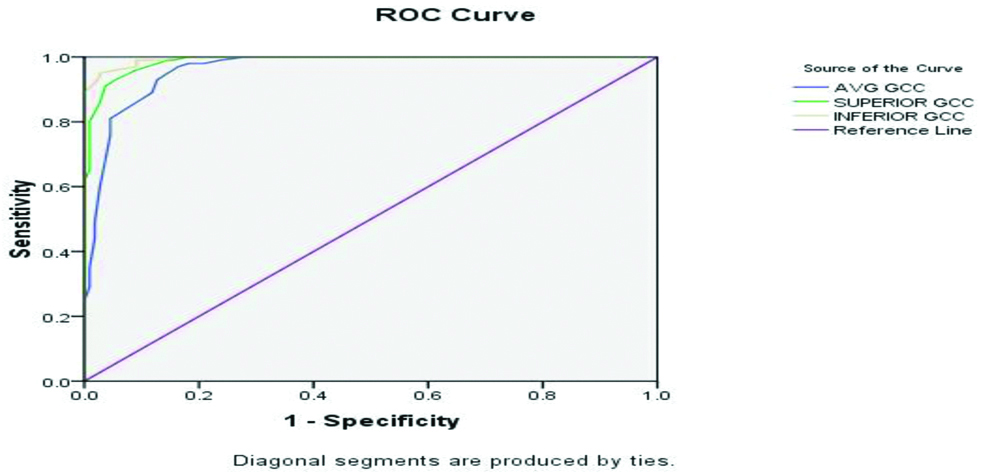
ROC curves were drawn for RNFL and GCC parameters as shown in [Table/Fig-2,3]. The area under the ROC (AROC) curve for average RNFL was 0.963 (95% CI). With a cut-off value of 80.5 microns, there was 93% sensitivity and 89% specificity [Table/Fig-4]. The AROC curve for average GCC was 0.963 (95% CI). With a cut-off value of 76.5 microns, there was 89% sensitivity and 84% specificity [Table/Fig-5].
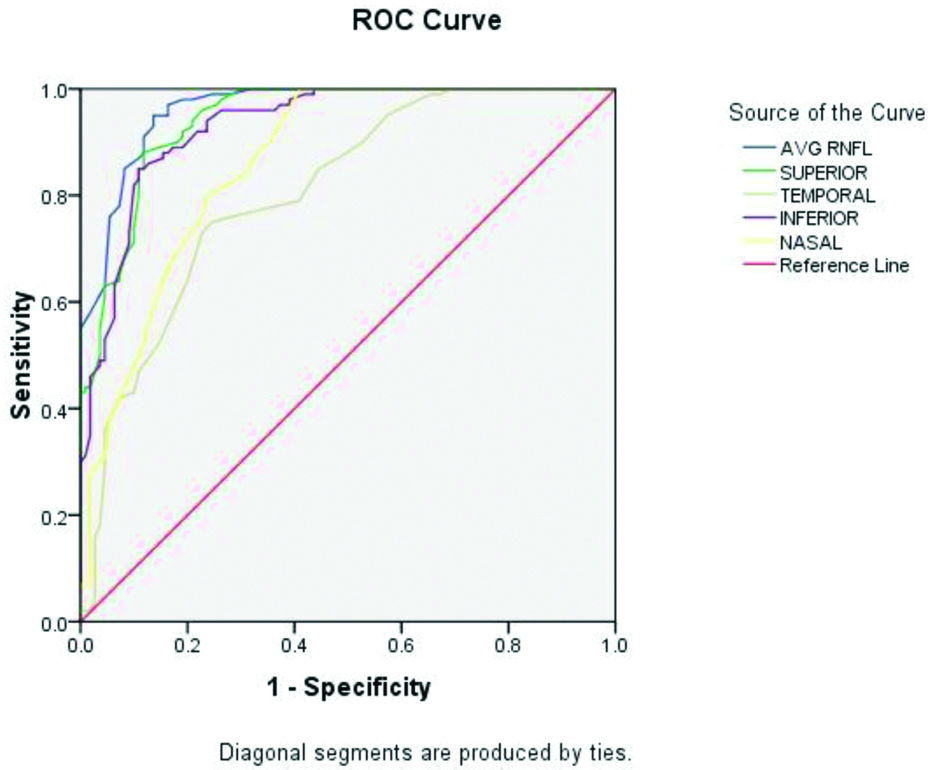
Sensitivity and specificity of RNFL using one-way ANOVA analysis.
| Test variables | Area under ROC | Cut-off value (μ) | Sensitivity | Specificity |
|---|
| Average RNFL | 0.963 | 80.5 | 93 | 89 |
| Superior RNFL | 0.943 | 88.5 | 90 | 82 |
| Inferior RNFL | 0.931 | 90.5 | 89 | 81 |
Sensitivity and specificity of GCC using one-way ANOVA analysis.
| Test variables | Area under ROC | Cut-off value (μ) | Sensitivity | Specificity |
|---|
| Average GCC | 0.963 | 76.5 | 89 | 84 |
| Superior GCC | 0.988 | 75.5 | 93 | 95 |
| Inferior GCC | 0.995 | 73.5 | 96 | 95 |
Discussion
Glaucoma causes irreversible damage to structural and functional anatomy of patients’ eyes. By the time it is diagnosed, 40% of nerve tissues has already been damaged. Till now visual field remains the gold standard for diagnosing POAG. OCT is a newer diagnostic tool to see the status of various layers of the retina. OCT provides an objective as well as numeric measurement of RNFL thickness by measuring echo time delay by backscattering of light from different retinal layers [8]. This instrument is fast, less time consuming and patient friendly [9]. Hong S et al., has shown that cirrus SD-OCT able to analyse the peripapillary RNFL thickness was constantly reproducible with negligible variation in measurements in healthy eyes [10]. It is a known fact that RGCs are selectively lost in early glaucoma but how much GCC loss has already occurred to record visual filed defect is still in research. Studies in animal models have shown that GCC cell loss agrees with visual field defects [11]. Studies have also shown reduced central macular thickness in early glaucoma but has limited role [6]. In recent years, imaging of macular ganglionic cell with high definition images showed a promising result as approximately 50% of RGCs are located 4-5 mm from the centre of the fovea [12]. At 750-1100 μm from the foveal centre, the ganglionic cell density is maximum. The cell density thickness may be 4-6 cell bodies [13]. For its thick areas, these are the sites of more initial damage to GCC. Present study pointed out, both the RNFL as well as GCC showed the maximum AROC among all of the parameters. Previous studies showed the RNFL has the highest AROC both with Frequency-domain OCT and time-domain OCT though most of the RNFL thickness parameters obtained from these two devices are quite different [14,15]. The superior and inferior sectors gather most of the RNFL and have the priority of glaucomatous damage and in early stage glaucoma, RNFL damage can occur either in a superior or inferior region (or both) in a focal or diffuse way. Correspondingly, superior and inferior GCC have more priority of glaucomatous damage and in early glaucoma stage. Budenz DL et al., showed that if we take ROC curve area of 0.793 for average RNFL analysis, we can differentiate early glaucoma from normal eyes [16]. In another study by Bowd C et al., showed AROC of 0.93 for inferior RNFL has best predictor value for differentiation for early glaucoma [17]. This study has shown that average RNFL thickness followed by superior and inferior RNFL thickness has the best ability to discriminate between early onset glaucoma and healthy eyes, with AROC of 0.963, 0.943 and 0.931, respectively. Sihota R et al., has also done the study in Indian eyes on the role of OCT to detect average difference in RNFL thickness from healthy eyes and glaucomatous eyes [18]. Authors also used RNFL parameters to differentiate between different stages of glaucoma disease. Study concluded that inferior quadrant and average RNFL parameters are among the most efficient parameters for making such a differentiation.
In the present study it was found that RNFL thickness and GCC thickness had almost similar diagnostic values for glaucoma detection. The GCC parameters (average, superior, and inferior thickness) readily identified glaucoma patients. Inferior GCC thickness appeared to be a better predictor of early glaucoma than superior and average GCC thickness, with AROC of 0.995, 0.988 and 0.963 respectively but the difference was not significant.
This study showed that the RNFL and GCC thickness are lower in POAG than in normal eyes. The average RNFL thickness is a measurement of the global thickness of the RNFL and, therefore it is presumed important in the differentiation of glaucoma from healthy eyes. GCC thickness, as measured by OCT had higher sensitivity and specificity for the detection of early glaucoma.
Values of inferior GCC thickness seems to be a better identifying tool for early glaucoma compared with RNFL thickness as GCC is a direct measure of RGC integrity. In glaucoma, RGC loss is earlier than axonal loss and therefore, macular GCC analysis may prove to be an early predictor than RNFL parameters. Secondly, as in macular OCT scan, GCC is done within 6 mm × 6 mm square area centered on the macula and early glaucomatous damage occurs in the paracentral region (10°-20° of central field), this can be easily detected by GCC scan. Macular GCC and RNFL analysis may yield fallacious results in high myopes. That’s why we have excluded high myopes from this study. However, observational study by Lee JW et al., has shown that macular thickness is independent of the axial length and refractive status of the non-glaucomatous healthy children in China [19].
Limitation(s)
Limitations of this study was small sample size with lack of a normal database of Indian eyes for measuring GCC and RNFL thickness. Large population based studies are required to establish the GCC parameters in glaucomatous patients.
Conclusion(s)
SD-OCT was able to show the significant differences of thickness of RNFL and GCC between glaucoma patients and normal subjects. At present, there is no consensus that which is the best structural parameter for early detection of glaucoma. It is still in the world of confusion whether one like visual fields, raised IOP or several combination of diagnostic parameters, in the clinical diagnosis of early glaucoma. The role of GCC evaluation becomes important in preperimetric patients with younger age and suspicious disc.