Abnormal hyperintense signal within the spinal cord is often encountered in radiological practice. Though clinical features may give a hint to the diagnosis, additional investigations and imaging are more often than not required to establish a diagnosis in these cases. An abnormal signal within the cord can be evaluated with respect to the length of the cord involved (short segment or long segment), the location of the signal on axial images (central, focal, diffuse), association with cord expansion or thinning, enhancement pattern, associated cysts and a few imaging features pathognomonic to certain clinical conditions. In this pictorial essay, we describe the imaging features of the vast spectrum of conditions producing an abnormal cord signal on Magnetic Resonance Imaging (MRI) with illustrative cases and also the implementation of a systematic approach to evaluate the abnormal signal in order to reach a diagnosis in each of these cases.
Introduction
Spinal cord pathologies are collectively referred to as “myelopathy”. Cases of myelopathy often present with a vague clinical picture of variable onset with non-conclusive findings on examination. Hence, a comprehensive approach inclusive of the clinical profile, physical examination, CSF examination and radiological evaluation should be implemented in the assessment of these cases.
MRI is the primary imaging modality in the cases of spinal cord pathologies [1]. The most frequently encountered imaging finding on MRI in these cases is abnormal hyperintense signal within the cord on T2 weighted images. This finding is common to the wide spectrum of conditions causing myelopathy and hence poses a diagnostic challenge to the radiologist. A systematic protocol for the evaluation of the imaging findings can help in reaching a diagnosis. The first step would be to identify the condition as a compressive or non-compressive myelopathy. Compressive myelopathies usually do not pose a diagnostic challenge as the aetiology is often self-explanatory. In this article, we will be dealing with non-compressive myelopathy due to intrinsic pathologies of the spinal cord.
Spinal cord signal can be classified into short segment involvement and long segment involvement. Short segment involvement extends over a length of less than two vertebral segments. Multiple sclerosis (MS) is the most common disease with short segment involvement [2]. Conditions like Neuromyelitis Optica (NMO), Transverse Myelitis and spinal cord infarcts characteristically produce long segment involvement [1,2].
The next step is to evaluate the caliber of the spinal cord to look for cord expansion or atrophy [1]. Spinal cord tumours and conditions associated with oedema, such as transverse myelitis, cause expansion of the cord. Absence of cord expansion suggests a non-neoplastic aetiology. Caliber of the cord may appear normal in other conditions such as Acute Disseminated Encephalomyelitis (ADEM). Certain conditions such as MS and Hirayama disease may be associated with cord atrophy, especially in the chronic stage.
The next principle is the pattern of distribution of the signal within the spinal cord on axial imaging. Complete cross-section of the spinal cord is usually involved in transverse myelitis and NMO. Multiple sclerosis usually involves only one half of the spinal cord. Lesions may also preferentially involve particular tracts, such as posterior column in Subacute Combined Degeneration (SACD) of the cord. Thus, spinal cord pathologies may involve particular regions of the cord on axial images. Lesions in MS may most commonly be posterior or lateral, while infarcts usually involve the anterior aspect of the cord. Cysts may be associated with spinal tumours. The cysts can be tumoural or non-tumoural. Non-tumoural cysts usually do not show enhancement on post contrast images and hence can be differentiated from tumoural cysts, which usually show peripheral enhancement on post contrast images [1,3]. The abnormal hyperintense spinal cord signal can further be characterised by the use of contrast [1].
Multiple Sclerosis
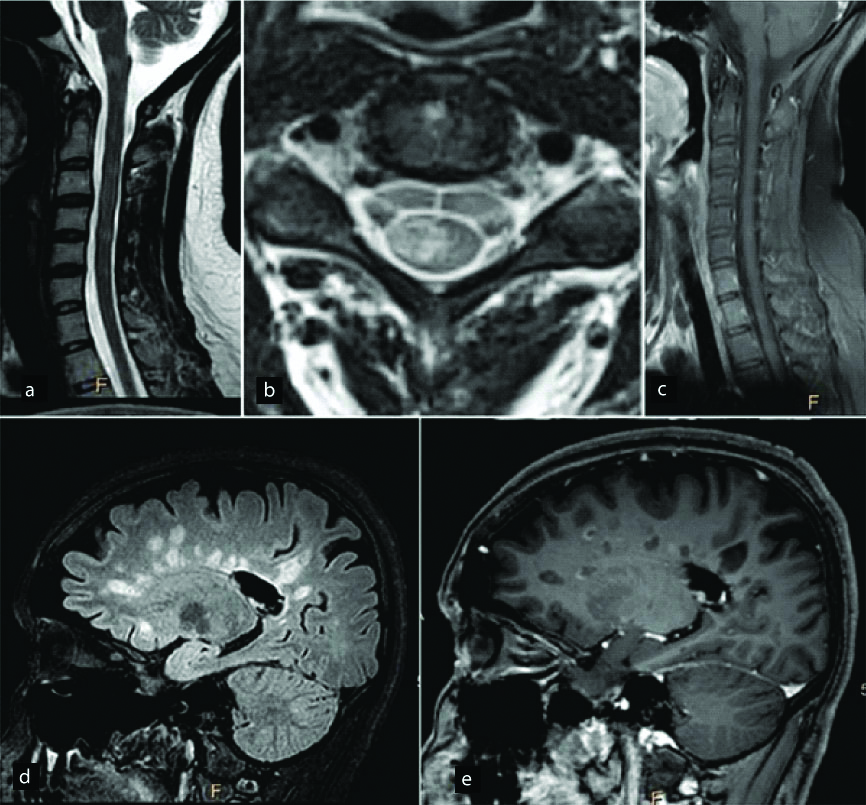
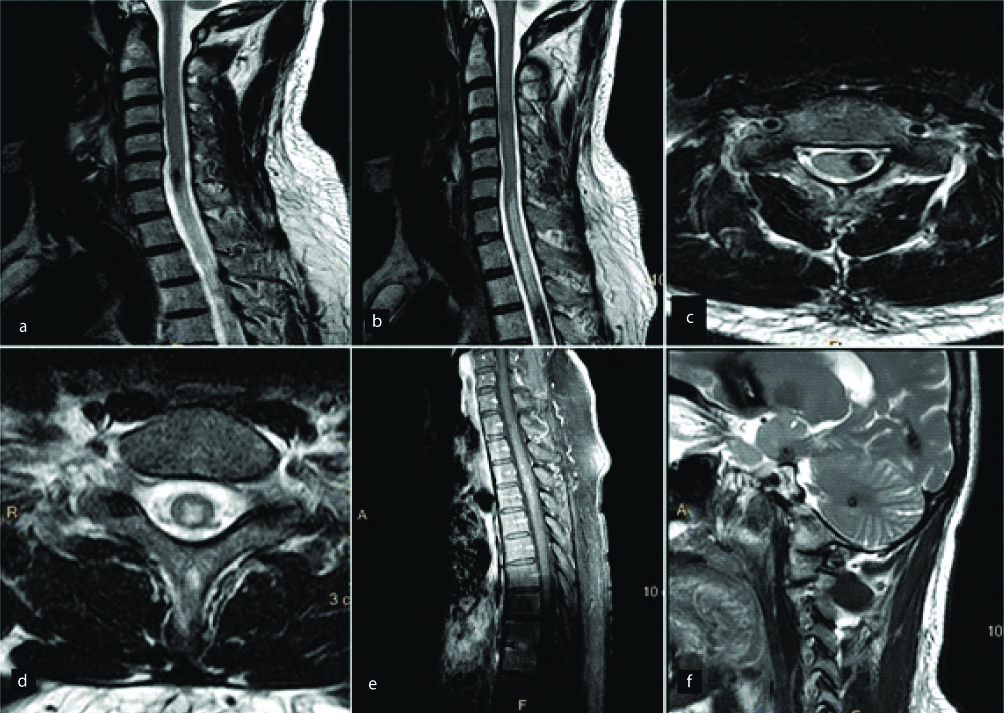
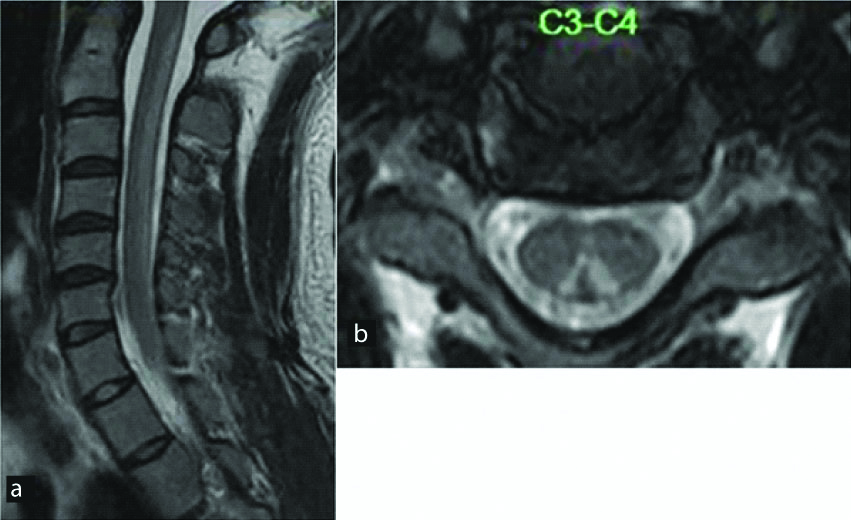
Multiple Sclerosis (MS) is an immune mediated demyelinating disease of the brain and the spinal cord. It is most commonly seen in middle aged women. It typically involves the posterior or lateral spinal cord with short segment involvement [Table/Fig-1]. Involvement of both gray and white matter is seen in cord lesions, as compared to predominant white matter involvement seen in brain lesions. Contrast enhancement due to disruption of the Blood-Brain Barrier (BBB) may be the first radiological feature before the appearance of abnormal signal on non-enhanced scans [4]. Chronic lesions may cause focal cord atrophy. A reduced Magnetization Transfer Ratio (MTR) can be used for diagnosis of MS due to the loss of myelin and the MTR value often correlates with the degree of demyelination [5].
In a diagnosed case of Multiple sclerosis, T2W sagittal images (a) of the cervical cord show abnormal hyperintense signal extending over a short segment (less than 2 vertebral segments). T2W axial image (b) shows that the abnormal hyperintensity is involving only the right posterolateral aspect of the cord without significant cord expansion. Mild enhancement is seen in some of these lesions on post contrast images (c). Sagittal FLAIR (d) and post contrast T1W (e) images of the brain show abnormal FLAIR hyperintense and T1 hypointense lesions in the periventricular white matter giving a classic Dawson’s finger appearance.
Neuromyelitis Optica
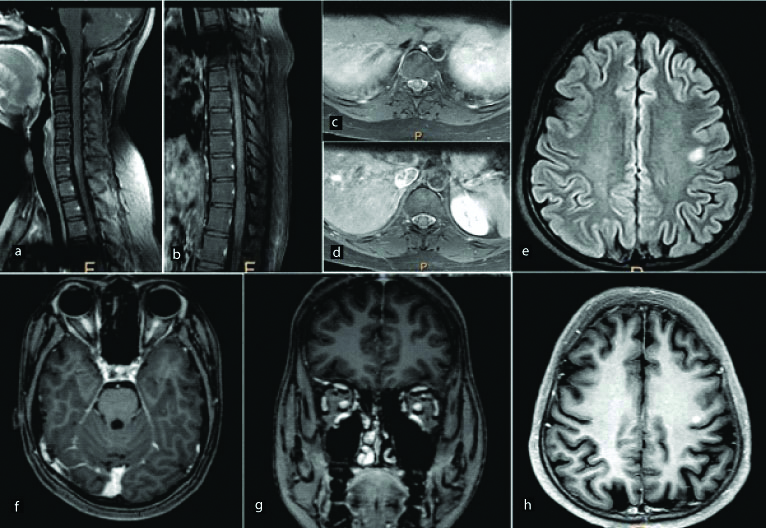
Neuromyelitis optica (NMO) is an inflammatory disorder of the central nervous system characterised by episodes of longitudinal transverse myelitis and optic neuritis [6]. The last decade has seen the evolution of NMO as a distinct entity called Neuromyelitis Optica Spectrum Disorder (NMOSD). The identification of autoantigen Aquaporin-4 (AQP4) and NMO-immunoglobulin (NMO-IgG) in NMOSD helps differentiation from Optic Neuritis in MS [7]. Spinal lesions in NMO are characteristically long segment lesions preferentially involving the central gray matter [8,9]. The lesions present as hyperintense signal on T2 and hypointense signal on T1 WI which may be associated with cord atrophy [Table/Fig-2]. These findings along with the classic findings of optic neuritis with a predominant posterior distribution [10] and periependymal lesions predominantly in the region of the third and fourth ventricles [11] point towards a diagnosis of NMO. Nonconventional MRI techniques such as MTR and Diffusion Tensor Imaging (DTI) have been implemented in some studies to differentiate NMO and MS [2].
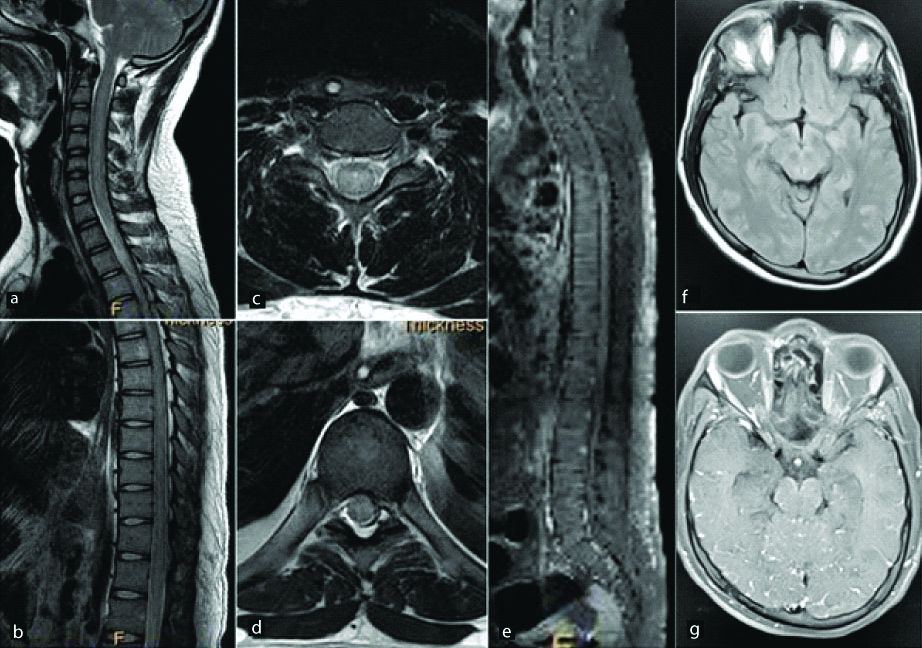
A 25-year-old female presented with blurring of vision in both eyes. Post contrast fat saturated T1 WI sagittal (a,b) and axial (c,d) images of the spinal cord show abnormal long segment enhancement in the cervical and dorsal spinal cord predominantly involving the central grey matter. Abnormal enhancement was also noted in the optic nerves extending up to the optic chiasma posteriorly (f,g). Axial sections of the brain show an abnormal hyperintense focus on FLAIR images (e) in the left frontal subcortical white matter. It shows nodular enhancement on post contrast images (h). Final diagnosis of neuromyelitis optica was made.
Transverse Myelitis
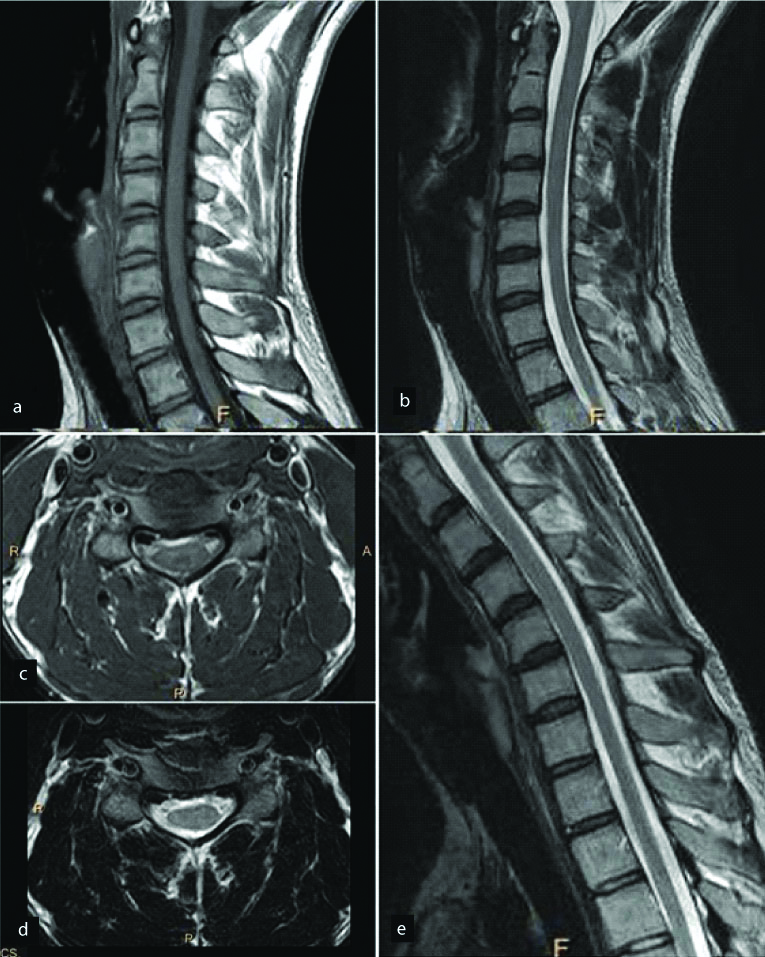
Transverse Myelitis (TM) is characterised by sudden onset of bilateral sensory, motor and autonomic dysfunction with a well-defined sensory level, in the absence of a pre-existing neurologic or systemic disease [12]. Pathogenetically, it is similar to acute disseminated encephalomyelopathy and is considered to be part of the spectrum of disseminated vasculomyelinopathy. On MRI, TM usually manifests with hyperintense signal on long TR/TE sequences in the central portion of the cord, involving both halves and more than two thirds of the cross-sectional area of the cord [Table/Fig-3]. In cases with large central hyperintensity, there is often evidence of a small dot isointense to the cord, commonly referred to as the “central dot” sign [12]. The abnormal signal intensity is seen to extend over multiple segments, from three to ten vertebrae in number. Cases with long segment involvement right from the cervical region to the conus medullaris have also been reported [13]. The acute stages are usually associated with cord swelling, abnormal signal intensity, or both [12]. The role of MRI, especially a single baseline scan, in determining the cause is questionable. However, the appearance of the cord changes as the disease evolves and serial scans may help in predicting the outcome [14]. The differentials that need to be considered in cases presenting with abnormal cord signal and swelling are acute plaques of multiple sclerosis and AIDS myelopathy [12]. However, unlike TM, multiple sclerosis usually presents with short segment posterior or lateral involvement of the cord and hence can be differentiated. It is also important to differentiate Longitudinally Extensive Transverse Myelitis (LETM) from NMO. The MRI findings of the Bright Spotty Lesions (BSL) on T2W images, central/central-peripheral T1 dark lesions, involvement of ≥50% of the cord area by the lesion and significant contrast enhancement in the lesions are distinctive features of NMO [15]. Associated intracranial findings specific to NMO further help to differentiate between these two conditions.
A 46-year-old female presented with sudden onset bilateral lower limb weakness with a well-defined sensory level. Long segment hyperintense signal is seen in the dorsal cord on sagittal T2W image (a). On axial T2W images (b,c), it is seen involving the entire cross-sectional area of cord. Final diagnosis of Transverse myelitis was made after excluding other aetiologies. Cervicodorsal cord atrophy was also seen which was due to previous episode of transverse myelitis.
Acute Disseminated Encephalomyelopathy (ADEM)
ADEM is a monophasic demyelinating disease of autoimmune aetiology that typically occurs following vaccination or febrile infection [16,17]. The peak incidence has been found in children in the age group of three to ten years. Spinal cord involvement is noted in 11 to 28% of the patients with ADEM [18]. ADEM lesions are typically multiple and appear hypointense on T1 WI, hyperintense on T2 WI [Table/Fig-4], may show restricted diffusion due to swelling of the myelin sheath and seepage of inflammatory cells and are most commonly seen in the anterior spinal cord. These lesions may show variable enhancement ranging from none to enhancing, including ring enhancement [19]. Microhaemorrhages have been reported in patients with ADEM. The closest differential diagnosis of ADEM is MS, and apart from the clinical picture and CSF findings, advanced imaging such as DTI and Magnetization Transfer Imaging (MTI) may be helpful in distinguishing between these two entities [20,21]. Holtmannspötter M et al., measured mean diffusivity (D̄) of basal ganglia grey matter using DTI and histogram analysis in patient of ADEM, MS and healthy controls and found higher average D̄ and lower D̄ histogram peak height of the basal ganglia in patient of ADEM than patients with MS [20]. They concluded that in presence of similar appearing MRI lesions, microscopic tissue damage occurs in the basal ganglia in ADEM, but not in MS. Inglese M et al., quantified the normal-appearing brain tissue and cervical cord disease in patients with ADEM using magnetization transfer and diffusion tensor MRI and compared the results with controls and MS patients [21]. They concluded that the normal-appearing brain and cervical cord are spared in ADEM pathology, but are often abnormal in MS.
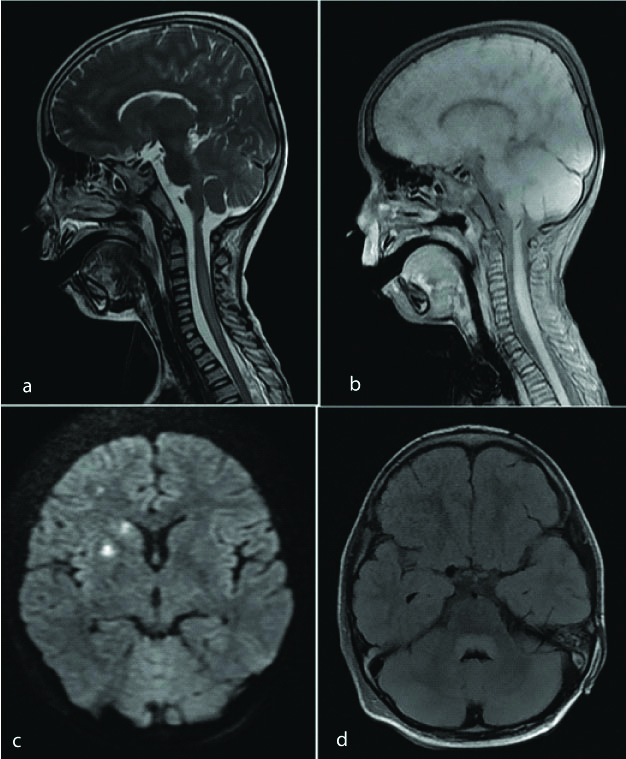
Sagittal T2 WI image of the cervical spinal cord shows long segment hyperintense signal (a). No significant enhancement noted on post contrast image (b). The patient was a diagnosed case of Japanese encephalitis, with MRI brain showing areas of restricted diffusion in right basal ganglia and right corona radiata (c) and non-enhancing FLAIR hyperintense signal in posterior aspect of midbrain and pons (d). These findings were consistent with diagnosis of ADEM.
Infection
Infective myelitis may be caused by various bacteria and viruses. The MRI findings in these conditions are variable ranging from long segment hyperintense cord signal [Table/Fig-5] to focal intramedullary abscesses. Intramedullary abscess is an uncommon pathology affecting the CNS. Haematogenous spread secondary to a systemic infection is also known. The infection may be polymicrobial, with bacteria being the causative organisms in most of the cases [22]. However, culture negative intramedullary abscesses have also been reported. The MRI signal intensity of the abscess may vary with the contents of the abscess. Usual presentation is a peripherally enhancing focal T2 hyperintense intramedullary lesion [Table/Fig-6]. Restriction on Diffusion-Weighted Imaging (DWI) sequence is a reliable parameter to differentiate abscesses from cystic tumours and necrosis and its importance has been documented in literature [23].
A 22-year-old male presented with bilateral lower limb weakness for 2 days. Sagittal (a,b) and axial (c,d) T2 WI show diffuse T2 hyperintense signal involving long segment of the spinal cord from C2 to conus medullaris without post contrast enhancement (e). Subtle FLAIR hyperintense signal is seen in bilateral occipital cerebral sulci with mild leptomeningeal enhancement (f,g). Diagnosis: Infective myelitis.
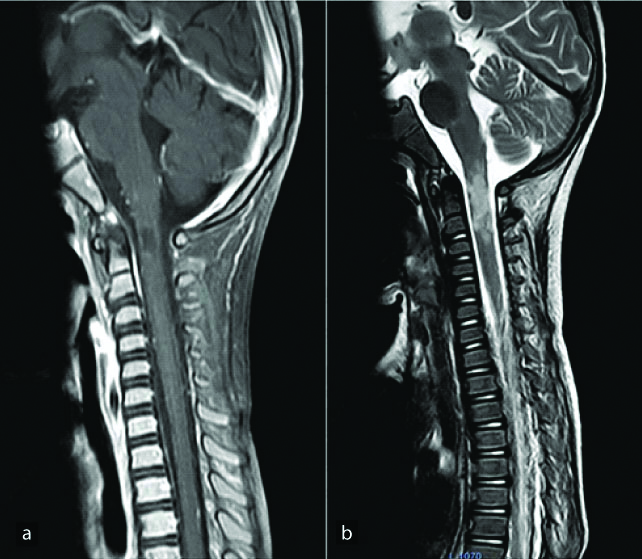
A three-year-old male presented with fever and sudden onset quadriparesis. Sagittal post contrast T1 WI image (a) reveals a peripherally enhancing lesion at C2 level with moderate perilesional oedema as seen on sagittal T2 WI (b). Diagnosis: Intramedullary abscess.
Spinal Tuberculosis
Spinal intramedullary tuberculoma is a very rare condition and accounts for only 2/100,000 cases of tuberculosis [24]. Spinal tuberculosis was first reported by Cascino and Dibble in 1956 [25]. Most common location for spinal tuberculomas is the thoracic cord. Spinal tuberculosis is almost always secondary to a primary focus elsewhere in the body. MRI findings of spinal intramedullary tuberculosis can vary during the different stages of evolution of the granuloma. Initial stages of the lesion are characterised by severe oedema and poor formation of the capsule. Subsequently, there is reduction in the peripheral oedema and the signal intensity of the lesion on T2 weighted images. The tuberculoma shows rim enhancement on post contrast images [Table/Fig-7]. Intramedullary tuberculosis may present atypically as arachnoiditis and intramedullary abscesses [26].
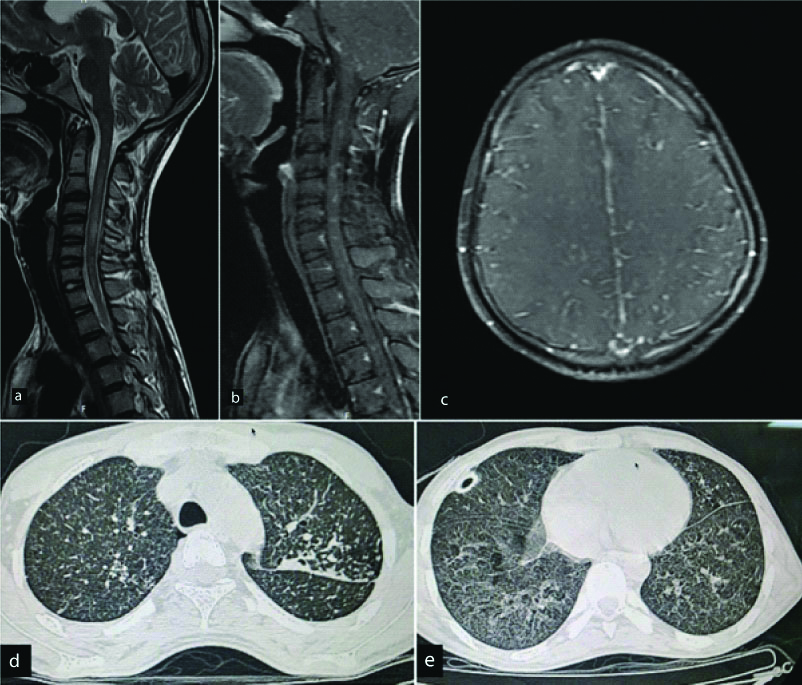
A 20-year-old male presented with sudden onset paraplegia. Sagittal T2 WI(a) of the cervical spinal cord show diffuse long segment T2 hyperintense cord signal. Multiple nodular enhancing lesions are noted in this region on post contrast images (b). Screening post contrast axial images of the brain reveal subtle nodular enhancing lesions in right corona radiata and bilateral leptomeningeal enhancement (c). Possibility of infective granulomatous aetiology like Tuberculosis was raised. HRCT Thorax revealed tree-in-bud type of opacities (d) and small cavity (e). Diagnosis: Tuberculosis with CNS involvement.
Ischemia of the Spinal Cord
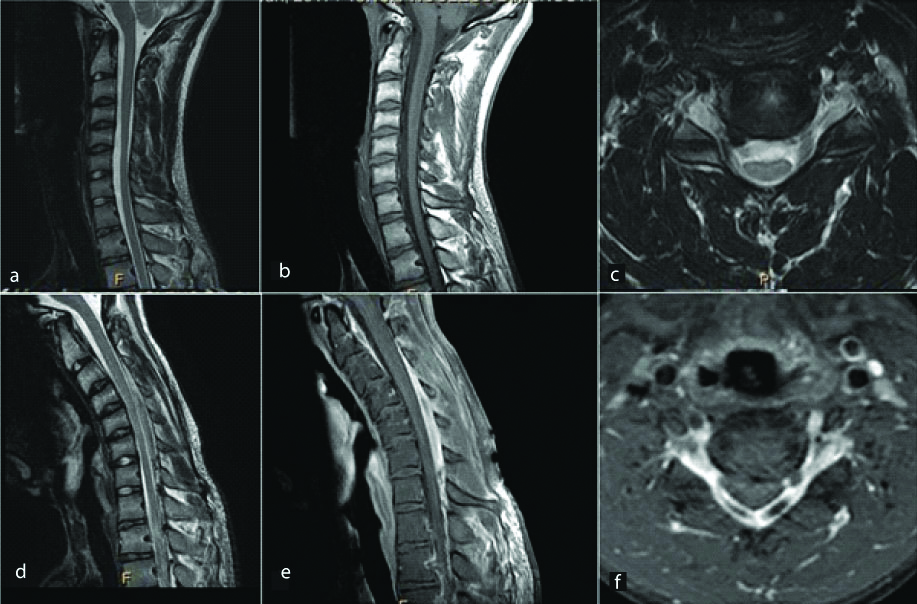
Spinal cord ischemia is an uncommon condition which may be caused by a number of underlying causes such as systemic hypotension, vertebral artery dissection, aortic disease and surgery, trauma, coagulopathy and cocaine abuse [27]. The infarcts of the spinal cord may further be classified as central and transverse infarctions due to general spinal cord hypoperfusion and ischemia and anterior or posterior spinal artery syndromes secondary to radicular artery territory infarction [28]. Spinal cord ischemia remains undetectable on routine imaging for the first few hours. However, it eventually (after approximately 3 hours) presents with abnormal T2 hyperintense cord signal and cord swelling [Table/Fig-8] [29]. Hence, interval and repeat scans must be carried out in patients with a high degree of suspicion of cord ischemia and an initial normal MRI. The use of DWI can help in early detection and confirmation of the diagnosis of cord infarct [30]. In the later stages, cord infarcts may show enhancement following Gadolinium administration. Hence, inclusion of DWI, intravenous contrast and serial scanning must be integrated into the protocol in every patient with a suspicion of cord ischemia.
A 52-year-old female presented with sudden onset bilateral lower limb weakness. Sagittal MR images of the dorsal spinal cord show a long segment T1 hypointense (a) and T2 hyperintense (b) signal in the cord with no post contrast enhancement (c). The signal abnormality is involving the entire thickness of the cord on axial T2W images (d) and shows restricted diffusion in diffusion weighted images (e). Diagnosis: Acute spinal cord infarct.

Spinal Cord Haemorrhage
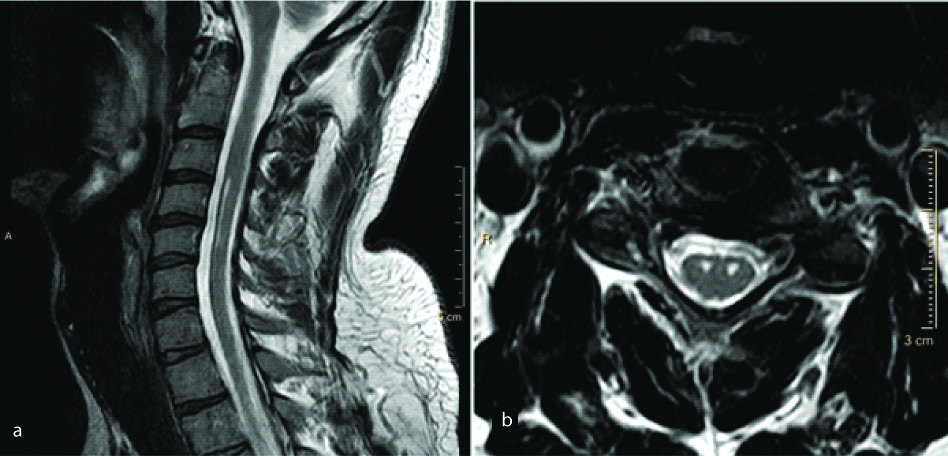
Tellegen first described spinal cord haematoma and haematomyelia in 1850 clinically [31]. Since then it continues to be a rare occurrence and usually presents with similar clinical features with a few variations according to the underlying cause. The most common presentation is sudden, localised, severe back pain which may or may not be associated with radiation and a corresponding neurological deficit. Stepwise subacute and chronic patterns of presentation are also known [32,33]. Though MRI and CT scan have facilitated imaging in spinal cord haemorrhage and haematoma, acute blood products may obscure the underlying condition. The most common cause of spinal cord haematoma is traumatic spinal cord injury [Table/Fig-9] [34], followed by other traumatic causes like spine and brain surgeries and chiropractor neck manipulations [35]. The other major group of conditions causing spinal cord haemorrhage is spinal cord arterio-venous malformations like cavernous angiomas [Table/Fig-10], venous angiomas and capillary telangiectasias [36]. The other miscellaneous conditions include anticoagulation, hereditary bleeding conditions, primary spinal cord tumours and metastases [31,33]. CT is the preferred modality for imaging in a case of acute spinal trauma. However, MRI is indispensable in cases with neurological deficit. Gradient Recalled Echo (GRE) and Susceptibility Weighted Imaging (SWI) offer accurate diagnosis of haemorrhage. The T2 images offer more resolution at the expense of less susceptibility effects, thus underestimating the presence and degree of haematoma.
A 22-year-old male with history of road traffic accident presented with quadriparesis. Sagittal images of the cervical spinal cord show a disc protrusion at C5-C6 Level with T2 hyperintense cord signal (a). A well-defined T2 hypointense lesion is noted in the left half of the spinal cord at the same level which was likely suggestive of haematoma (b). This was confirmed with sagittal SWI images (c). Diagnosis: Post-traumatic intramedullary haematoma.
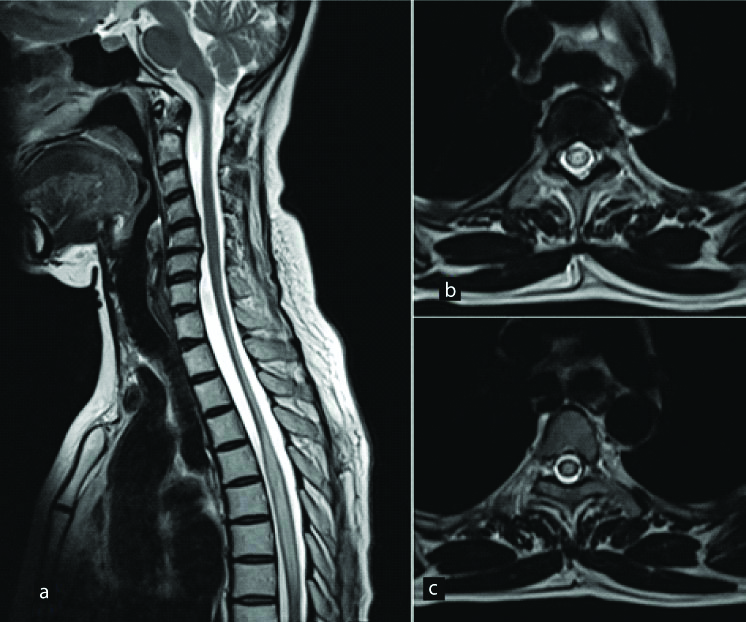
A 42-year-old male presented with gradually ascending neuropathy. Sagittal T2 WI of the cervical spinal cord show well defined intramedullary hypointense lesion (a) with surrounding oedema (b). On axial T2 WI, the lesion shows hypointense periphery with a heterogenous center (c,d). Mild heterogenous enhancement is seen in this region on post contrast images (e). Similar lesion was seen in the cerebellum (f). Diagnosis: Intramedullary cavernous angiomas with surrounding oedema.
Motor Neuron Disease
Motor neuron disease is a group of conditions characterised by rapidly progressive neurodegeneration. Motor neuron diseases typically involve the corticospinal tracts [37]. Both structural and functional imaging techniques can be implemented in the imaging of motor neuron disease. Structural techniques demonstrate the morphological changes in the gray and white matter as well as the associated cortical atrophy [Table/Fig-11]. Functional technique consists of DTI to detect the changes in brain activation, compensation and reorganisation.
A young patient presented with long standing right upper limb weakness. Sagittal T2W image (a) reveals hyperintense signal in anterior aspect of the spinal cord. Axial T2W image (b) reveals two hyperintense foci in the anterior horn cells giving it classic “cobra head appearance”. Diagnosis-Motor Neuron Disease.
Hirayama Disease
Hirayama is a sporadic juvenile muscular atrophy predominantly affecting young males characterised by insidious unilateral upper limb weakness affecting the lower cervical and upper thoracic nerve roots. Although the aetiology is debatable and probably multifactorial, disproportionate growth of the vertebral column and the spinal canal contents have mainly been implicated as the predisposing cause [38,39]. Imaging reveals antero-posterior thinning of the cord and abnormal cord signal. The condition can be identified by the formation of a crescentic posterior epidural space on sagittal scans in flexion due to forward migration of the dura [40] [Table/Fig-12]. This space shows enhancement on post contrast images. Newer advances include the implementation of Steady-State Free Precession (SSFP) sequences to substitute intravenous contrast [41]. Cord atrophy may be seen in absence of dural cleft sign and abnormal cord signal [Table/Fig-13]. The exact aetiology in such cases remains indeterminate.
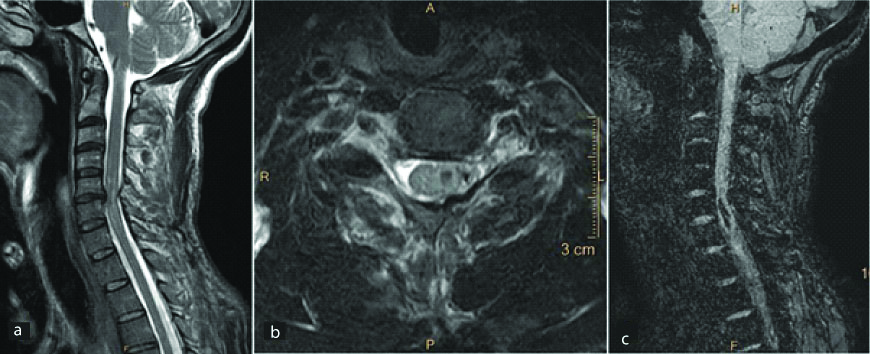
A young male presented with complaints of right upper limb weakness and atrophy of the corresponding muscles. T2 (a) and T1(b) weighted sagittal and T2W axial (c) images of the cervical spine show antero-posterior thinning of the spinal cord from the C5 to the T1 vertebral levels predominantly involving the right half of the cord. Diffuse abnormal T2 hyperintensity is noted within the cord at the same level. Sagittal T2 WI in neck flexion reveal characteristic “dural cleft” sign extending from C3 to C7 vertebral level (d) which shows homogenous enhancement on post contrast images (e,f). Diagnosis: Hirayama’s disease.
A 21-year-old male presented with weakness and tingling in right hand with atrophy of the muscles. Sagittal T1 (a) and T2 (b) weighted images reveal mild cord atrophy at C7 to T1 level. This was confirmed on axial images which reveal right hemicord atrophy at this level (c,d). Flexion T2 weighted sagittal images (e) were obtained which ruled out the possibility of Hirayama disease. Diagnosis: Right hemicord atrophy.
Nutritional Causes
The most common nutritional cause of abnormal T2 hyperintense spinal cord signal is vitamin B12 deficiency. It occurs predominantly in vegetarians. However, it may also be precipitated by pernicious anemia, small bowel bacterial overload, tropical sprue or post-ileal resection surgery. The imaging features are characteristically referred to as “inverted rabbit ears” appearance or the “inverted v” appearance [Table/Fig-14] [42]. This is the result of predominant involvement of the posterior column which gives rise to bilateral symmetrical foci of abnormal signal in the posterior spinal cord predominantly in the lower cervical and upper thoracic region [43]. On sagittal images, it can be perceived as a single line along the long axis of the spinal cord. In later stages, the signal abnormality may also involve the lateral columns. Confluent T2 hyperintensities in the brain may be also be detected at imaging. Reversal and improvement of the abnormal signal after vitamin B12 supplementation is seen. Similar signal may also be seen with vitamin E and copper deficiency [44,45].
A 25-year-old male patient presented with bilateral upper limb tingling and numbness. T2 W sagittal images (a) reveal long segment hyperintense signal in the posterior aspect of spinal cord with classic “inverted V shape” on axial T2W images (b). Diagnosis: Subacute combined degeneration of the cord (SACD).
Conclusion
In a case of myelopathy, MRI is the modality of choice, both for differentiation of compressive from non-compressive myelopathy and also to differentiate between various causes of non-compressive myelopathy. The commonest finding in non-compressive myelopathy is hyperintense cord signal on T2-weighted images. MRI characterisation of this abnormal hyperintense signal in terms of length of signal, distribution of signal on transverse images, pattern of contrast enhancement along with detailed clinical history and CSF findings help in diagnosing the cause of myelopathy.
[1]. Do-Dai DD, Brooks MK, Goldkamp A, Erbay S, Bhadelia RA, Magnetic resonance imaging of intramedullary spinal cord lesions: A pictorial reviewCurr Probl Diagn Radiol 2010 39(4):160-85.10.1067/j.cpradiol.2009.05.00420510754 [Google Scholar] [CrossRef] [PubMed]
[2]. Filippi M, Rocca MA, Moiola L, Martinelli V, Ghezzi A, Capra R, MRI and magnetization transfer imaging changes in the brain and cervical cord of patients with Devic’s Neuromyelitis OpticaNeurology 1999 53(8):1705-10.10.1212/WNL.53.8.170510563616 [Google Scholar] [CrossRef] [PubMed]
[3]. Goy AM, Pinto RS, Raghavendra BN, Epstein FJ, Kricheff II, Intramedullary spinal cord tumours: MR imaging, with emphasis on associated cystsRadiology 1986 161(2):381-86.10.1148/radiology.161.2.37639053763905 [Google Scholar] [CrossRef] [PubMed]
[4]. Grossman RI, Braffman BH, Brorson JR, Goldberg HI, Silberberg DH, Gonzalez-Scarano F, Multiple sclerosis: serial study of gadolinium-enhanced MR imagingRadiology 1988 169(1):117-22.10.1148/radiology.169.1.34202463420246 [Google Scholar] [CrossRef] [PubMed]
[5]. Brochet B, Dousset V, Pathological correlates of magnetization transfer imaging abnormalities in animal models and humans with multiple sclerosisNeurology 1999 53(5 suppl 3):S12-17. [Google Scholar]
[6]. Wingerchuk DM, Hogancamp WF, O’Brien PC, Weinshenker BG, The clinical course of neuromyelitisoptica (Devic’s syndrome)Neurology 1999 53:1107-14.10.1212/WNL.53.5.110710496275 [Google Scholar] [CrossRef] [PubMed]
[7]. Lennon VA, Wingerchuk DM, Kryzer TJ, Pittock SJ, Lucchinetti CF, Fujihara K, A serum autoantibody marker of neuromyelitisoptica: Distinction from multiple sclerosisLancet 2004 364(9451):2106-12.10.1016/S0140-6736(04)17551-X [Google Scholar] [CrossRef]
[8]. Wingerchuk DM, Lennon VA, Pittock SJ, Lucchinetti CF, Weinshenker BG, Revised diagnostic criteria for neuromyelitis opticaNeurology 2006 66(10):1485-89.10.1212/01.wnl.0000216139.44259.7416717206 [Google Scholar] [CrossRef] [PubMed]
[9]. Nakamura M, Miyazawa I, Fujihara K, Nakashima I, Misu T, Watanabe S, Preferential spinal central gray matter involvement in neuromyelitisoptica: An MRI studyJ Neurol 2008 255(2):163-70.10.1007/s00415-008-0545-z18231705 [Google Scholar] [CrossRef] [PubMed]
[10]. Khanna S, Sharma A, Huecker J, Gordon M, Naismith RT, Van Stavern GP, Magnetic resonance imaging of optic neuritis in patients with neuromyelitis optica versus multiple sclerosisJ Neuroophthalmol 2012 32:216-20.10.1097/WNO.0b013e318254c62d22659839 [Google Scholar] [CrossRef] [PubMed]
[11]. Pittock SJ, Weinshenker BG, Lucchinetti CF, Wingerchuk DM, Corboy JR, Lennon VA, Neuromyelitis optica brain lesions localized at sites of high aquaporin 4 expressionArch Neurol 2006 63(7):964-68.10.1001/archneur.63.7.96416831965 [Google Scholar] [CrossRef] [PubMed]
[12]. Murthy JM, Reddy JJ, Meena AK, Kaul S, Acute transverse myelitis: MR characteristicsNeurol India 1999 47(4):290-93. [Google Scholar]
[13]. Misra UK, Kalitha U, Kumar S, A clinical, MRI and neurophysiological study of acute transverse myelitisJ Neurol Sci 1996 138(1-2):150-56.10.1016/0022-510X(95)00353-4 [Google Scholar] [CrossRef]
[14]. Sanders KA, Khandji AG, Mohr JP, Gadolinium-MRI in acute transverse myelopathyNeurology 1990 40(10):1614-16.10.1212/WNL.40.10.16142215955 [Google Scholar] [CrossRef] [PubMed]
[15]. Pekcevik Y, Mitchell CH, Mealy MA, Orman G, Lee IH, Newsome SD, Differentiating neuromyelitisoptica from other causes of longitudinally extensive transverse myelitis on spinal magnetic resonance imagingMult Scler 2016 22(3):302-11.10.1177/135245851559106926209588 [Google Scholar] [CrossRef] [PubMed]
[16]. Dale RC, Branson JA, Acute disseminated encephalomyelitis or multiple sclerosis: Can the initial presentation help in establishing a correct diagnosis?Arch Dis Child 2005 90(6):636-39.10.1136/adc.2004.06293515908633 [Google Scholar] [CrossRef] [PubMed]
[17]. Menge T, Hemmer B, Nessler S, Wiendl H, Neuhaus O, Hartung HP, Acute disseminated encephalomyelitis: An updateArch Neurol 2005 62(11):1673-80.10.1001/archneur.62.11.167316286539 [Google Scholar] [CrossRef] [PubMed]
[18]. Sanchez AMG, Posada LMG, Toscano CAO, Lopez AL, Diagnostic approach to myelopathiesRev Colomb Radiol 2011 22(3):1-21. [Google Scholar]
[19]. Tenembaum S, Chitnis T, Ness J, Hahn JS, International pediatric MS study groupAcute disseminated encephalomyelitisNeurology 2007 68(16 suppl 2):S23-S36.10.1212/01.wnl.0000259404.51352.7f17438235 [Google Scholar] [CrossRef] [PubMed]
[20]. Holtmannspötter M, Inglese M, Rovaris M, Rocca MA, Codella M, Filippi M, A diffusion tensor MRI study of basal ganglia from patients with ADEMJ Neurol Sci 2003 206(1):27-30.10.1016/S0022-510X(02)00310-6 [Google Scholar] [CrossRef]
[21]. Inglese M, Salvi F, Iannucci G, Mancardi GL, Mascalchi M, Filippi M, Magnetization transfer and diffusion tensor MR imaging of acute disseminated encephalomyelitisAJNR Am J Neuroradiol 2002 23(2):267-72. [Google Scholar]
[22]. Chan CT, Gold WL, Intramedullary abscess in the spinal cord in the antibiotic era: Clinical features, microbial etiologies, trends in pathogenesis, and outcomesClin Infect Dis 1998 27:619-26.10.1086/5146999770164 [Google Scholar] [CrossRef] [PubMed]
[23]. Kim YJ, Chang KH, Song IC, Kim HD, Seong SO, Kim YH, Brain abscess and necrotic brain tumour: Discrimination with signal intensity on diffusion-weighted MR imagingAJR Am J Roentgenol 1998 171(6):1487-90.10.2214/ajr.171.6.98432759843275 [Google Scholar] [CrossRef] [PubMed]
[24]. Lu M, Imaging diagnosis of spinal intramedullary tuberculoma: case reports and literature reviewJ Spinal Cord Med 2010 33(2):159-62.10.1080/10790268.2010.1168969120486535 [Google Scholar] [CrossRef] [PubMed]
[25]. Cascino J, Dibble JB, Tuberculoma of spinal cordJAMA 1956 162(5):461-62.10.1001/jama.1956.72970220003006a13357332 [Google Scholar] [CrossRef] [PubMed]
[26]. Tanriverdi T, Kizilkiliç O, Hanci M, Kaynar MY, Unalan H, OZ B, Atypical intradural spinal tuberculosis: report of three casesSpinal Cord 2003 41(7):403-09.10.1038/sj.sc.310146312815372 [Google Scholar] [CrossRef] [PubMed]
[27]. Alblas CL, Bouvy WH, Lycklama À, Nijeholt GJ, Boiten J, Acute spinal-cord ischemia: Evolution of MRI findingsJ Clin Neurol 2012 8(3):218-23.10.3988/jcn.2012.8.3.21823091532 [Google Scholar] [CrossRef] [PubMed]
[28]. Novy J, Carruzzo A, Maeder P, Bogousslavsky J, Spinal cord ischemia: clinical and imaging patterns, pathogenesis, and outcomes in 27 patientsArch Neurol 2006 63(8):1113-20.10.1001/archneur.63.8.111316908737 [Google Scholar] [CrossRef] [PubMed]
[29]. Weidauer S, Nichtweiss M, Lanfermann H, Zanella FE, Spinal cord infarction: MR imaging and clinical features in 16 casesNeuroradiology 2002 44(10):851-57.10.1007/s00234-002-0828-512389137 [Google Scholar] [CrossRef] [PubMed]
[30]. Thurnher MM, Bammer R, Diffusion-weighted MR imaging (DWI) in spinal cord ischemiaNeuroradiology 2006 48(11):795-801.10.1007/s00234-006-0130-z16977443 [Google Scholar] [CrossRef] [PubMed]
[31]. Kreppel D, Antoniadis G, Seeling W, Spinal haematoma: A literature survey with meta-analysis of 613 patientsNeurosurg Rev 2003 26(1):1-49.10.1007/s10143-002-0224-y12520314 [Google Scholar] [CrossRef] [PubMed]
[32]. Zevgaridis D, Medele RJ, Hamburger C, Steiger HJ, Reulen HJ, Cavernous haemangiomas of the spinal cord. A review of 117 casesActa Neurochir (Wien) 1999 141(3):237-45.10.1007/s00701005029310214479 [Google Scholar] [CrossRef] [PubMed]
[33]. Matsumura A, Ayuzawa S, Doi M, Enomoto T, Takeuchi S, Yoshii Y, Chronic progressive hematomyelia: Case reports and review of the literatureSurg Neurol 1999 51(5):559-63.10.1016/S0090-3019(97)00442-4 [Google Scholar] [CrossRef]
[34]. Boldin C, Raith J, Fankhauser F, Haunschmid C, Schwantzer G, Schweighofer F, Predicting neurologic recovery in cervical spinal cord injury with postoperative MR imagingSpine (Phila Pa 1976) 2006 31(5):554-59.10.1097/01.brs.0000201274.59427.a416508551 [Google Scholar] [CrossRef] [PubMed]
[35]. Kewalramani LS, Kewalramani DL, Krebs M, Saleem A, Myelopathy following cervical spine manipulationAm J Phys Med 1982 61(4):165-75. [Google Scholar]
[36]. Anson JA, Spetzler RF, Interventional neuroradiology for spinal pathologyClin Neurosurg 1992 39:388-417. [Google Scholar]
[37]. Kassubek J, Ludolph AC, Müller HP, Neuroimaging of motor neuron diseasesTher Adv Neurol Disord 2012 5(2):119-27.10.1177/175628561243756222435076 [Google Scholar] [CrossRef] [PubMed]
[38]. Schröder R, Keller E, Flacke S, Schmidt S, Pohl C, Klockgether T, MRI findings in Hirayama’s disease: flexion-induced cervical myelopathy or intrinsic motor neuron disease?J Neurol 1999 246(11):1069-74.10.1007/s00415005051410631640 [Google Scholar] [CrossRef] [PubMed]
[39]. Hassan KM, Sahni H, Jha A, Clinical and radiological profile of Hirayama disease: A flexion myelopathy due to tight cervical dural canal amenable to collar therapyAnn Indian Acad Neurol 2012 15(2):106-12.10.4103/0972-2327.9499322566723 [Google Scholar] [CrossRef] [PubMed]
[40]. Chen CJ, Hsu HL, Tseng YC, Lyu RK, Chen CM, Huang YC, Hirayama flexion myelopathy: Neutral position MR Imaging findings-importance of loss of attachmentRadiology 2004 231(1):39-44.10.1148/radiol.231103000415068939 [Google Scholar] [CrossRef] [PubMed]
[41]. Raval M, Kumari R, Dung AA, Guglani B, Gupta N, Gupta R, MRI findings in Hirayama diseaseIndian J Radiol Imaging 2010 20(4):245-49.10.4103/0971-3026.7352821423896 [Google Scholar] [CrossRef] [PubMed]
[42]. Sen A, Chandrasekhar K, Spinal MR imaging in Vitamin B12 deficiency: Case series; differential diagnosis of symmetrical posterior spinal cord lesionsAnn Indian Acad Neurol 2013 16(2):255-58.10.4103/0972-2327.11248723956577 [Google Scholar] [CrossRef] [PubMed]
[43]. Naidich MJ, Ho SU, Case 87: subacute combined degenerationRadiology 2005 237(1):101-05.10.1148/radiol.237103175716183926 [Google Scholar] [CrossRef] [PubMed]
[44]. Goodman BP, Chong BW, Patel AC, Fletcher GP, Smith BE, Copper deficiency myeloneuropathy resembling B12 deficiency: Partial resolution of MR imaging findings with copper supplementationAJNR Am J Neuroradiol 2006 27(10):2112-14. [Google Scholar]
[45]. Vorgerd M, Tegenthoff M, Kühne D, Malin JP, Spinal MRI in progressive myeloneuropathy associated with vitamin E deficiencyNeuroradiology 1996 38(Suppl 1):S111-13.10.1007/BF022781348811695 [Google Scholar] [CrossRef] [PubMed]