Schizophrenia is one of the most devastating psychiatric condition, clinically identified by presence of any of these- delusions, hallucinations, jumbled language, grossly unsystematic or catatonic behaviour, or negative symptoms for more than one month [1]. It is a genetic disease that affects the brain and nervous system whose chemical nature is still not completely understood [2]. The imbalance between oxidative stress and antioxidant defence systems may be the underlying disease mechanism in schizophrenia [3-5].
Clinical Antipsychotic Trials of Intervention Effectiveness baseline data reported prevalence of Metabolic Syndrome (MetS) to be 41% from the National Cholesterol Education Program criteria and 43% as per American Heart Association criteria respectively in patients with schizophrenia [6]. It is now well established from many study results that oxidative stress to be involved in the pathogenesis of obesity, hypertension, diabetes, dyslipidemia, malignancy, etc., [7]. In the previous few years, researchers reported that schizophrenic patients may have increased levels of uric acid and this may be taken into consideration as a link between pro-inflammatory and prothrombotic state in MetS [8]. Since the 19th century, various studies addressed the strong positive association between high SUA and future risk of cardiovascular disease, diabetes, hypertension but hardly any follow-up studies were done in India to measure biochemical changes for six months after the start of treatment in drug naïve schizophrenia patients [9]. Earlier studies accounted for decreased levels of SUA in Alzheimer’s disease, Parkinson’s disease, Multiple Sclerosis, Optic Neuritis, and also in Schizophrenia. While elevated levels of SUA were also reported in some neurological disease like bipolar disorder and epilepsy [10].
In newly diagnosed schizophrenia patient, when treated with second-generation antipsychotics, it leads to an increase in body weight, dyslipidemia resulting development of MetS [9]. Reddy R et al., in their study found a decrease in SUA level after the withdrawal of haloperidol treatment in schizophrenia patients which explains the effect of the antipsychotic drug on purine metabolism [4]. Few studies measured increased fasting UA level whereas others reported no change in its level after antipsychotic treatment in schizophrenic patients. Antipsychotic drugs induce oxidative stress in their body affecting neutrophil cells to release inflammatory markers in circulation after its degranulation. These liberated inflammatory particles influence SUA level which is considered as an independent risk factor for endothelial dysfunction that leads to psychiatric and neurological impairments [8].
The utility of increased SUA level as a risk factor and its association with other metabolic changes in schizophrenia remains debatable. To address metabolic changes of antipsychotic treatment in schizophrenia, this prospective study was planned with our first objective to measure the BMI, BP and biochemical changes by estimating FBS, TC, TG, HDL-cholesterol and SUA and secondly, to determine correlation between SUA with other parameters in newly diagnosed schizophrenia before treatment and after treatment of three months and six months of follow-up.
Materials and Methods
Study Subjects
This prospective observational study was carried out between October 2016 to December 2018 in the Department of Biochemistry, Faculty of Medicine and Health Sciences, SGT (Shree Guru Gobind Singh Tricentenary) University Gurugram, Haryana in collaboration with the Department of Psychiatry, Gwalior Mansik Arogyashala, Gwalior, Madhya Pradesh, India.
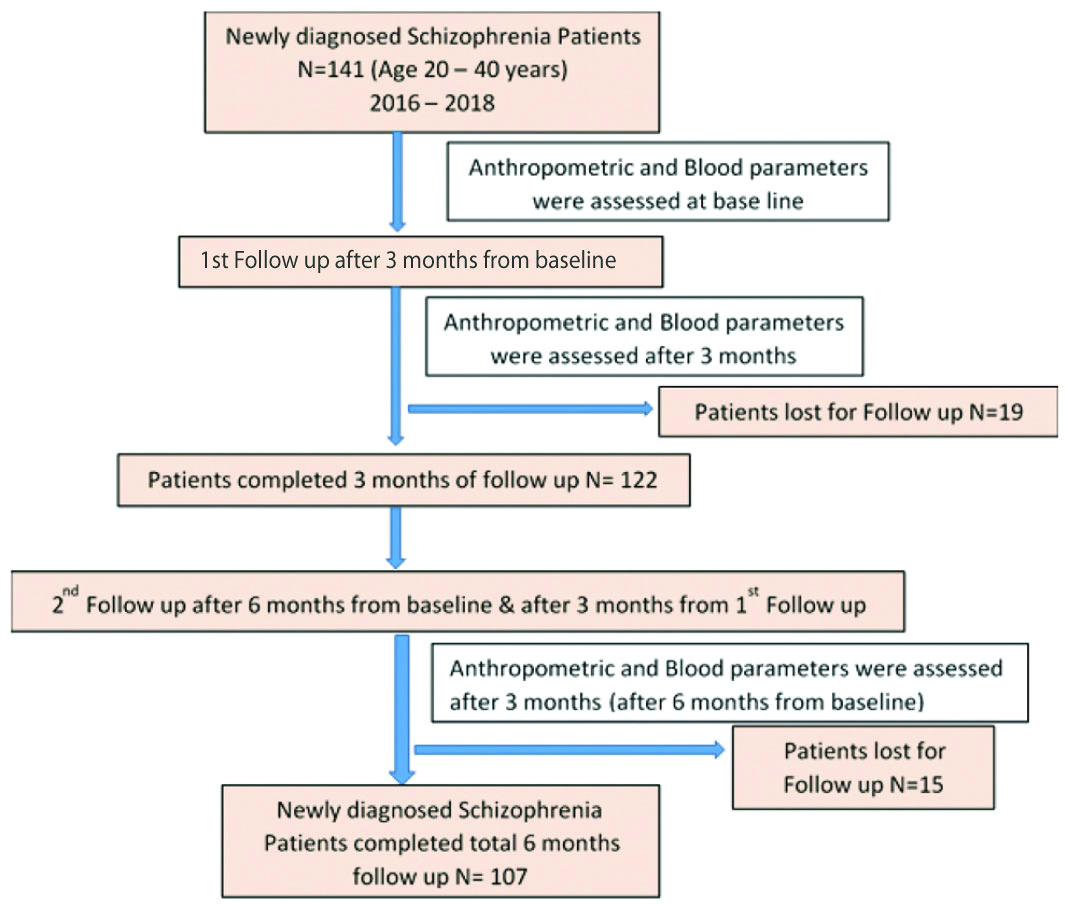
After obtaining the institutional ethical committee approval (SGTU/FMHS/MICRO/341 S. No. 20, dated 20/08/2016), physically active 141 newly diagnosed Drug-naïve both outdoor and indoor schizophrenia patients between 20-40 years of age were enrolled after confirmation from consultant psychiatrists at Gwalior Mansik Arogyashala, Gwalior [Table/Fig-1]. The sample size (n) was calculated using the following formula: Z2(p*q)/d2 . Where Z2 is 1.96 at 95% confidence interval, p is prevalence, q is (1-p) at 90% power and d2 is error of 5%. Diagnosis of schizophrenia was made as per the ICD -10 criteria [11,12]. Before enrolment into the study, informed and written consent was taken from all the patients or their relatives. All measures were carried out in compliant with the Helsinki declaration of 1964 and its later amendments.
Patients on antipsychotic drug treatment (without changing their drugs during the course of the study), known comorbid medical illnesses (metabolic, endocrinal disorders which influence free radical status, uric acid levels), already having 3 or more the following: (a) WC >102 cm in men, >88 cm in women, (b) TG ≥150 mg/dL, (c) HDL-c <40 mg/dL in men and <50 mg/dL in women, (d) BP ≥130/85 mmHg, (e) FBS ≥110 mg/dL components for MetS based on National Cholesterol Education Program Adult Treatment Panel III (NCEP:ATPIII) criteria [13], and other psychiatric illnesses were excluded. Pregnant or breastfeeding women, or individuals with history of drug abuse (alcohol, amphetamine, and opioid), mental retardation, mood disorder, organic neurological or mental illness, patients with abnormal renal or liver profile and on drugs (aspirin, β-blockers, Cytotoxic agents, Cyclosporin, loop/thiazide Diuretics, Ethambutol, Fructose, Lactic acid, Nicotinic acid, Niacin, Theophylline, Pyrazinamide etc.,) or diet (red meat, fish, egg etc.,) affecting uric acid metabolism were also excluded from the study [14,15].
Anthropometric Measurements
Based on inclusion and exclusion criteria out of 141 newly diagnosed schizophrenia patients who were exclusively screened and followed-up till six months, 107 subjects were carefully chosen to look the metabolic and anthropometric changes done by newly prescribed drug (atypical antipsychotics) and the disease itself. Documentation of anthropometric measurements (WC, weight, height, and BMI, BP) were done before the start of the therapy i.e., at baseline (on first visit), at the 3rd and 6th month after the start of antipsychotic drug therapy. Using a measuring tape, WC was measured in centimeters in the horizontal plane middle to the inferior margin of the ribs and the superior border of the iliac crest; the amount is noted at the end of usual expiration. Body weight of the individuals was recorded by the adult balance in an upright situation to the nearest 0.1 kg. Height was recorded with the help of stadiometer at the uppermost head level, to the nearest 1.0 cm. Using Quetelet’s Index formula, BMI was calculated manually by weight (kilograms) divided by the square of the height (meters) which is expressed as kg/m2 [16]. Using automated digital BP device, two BP reading was recorded 30 seconds apart after the participant sat on a chair with the left arm supported at the height of the device and rested for at least 5 minutes. A third BP reading was recorded if the previous 2 BP readings differed by more than 10 mmHg. Mean of the 2 nearby readings was taken in the study.
Blood Samples Collection and Biochemical Analysis
Minimum 8 to 12 hours overnight, 5 mL of fasting venous blood in plain and fluoride vacutainer was collected for biochemical analysis before the start of the therapy and at the 3rd and 6th months after the start of antipsychotic drug therapy to assess the changes. Immediately after blood collection serum and plasma were separated using centrifuge machine at 5000 rpm for 5 minutes test were analysed on daily basis for SUA, TG, HDL-c, TC, and FBS level using Erba Diagnostics Kit., USA. Plasma glucose was measured by glucose oxidase peroxidase method (GOD/POD method). TC was assessed in serum by the CHOD-PAP method. TG was assayed in serum by the method of GPO-PAP End point assay. HDL-cholesterol by (CHOD-PAP) method. Uric acid was estimated by Uricase-Peroxidase method using TRANSASIA ERBA Chem 7 semi-autoanalyser as per manufacturer’s directions. Independent standard graphs for each test were used to decide their measured results; intra-run Coefficient of Variance was <10% for all the parameters.
Statistical Analysis
All data was found parametric tested by plotting histograms using Statistical Package for Social Science (SPSS, Chicago, IL, USA) version 20.0, which were expressed as mean±SD (standard deviation). Paired t-test was used to analyse the difference in mean for all normal quantitative variables between each measuring time point. Correlation analysis was done using Pearson’s correlation coefficient to determine the relationship between uric acid and other variables. Microsoft Excel Worksheet was used to generate a scatter plot or their graphical representation. The p-value <0.05 was considered statistically significant.
Results
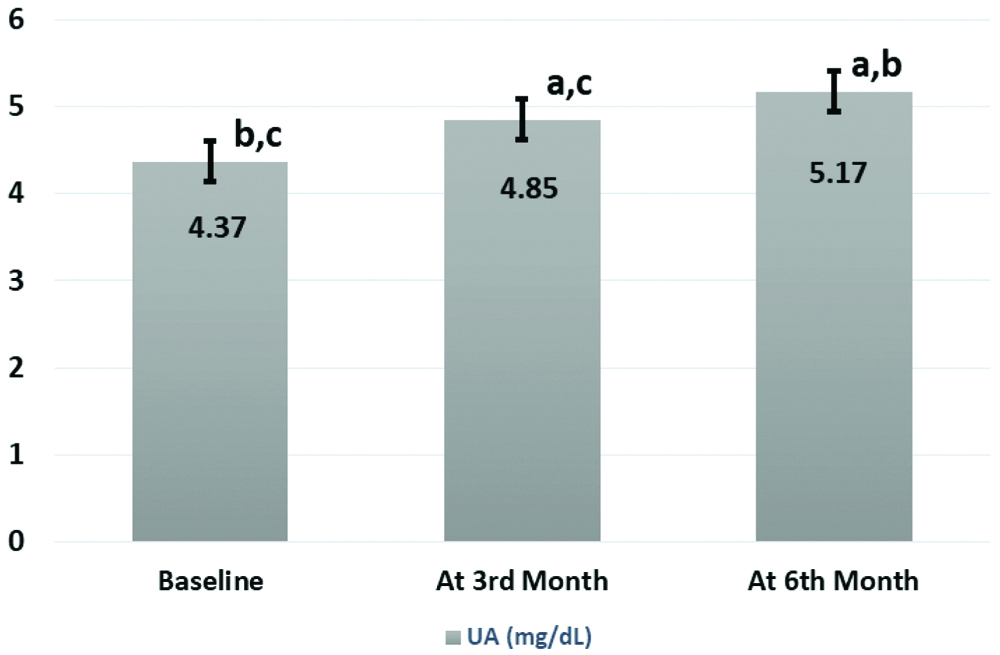
Anthropometric and biochemical data of all 107 newly diagnosed schizophrenic patients who were followed at baseline, three months and six months are shown in [Table/Fig-2]. After starting treatment significantly high mean values of BMI, SBP, DBP, FBS, TC, TG, and SUA were recorded when compared between the groups except HDL-c which was reduced. Highest changes in all variables were noticed after six months compared to three months of the start of antipsychotic treatments. Significant (p<0.001) increased UA levels after six months (5.17±1.3) were found in respect to three months (4.85±1.5) after and before the start of treatment group (4.37±1.6) as demonstrated in [Table/Fig-2,3].
Comparison of anthropometry and biochemical mean values in newly diagnosed schizophrenic patients at baseline, 3rd month and 6th month.
| Variables | Baseline (n=107) (Mean±SD) | After 3rd Month (n=107) (Mean±SD) | After 6th Month (n=107) (Mean±SD) |
|---|
| Weight (kg) | 57.8±11b,c | 62±11.8a,c | 66.8±13.5a,b |
| Height (m) | 1.59±0.09 | 1.59±0.09 | 1.59±0.09 |
| BMI (kg/m2) | 22.7±4.1b,c | 24.3±4.5a,c | 26.3±5.2a,b |
| WC (cm) | 78.7±9.6b,c | 83.3±9.9a,c | 89.3±11.5a,b |
| TC (mg/dL) | 148.9±37.1b,c | 160.5±38.3a,c | 174.5±49.8a,b |
| TG (mg/dL) | 113.2±42.4b,c | 137.2±54.6a,c | 158.1±77.6a,b |
| HDL (mg/dL) | 44.9±6.4b,c | 41.7±7.1a,c | 38.8±7.9a,b |
| SBP (mmHg) | 117.9±11.7b,c | 121.3±10.8a,c | 124.9±12a,b |
| DBP (mmHg) | 76.4±9.2b,c | 79.1±8.5a,c | 81.3±10.1a,b |
| FBS (mg/dL) | 95.5±27b,c | 100.6±31.1a,c | 105.6±33a,b |
| UA (mg/dL) | 4.37±1.6b,c | 4.85±1.5a,c | 5.17±1.3a,b |
BMI: Body mass index; WC: Waist circumference; TC: Total cholesterol; TG: Triglyceride; HDL: High density lipoprotein; SBP: Systolic blood pressure; DBP: Diastolic blood pressure; FBS: Fasting blood sugar; UA: Uric acid
p<0.001 is significant using paired t test denoted as ‘a’ for baseline, ‘b’ for after 3rd month, ‘c’ for after 6th month
Error bar showing mean comparison of serum uric acid level at baseline, 3rd month and 6th month.
UA: Uric acid
p<0.001 is significant using paired t test denoted as ‘a’ for baseline, ‘b’ for after 3rd month, ‘c’ for after 6th month
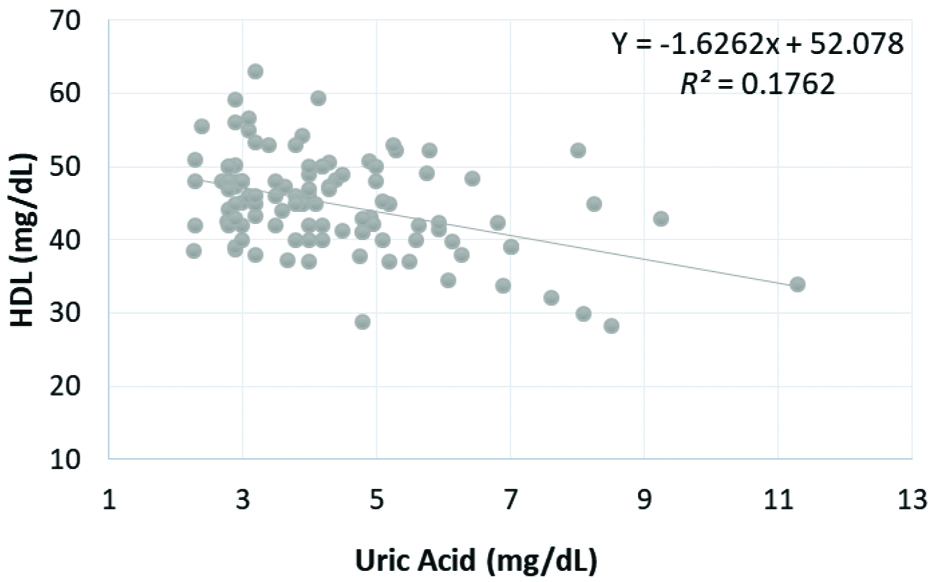
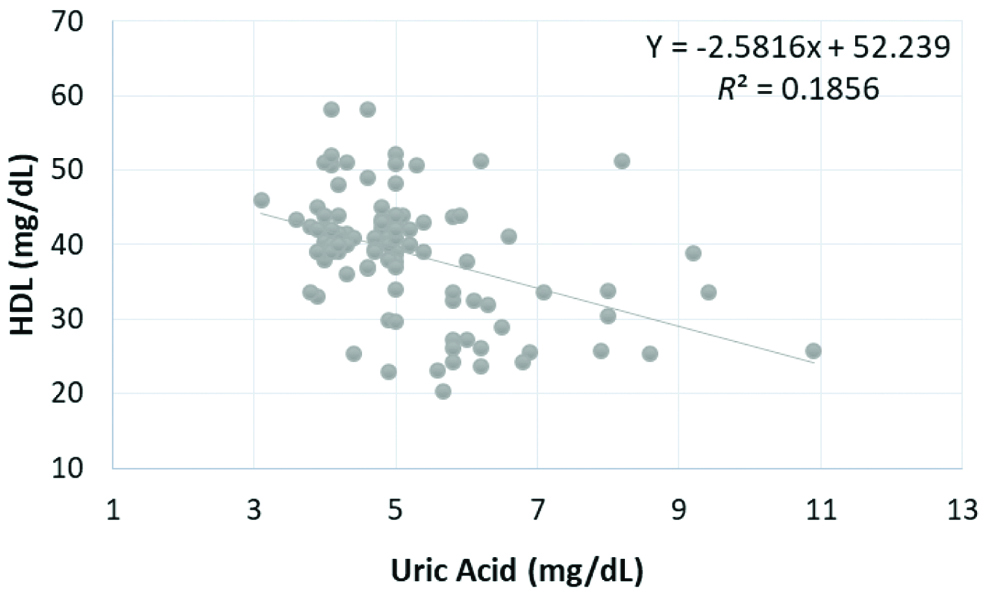
Pearson’s correlation coefficients analysis for associations obtained between the SUA and BMI, SBP, DBP, FBS, TC, TG, HDL cholesterol at three levels of treatment are presented in [Table/Fig-4]. Inverse relationship was found between UA and HDL cholesterol which was statistically significant after 6 months (Pearson r=-0.431, p<0.001), 3rd months (Pearson r=-0.283, p<0.05), and before beginning of treatment (Pearson r=-0.42, p<0.001) as shown in [Table/Fig-5,6 and 7], respectively.
Correlation of serum uric acid with variables at baseline, 3rd month and 6th month.
| Variables | | Baseline (n=107) | After 3rd Month (n=107) | After 6th Month (n=107) |
|---|
| BMI (kg/m2) | r | -0.050 | 0.006 | 0.018 |
| p | 0.606 | 0.953 | 0.855 |
| WC (cm) | r | -0.122 | -0.046 | 0.011 |
| p | 0.210 | 0.637 | 0.914 |
| TC (mg/dL) | r | -0.167 | -0.172 | -0.055 |
| p | 0.086 | 0.077 | 0.574 |
| TG (mg/dL) | r | -0.014 | 0.014 | 0.094 |
| p | 0.883 | 0.888 | 0.333 |
| HDL (mg/dL) | r | -0.420 | -0.283 | -0.431 |
| p | <0.001* | 0.003* | <0.001* |
| SBP (mmHg) | r | -0.028 | -0.028 | 0.017 |
| p | 0.775 | 0.775 | 0.864 |
| DBP (mmHg) | r | -0.047 | -0.047 | -0.029 |
| p | 0.634 | 0.634 | 0.763 |
| FBS (mg/dL) | r | 0.052 | 0.052 | 0.112 |
| p | 0.595 | 0.595 | 0.252 |
BMI: Body mass index; WC: Waist circumference; TC: Total cholesterol; TG: Triglyceride; HDL: High density lipoprotein; SBP: Systolic blood pressure; DBP: Diastolic blood pressure; FBS: Fasting blood sugar; UA: Uric acid
p<0.001 is significant using Pearson’s correlation coefficient
Correlation of serum uric acid level with HDL at baseline.
HDL: High density lipoprotein, p<0.001 is significant
Correlation of serum uric acid level with HDL at 3rd month.
HDL: High density lipoprotein, p<0.05 is significant
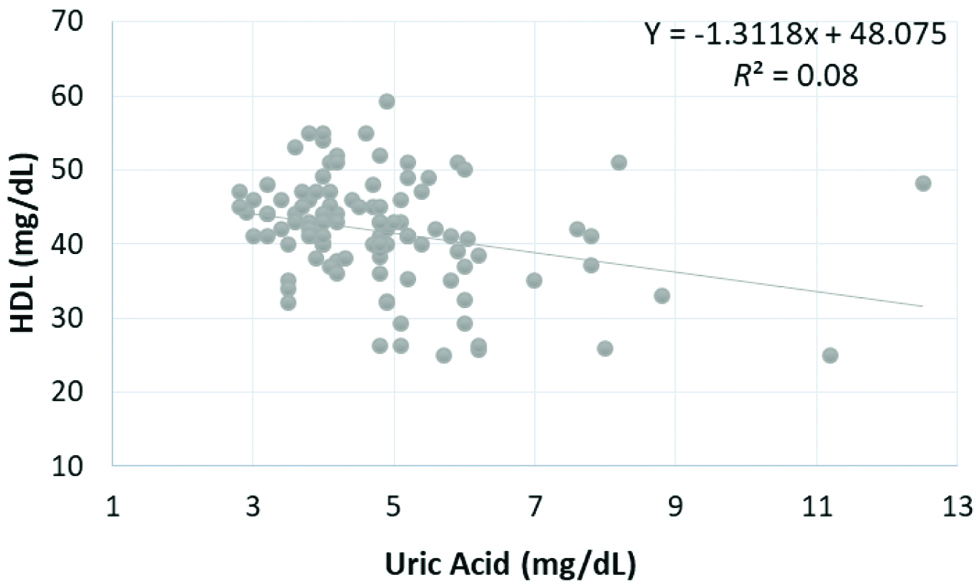
Correlation of serum uric acid level with HDL at 6th month.
HDL: High density lipoprotein, p<0.001 is significant
Discussion
Using diverse approaches, comprehensive studies on schizophrenia have been conducted regarding its aetiology, but still, researchers mainly focused on two causes. Firstly, defect in the dopaminergic system of the brain and secondly decreased total antioxidant defence system. However, the effect of dopaminergic system is totally indirect on which most of today’s antipsychotic drugs act. Yao et al., converge to the point after referring different theoretical model that is stress-mediated free radical injury to the neuronal membrane, which hampers different signal transduction pathways, ion channels and neurotransmitter receptors on which antipsychotic drug affects [17]. Till now there are two class of drugs available for the treatment of schizophrenia, a first group which acts mainly on dopaminergic system (typical or first-generation antipsychotic) and the second group of drugs which mainly acts on multiple neurotransmitter systems (atypical or second-generation antipsychotic drugs) [18]. In 1950, the first case of “Phenothiazine diabetes” was reported due to first-generation antipsychotics and later anecdotal case reports as well as drug safety studies linked disturbance of glucose metabolism, increased body weight by atypical antipsychotic drugs clozapine and olanzapine as well [19].
The present will be the first study which tried to measure the biochemical changes produced by the second-generation antipsychotic drugs in newly diagnosed schizophrenia patients in India. Results of a present cause-effect longitudinal study in drug naïve schizophrenic patients, which were not treated earlier, had the least serum UA compared to after treatment at 3rd and 6th months by antipsychotic drugs. Significantly highest values of all biochemical markers FBS, TC and TG, as well as increased BP and BMI, were recorded after 6th month then 3rd months of treatment reflecting the indirect effect of these drugs on different biochemical metabolism whereas HDL-cholesterol is reduced more after 6 months of treatment compared to 3rd months. Hence showing HDL-c to be negatively correlated with SUA. In the present study, results are opposite to the Dahake HS et al., and Reddy R et al., findings, they reported decreased levels of SUA after treatment in the initial stage of schizophrenics compared to controls. Reasons explained in their study for decreased SUA levels are oxidation of SUA by singlet oxygen and destroyed by hydroxyl radical during its antioxidant defence mechanism [1,4]. Whereas Pae CU et al., did not found any significant difference in SUA level between drug-naive patients with a first episode and the risperidone treated chronic schizophrenia patients. They also suggested the decrease in the antioxidant levels may be involved in the generation of negative symptoms in schizophrenia [20].
In this study, increasing trend of mean SUA level in drug naïve from 4.37 mg/dL to 4.85 and 5.17 mg/dL after 3rd and 6th months of treatment respectively, closely link the increase in oxidative stress as an effect of antipsychotic drugs in schizophrenic patients. This high SUA might be the culprit for an increase in BMI, BP, WC, TC, TG, FBS, and decrease in HDL after 6 months of treatment when compared from drug naïve patients. After 90 days of antipsychotic treatment in schizophrenic patients, we hypothesise that the stimulation of purine metabolism leading to increased generation of reactive oxygen species which may cause lipid peroxidation and decreased antioxidant protection. Impaired cholinergic system stimulated insulin release via blockage of muscarinic M2 receptors, by these drugs, could be the possible mechanism for the increase in body weight and alteration in glucose metabolism.
Uric acid; an oxidative end product of purine catabolism or one of the nucleic acid metabolism ubiquitously present is also affected by these drugs. In reference to previous studies, high SUA levels and future risk of MetS is very well correlated with the other risk factors of hypertension, cardiovascular disease, diabetes and overweight [8]. There are two antioxidant defence mechanism (enzymatic and non-enzymatic) which works simultaneously to maintain the homeostasis between the generation of free radicals and controlling its expansion to cause injury. In serum, more than two-third of total non-enzymatic antioxidant defence is produced by UA, albumin, and ascorbic acid. Analysis of specific antioxidant molecule especially SUA yields sufficient information about the status of oxidative stress [21,22].
There are various deleterious stimuli to the different circulatory endothelium and their wall which quicken atherosclerotic changes to cause atheroscleropathy. SUA level higher than upper one-third of normal serum level i.e., more than 4 mg/dL is one such injurious stimulus to cause oxidative redox stress-mediated atheroscleropathy. Hayden MR et al., described an important theory regarding the occurence of atheroscleropathy in the antioxidant-pro-oxidant urate redox shuttle. This shuttle explains how SUA level when below 4 mg/dL or in early normal range act as an antioxidant and becomes pro-oxidant when its level rises >4 mg/dL in this environmental milieu paradoxically (antioxidant→pro-oxidant). Considering SUA >4 mg/dL as a ‘Red Flag’ sign for early endothelial damage to initiate atheroscleropathy related morbidity like diabetes, hypertension, cardiovascular diseases, MetS, etc., [23]. Oxidative stress caused by increased SUA resulting in lipid peroxidation, inflammation has also been proposed phenomenon in the pathogenesis of schizophrenia. Decreased HDL-cholesterol after 3rd and 6th months of antipsychotic treatment and also its significant inverse correlation. SUA authenticate our results with another study result that it is the oxidative redox stress-mediated atheroscleropathy which lead to lipid peroxidation in schizophrenia. UA play a dual role in our body as protective (peroxynitrite scavenger) or as a risk factor (pro-inflammatory marker). Hyperuricaemia related to cause MetS, firstly because of reducing nitric oxide bioavailability which relaxes endothelium of arterial wall to cause atherosclerosis and secondly it induces inflammation as well as oxidative damage to adipocytes to cause obesity [9]. Bhole V et al., in its two generations prospective Framingham Heart Study also documented that people having high SUA as an independent future risk for development of type 2 diabetes in young as well as elderly age group. One prospective study in Rotterdam also marked SUA >6.2 mg/dL had 1.68 times higher risk of developing type 2 diabetes than in individual having SUA ≤4.5 mg/dL [24]. In combination with these outcomes from the study reports, present results suggest the presence of independent correlation between SUA levels and the incidence of MetS.
The strength of this study include its study design which followed newly diagnosed schizophrenia patients up to six months in statistically sufficient sample size and the rigorous inclusion and exclusion criteria.
Limitation and Scope of The Study
Certain unmeasured factors or residual confounding factors causing stress to the patient were not considered i.e., oxidative stress markers were not studied/evaluated. So, in future experimental as well as the human prospective study should be done to clarify the effect of the atypical anti-psychotic drug on uric acid metabolism. A possible limitation could be the sample size for generalising the results although it was calculated statistically with 95% confidence interval and 90% power. Randomised control trial should be done in schizophrenic patients with uric acid lowering drug to control the adverse effect of each individual atypical antipsychotic drugs.
Conclusion
To the best of our knowledge, this study is going to be the first study in India to report an increase in SUA as an effect of antipsychotic treatment after follow-up of six months. From our preliminary data, we hypothesise the cause-effect association of high SUA to increase the BMI, BP, TC, TG, FBS and decrease the HDL-c in schizophrenia patient after six months of treatment. SUA also showed an inverse correlation with HDL-c. So, prolong hyperuricemia in schizophrenia may lead to an incidence of diabetes, hypertension, MetS, etc. Thus, SUA level should be closely investigated and therapeutic strategies to monitor its level to the lower half of the reference range should be made to prevent complication in schizophrenia treated patient.
BMI: Body mass index; WC: Waist circumference; TC: Total cholesterol; TG: Triglyceride; HDL: High density lipoprotein; SBP: Systolic blood pressure; DBP: Diastolic blood pressure; FBS: Fasting blood sugar; UA: Uric acid
p<0.001 is significant using paired t test denoted as ‘a’ for baseline, ‘b’ for after 3rd month, ‘c’ for after 6th month
BMI: Body mass index; WC: Waist circumference; TC: Total cholesterol; TG: Triglyceride; HDL: High density lipoprotein; SBP: Systolic blood pressure; DBP: Diastolic blood pressure; FBS: Fasting blood sugar; UA: Uric acid
p<0.001 is significant using Pearson’s correlation coefficient